

Old Dominion vs Virginia Tech Live Score (12 Sep, 2026)
Score by Quarter
| Team | Q1 | Q2 | Q3 | Q4 | Final |
|---|---|---|---|---|---|
 Old Dominion |
3 | 3 | 7 | 8 | 21 |
 Virginia Tech |
17 | 17 | 3 | 7 | 44 |
Scoring Plays
Q1
10:23
10:23
J. Love 39 yd FG GOOD
Field Goal Good
0 – 3
Q1
3:01
3:01
M. Hawkins Jr. run for 20 yds, for a TD (J. Love KICK)
Rushing Touchdown
0 – 10
Q1
2:29
2:29
Q. Henicle sacked by M. Williams for -6 yds, T. Flowers fumbled, return for 14 yds for a TD (J. Love KICK)
Fumble Recovery (Own)
0 – 17
Q1
0:04
0:04
N. Eichner 34 yd FG GOOD
Field Goal Good
3 – 17
Q2
8:23
8:23
E. Grunkemeyer pass to L. Reynolds for 10 yds, for a TD (J. Love KICK)
Pass Reception
3 – 24
Q2
6:51
6:51
E. Grunkemeyer pass to L. Reynolds for 16 yds, for a TD (J. Love KICK)
Passing Touchdown
3 – 31
Q2
3:10
3:10
J. Love 22 yd FG GOOD
Field Goal Good
3 – 34
Q2
0:02
0:02
N. Eichner 51 yd FG GOOD
Field Goal Good
6 – 34
Q3
6:33
6:33
J. Love 25 yd FG GOOD
Field Goal Good
6 – 37
Q3
1:14
1:14
Q. Henicle pass to L. Haughton Jr. for 7 yds, for a TD (N. Eichner KICK)
Passing Touchdown
13 – 37
Q4
11:03
11:03
E. Grunkemeyer run for 1 yd, for a TD (J. Love KICK)
Rushing Touchdown
13 – 44
Q4
7:49
7:49
Q. Henicle run for 76 yds, for a TD (Two-Point Conversion failed) (Two-Point Conversion failed), Virginia Tech Penalty, passinterference (S. Covil Jr.
Rushing Touchdown
21 – 44
Game Leaders
Old DominionVirginia Tech
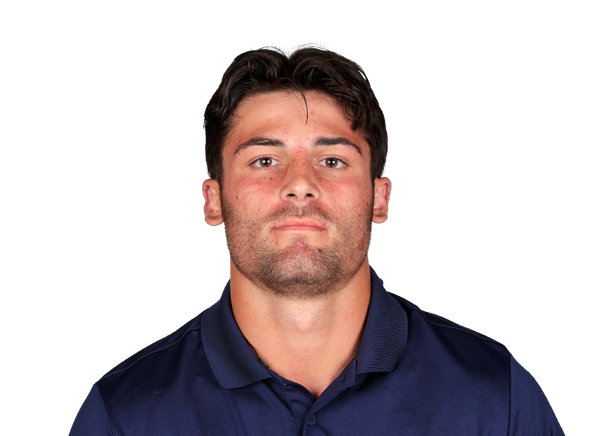 Q. Henicle QB
Passing Yards
 E. Grunkemeyer QBQ. Henicle QB
Rushing Yards
 J. Overton Jr. RB
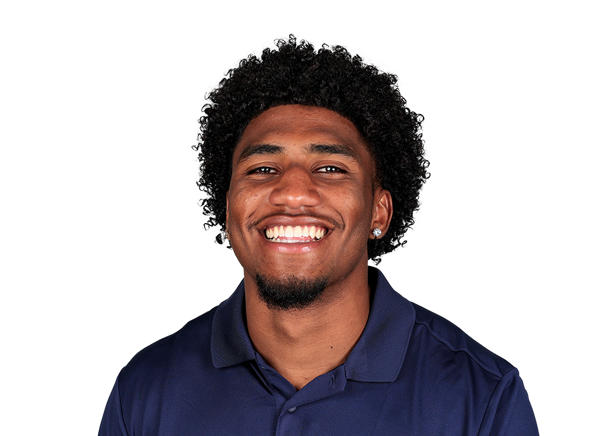 J. Rodriguez WR
Receiving Yards
 L. Reynolds TE
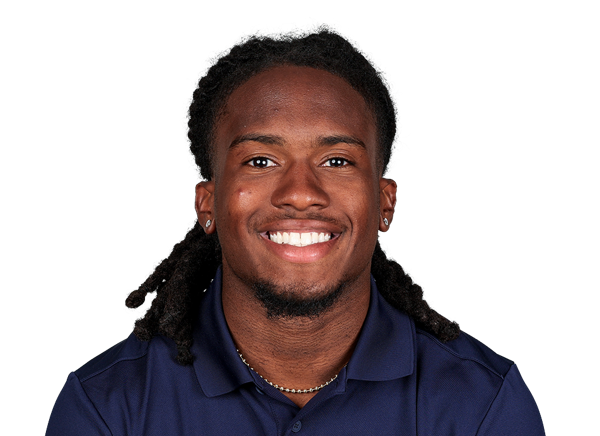 B. Crutchfield CB
Sacks
 M. Williams DL
 M. Thompson LB
Tackles
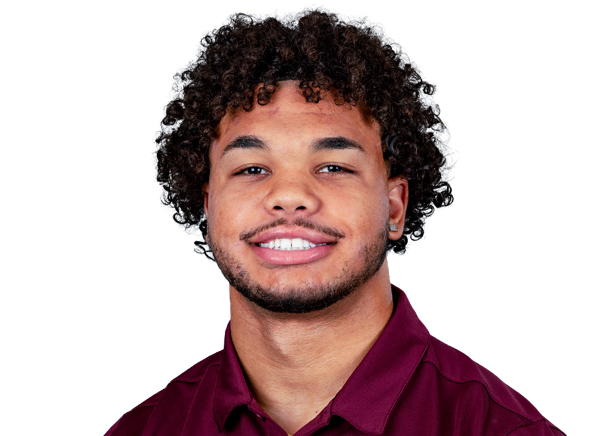 K. Spencer LB
Player Box Score
Old Dominion| Player | C/ATT | YDS | AVG | TD | INT |
|---|---|---|---|---|---|
| Quinn Henicle#10 | 13/21 | 187 | 8.9 | 1 | 0 |
Virginia Tech| Player | C/ATT | YDS | AVG | TD | INT |
|---|---|---|---|---|---|
| Ethan Grunkemeyer#17 | 31/42 | 327 | 7.8 | 2 | 0 |
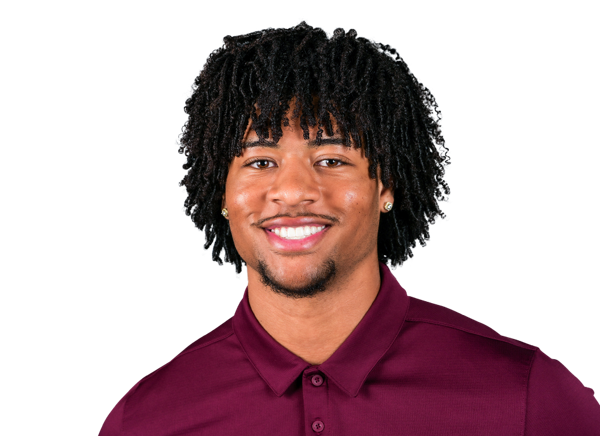 Bryce Baker#22 | 1/2 | 0 | 0.0 | 0 | 0 |
Old Dominion| Player | CAR | YDS | AVG | TD | LONG |
|---|---|---|---|---|---|
| Quinn Henicle#10 | 16 | 83 | 5.2 | 1 | 76 |
 Devin Roche#3 | 9 | 45 | 5.0 | 0 | 21 |
 Trey Hall#6 | 3 | 2 | 0.7 | 0 | 2 |
 Ja'Varien Salter#26 | 2 | -2 | -1.0 | 0 | 1 |
| Team | 1 | -5 | -5.0 | 0 | 5 |
Virginia Tech| Player | CAR | YDS | AVG | TD | LONG |
|---|---|---|---|---|---|
| Jeffrey Overton Jr.#16 | 14 | 47 | 3.4 | 0 | 8 |
 Marcellous Hawkins Jr.#27 | 11 | 43 | 3.9 | 1 | 20 |
| Bryce Baker#22 | 4 | 21 | 5.3 | 0 | 21 |
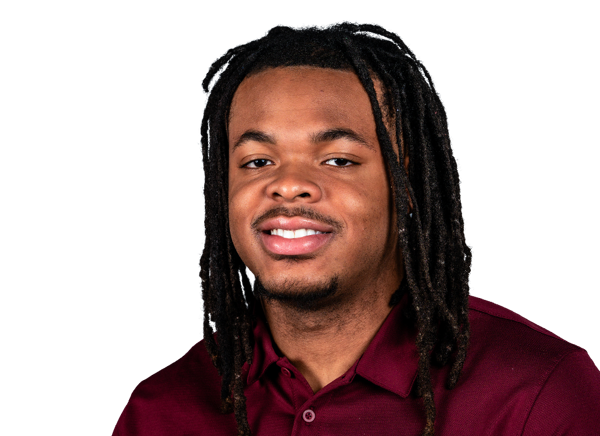 Messiah Mickens#26 | 3 | 11 | 3.7 | 0 | 8 |
 Tyler Mason#23 | 2 | 1 | 0.5 | 0 | 2 |
| Luke Reynolds#85 | 1 | -2 | -2.0 | 0 | 0 |
 Tyseer Denmark#4 | 1 | -7 | -7.0 | 0 | 0 |
| Ethan Grunkemeyer#17 | 6 | -25 | -4.2 | 1 | 2 |
Old Dominion| Player | REC | YDS | AVG | TD | LONG |
|---|---|---|---|---|---|
| Josh Rodriguez#8 | 3 | 89 | 29.7 | 0 | 34 |
 JJ Harrell#1 | 3 | 36 | 12.0 | 0 | 30 |
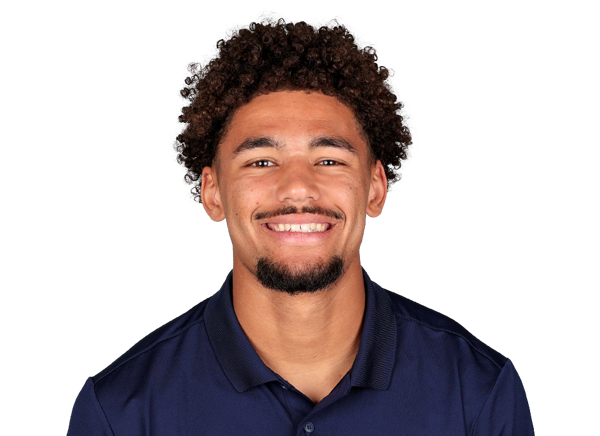 Kendall Harris#7 | 2 | 24 | 12.0 | 0 | 14 |
 TJ Johnson#11 | 3 | 23 | 7.7 | 0 | 10 |
 Lonnie Johnson#13 | 1 | 8 | 8.0 | 0 | 8 |
 Leon Haughton Jr.#86 | 1 | 7 | 7.0 | 1 | 7 |
Virginia Tech| Player | REC | YDS | AVG | TD | LONG |
|---|---|---|---|---|---|
| Luke Reynolds#85 | 8 | 108 | 13.5 | 2 | 21 |
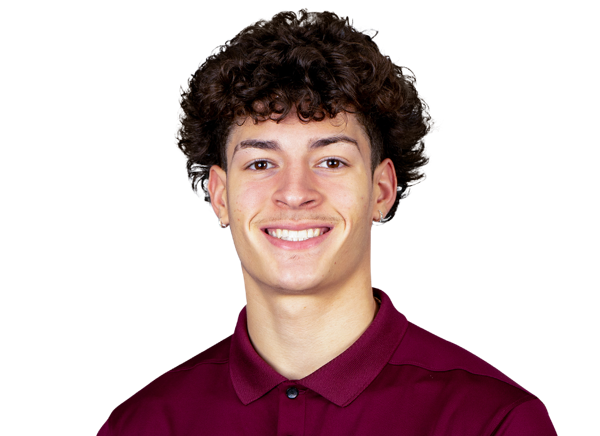 Ayden Greene | 1 | 44 | 44.0 | 0 | 44 |
 Que'Sean Brown#3 | 7 | 41 | 5.9 | 0 | 16 |
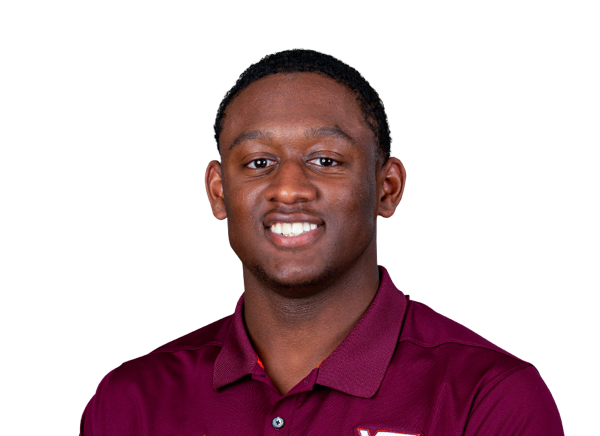 Ja'Ricous Hairston#13 | 2 | 35 | 17.5 | 0 | 30 |
| Jeffrey Overton Jr.#16 | 4 | 32 | 8.0 | 0 | 14 |
| Davion Brown#11 | 2 | 19 | 9.5 | 0 | 17 |
| Marcellous Hawkins Jr.#27 | 2 | 18 | 9.0 | 0 | 15 |
| Tyseer Denmark#4 | 2 | 17 | 8.5 | 0 | 17 |
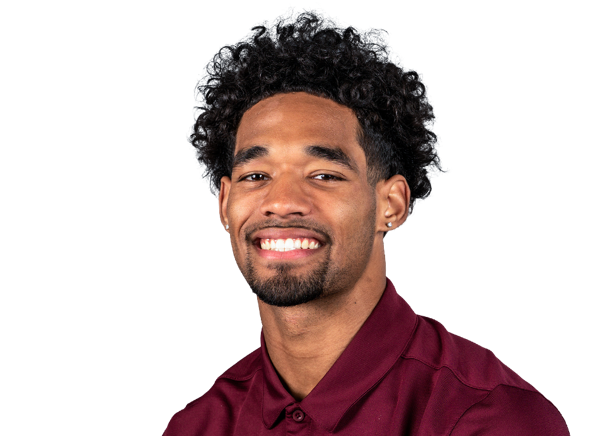 Marlion Jackson#5 | 1 | 6 | 6.0 | 0 | 6 |
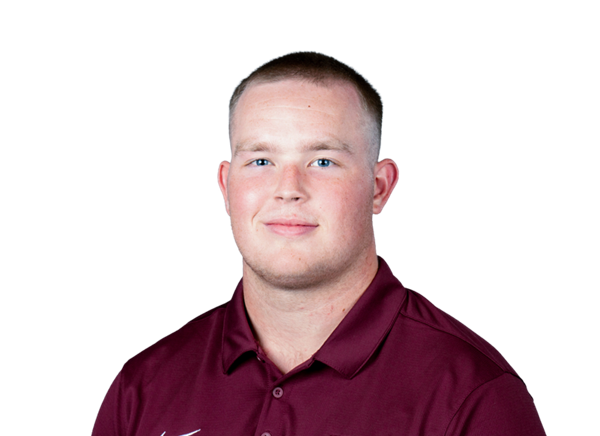 Harrison Saint Germain#87 | 2 | 5 | 2.5 | 0 | 5 |
 Benji Gosnell#82 | 1 | 2 | 2.0 | 0 | 2 |
Old Dominion| Player | TOT | SOLO | SACKS | TFL | PD | QB HUR | TD |
|---|---|---|---|---|---|---|---|
| Mario Thompson | 11 | 2 | 0 | 0.5 | 0 | 0 | 0 |
| Brandon Crutchfield#5 | 8 | 4 | 1 | 1.5 | 0 | 0 | 0 |
 Jackson Forrest#18 | 8 | 4 | 1 | 1.5 | 0 | 0 | 0 |
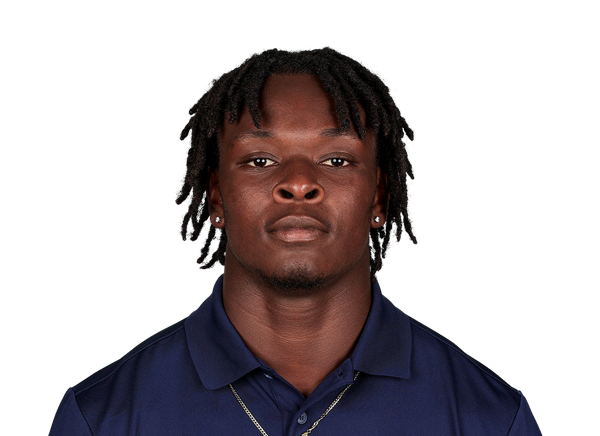 Daevon Iles#2 | 6 | 4 | 0 | 1 | 0 | 0 | 0 |
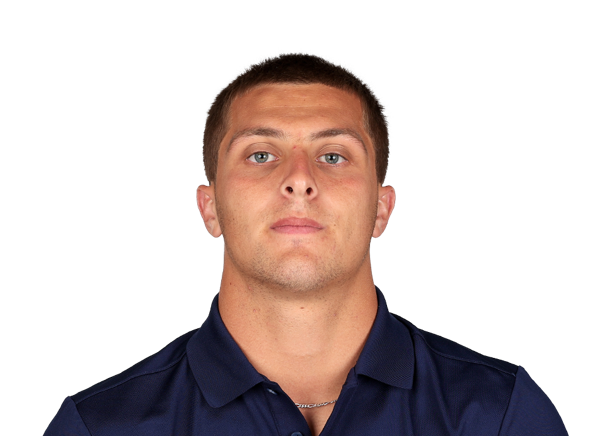 Lucas Struck#19 | 6 | 4 | 0 | 0.5 | 2 | 0 | 0 |
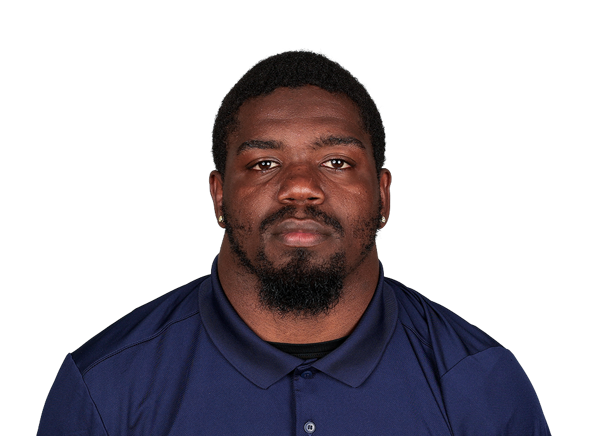 Ja'Mez Drummer#32 | 5 | 5 | 0 | 0 | 0 | 0 | 0 |
 Greg Johnson#8 | 5 | 2 | 0 | 0 | 0 | 0 | 0 |
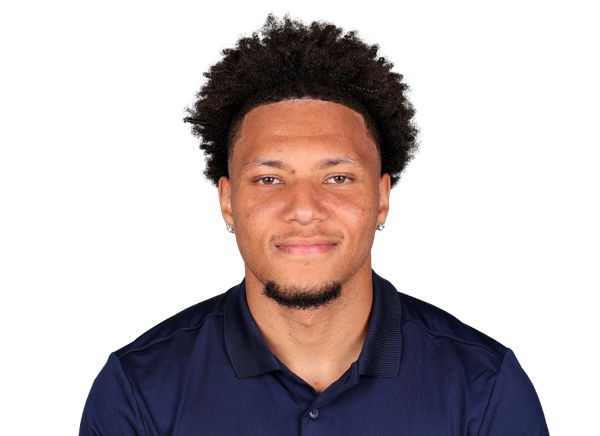 Kollin Collier#11 | 4 | 3 | 0 | 0 | 0 | 0 | 0 |
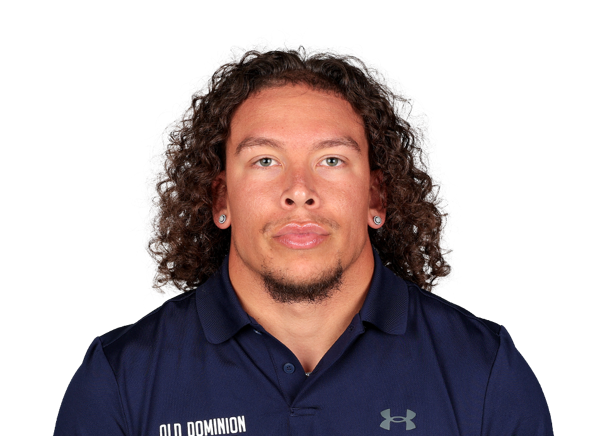 Mario Easterly#3 | 4 | 1 | 0 | 0 | 0 | 0 | 0 |
 Zion Frink#1 | 4 | 1 | 0 | 0 | 0 | 0 | 0 |
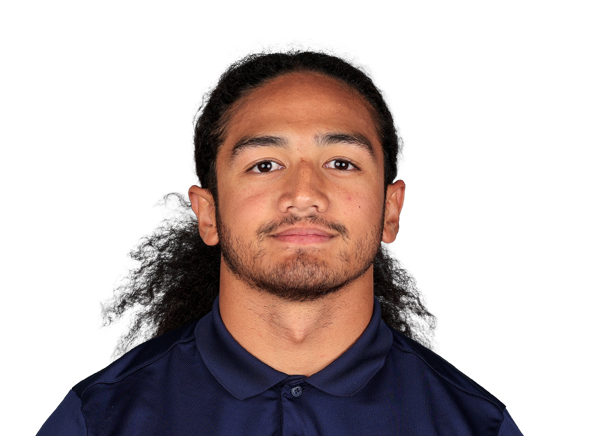 Koa Naotala#10 | 3 | 3 | 0 | 0 | 0 | 1 | 0 |
 DeVeion McLilley-Bulo#17 | 3 | 3 | 0 | 1 | 0 | 0 | 0 |
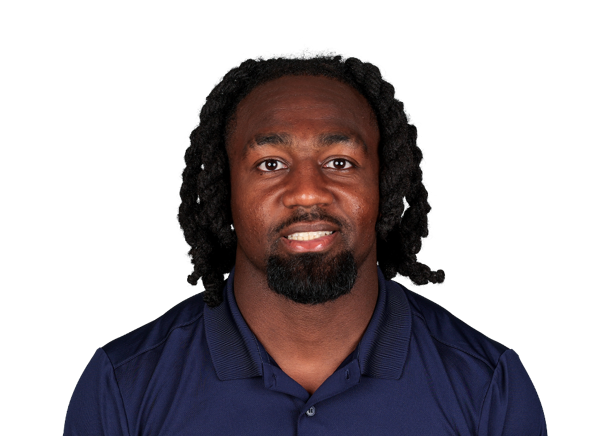 Montrell Chapman#6 | 3 | 2 | 0 | 0 | 0 | 0 | 0 |
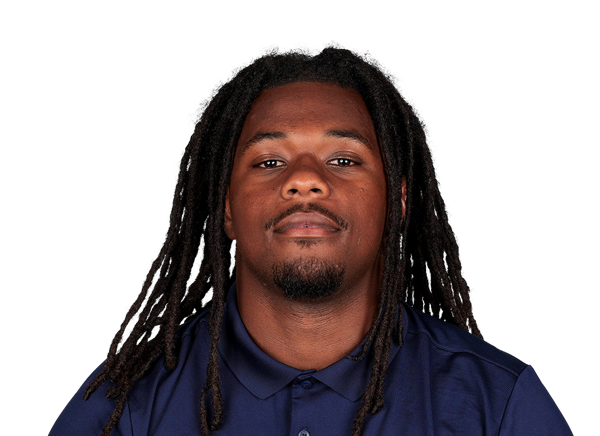 Javen Gibson#4 | 2 | 2 | 1 | 2 | 0 | 0 | 0 |
 Justin Watts#26 | 2 | 2 | 0 | 0 | 0 | 0 | 0 |
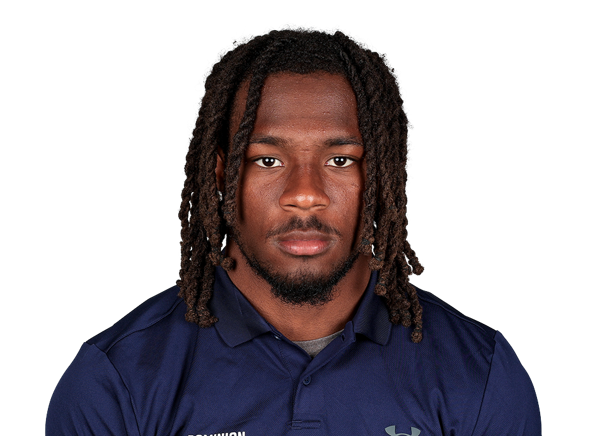 Asher Horn#12 | 2 | 2 | 0 | 0 | 0 | 0 | 0 |
 DeAndre Lynch#9 | 2 | 0 | 0 | 0 | 1 | 0 | 0 |
 Bucci Farmer#44 | 2 | 0 | 0 | 0 | 0 | 0 | 0 |
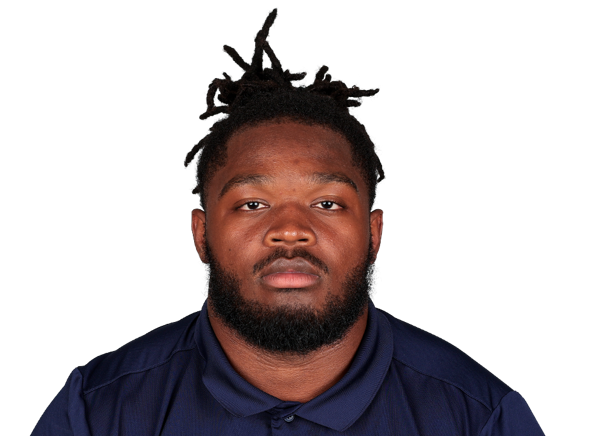 Chris Forbes#90 | 2 | 0 | 0 | 0.5 | 0 | 0 | 0 |
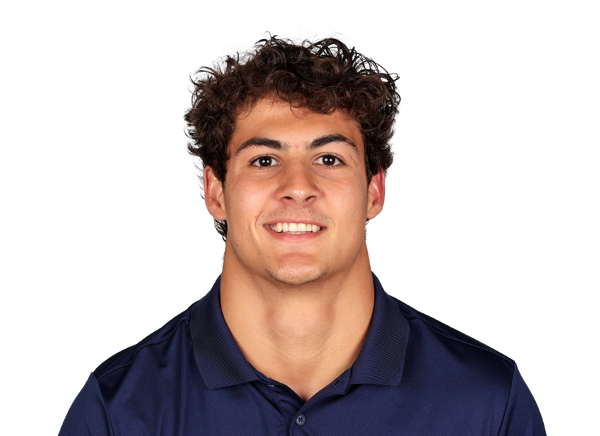 Talan Babin#42 | 2 | 0 | 0 | 0 | 0 | 0 | 0 |
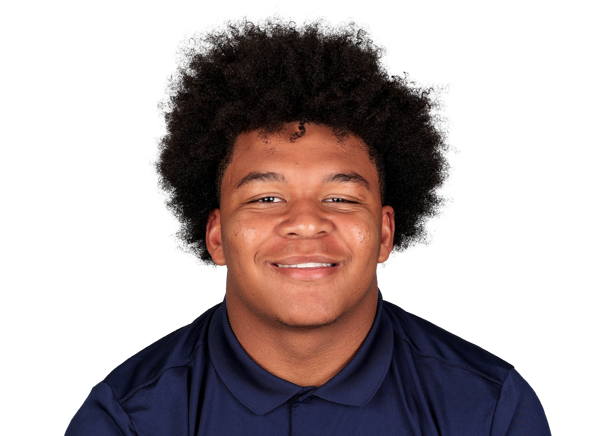 Malachi Harris#88 | 1 | 1 | 1 | 1 | 0 | 0 | 0 |
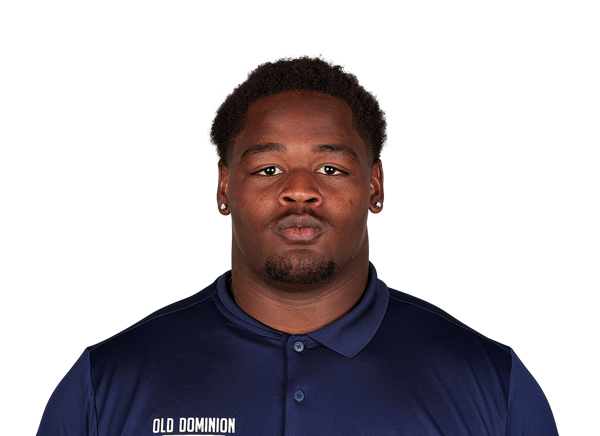 Lorenzo McFadden-Pressley#94 | 1 | 1 | 0 | 0 | 0 | 0 | 0 |
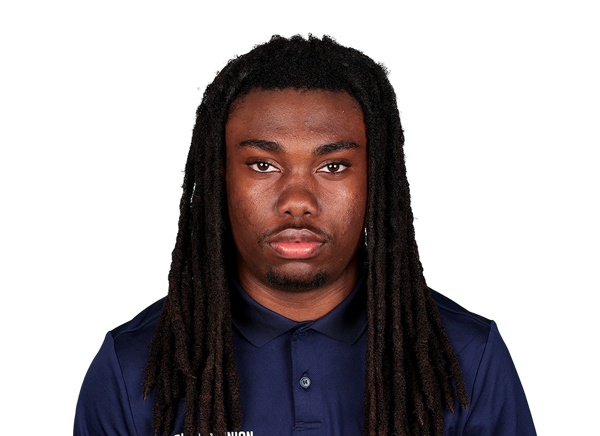 Tavares Murray Jr.#29 | 1 | 1 | 0 | 0 | 0 | 0 | 0 |
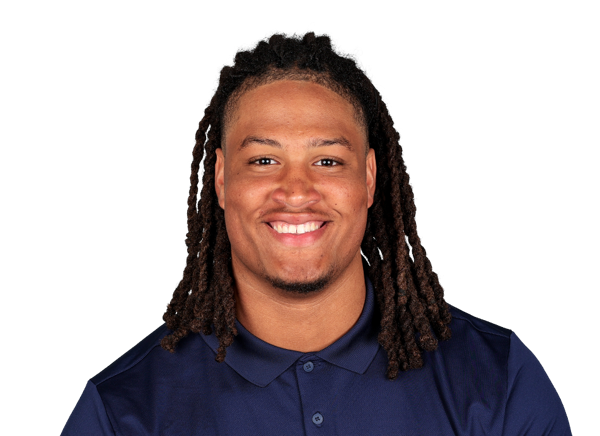 Ahmaad Foster#95 | 1 | 0 | 0 | 0.5 | 0 | 0 | 0 |
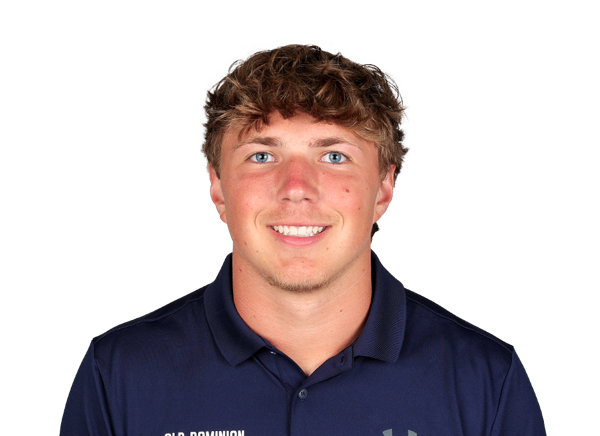 Hunter Malecki#40 | 1 | 0 | 0 | 0 | 0 | 0 | 0 |
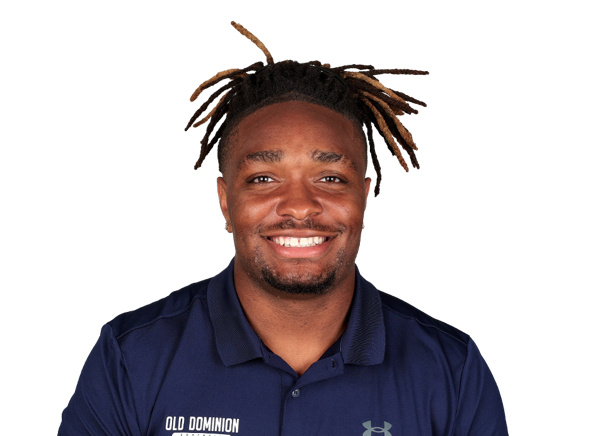 LeDarrion Menter#97 | 1 | 0 | 0 | 0 | 0 | 0 | 0 |
 BJ Campbell#31 | 1 | 0 | 0 | 0 | 0 | 1 | 0 |
Virginia Tech| Player | TOT | SOLO | SACKS | TFL | PD | QB HUR | TD |
|---|---|---|---|---|---|---|---|
| Mylachi Williams#37 | 4 | 3 | 2 | 3.5 | 0 | 0 | 0 |
| Kaleb Spencer#3 | 4 | 3 | 1 | 2 | 0 | 0 | 0 |
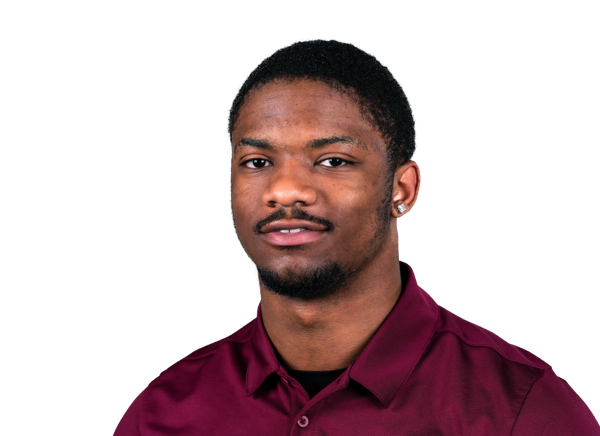 Cortez Harris#34 | 4 | 2 | 2 | 2 | 0 | 1 | 0 |
 Tyson Flowers#1 | 3 | 3 | 0 | 1 | 0 | 1 | 1 |
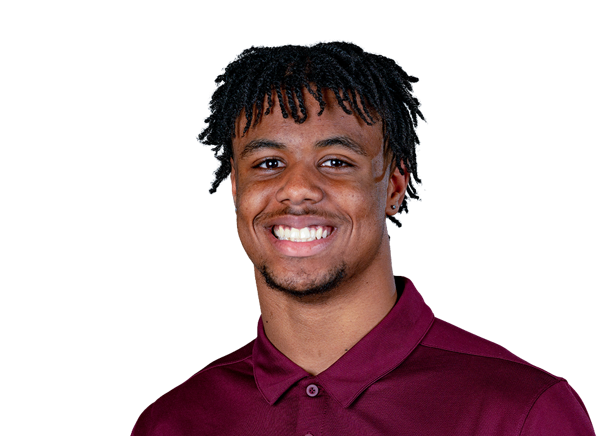 Quentin Reddish | 3 | 3 | 0 | 0 | 0 | 0 | 0 |
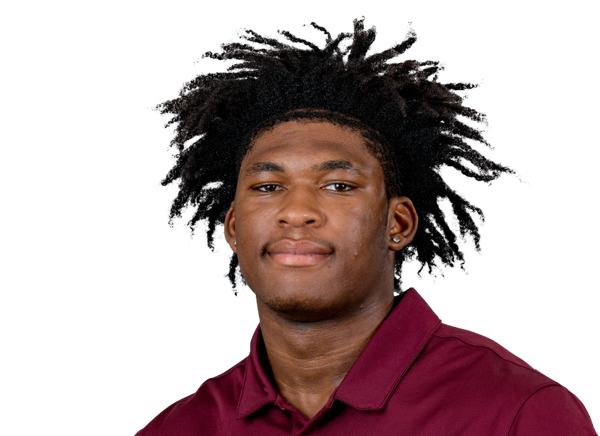 Noah Chambers#16 | 3 | 0 | 0.5 | 1 | 0 | 0 | 0 |
| Zaevion Cleveland#21 | 2 | 2 | 0 | 0 | 0 | 0 | 0 |
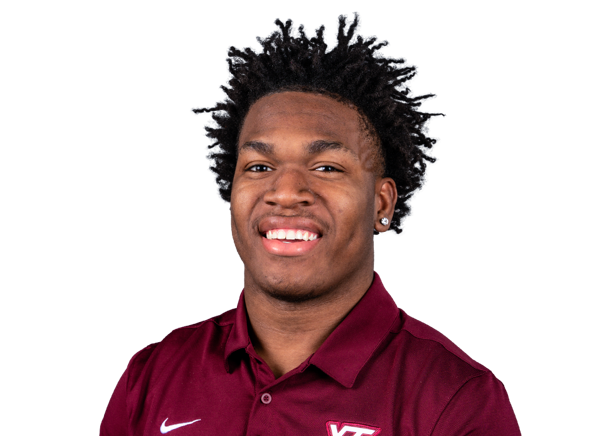 Jaquez White#2 | 2 | 2 | 0 | 0 | 0 | 0 | 0 |
 Aycen Stevens#42 | 2 | 1 | 1 | 1 | 0 | 1 | 0 |
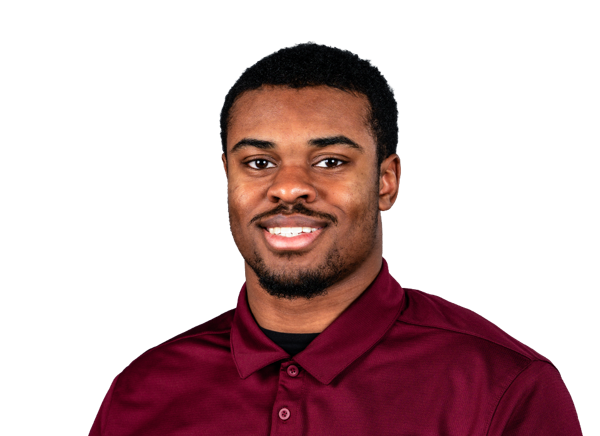 Curtis Jones Jr.#30 | 2 | 0 | 0 | 0 | 1 | 0 | 0 |
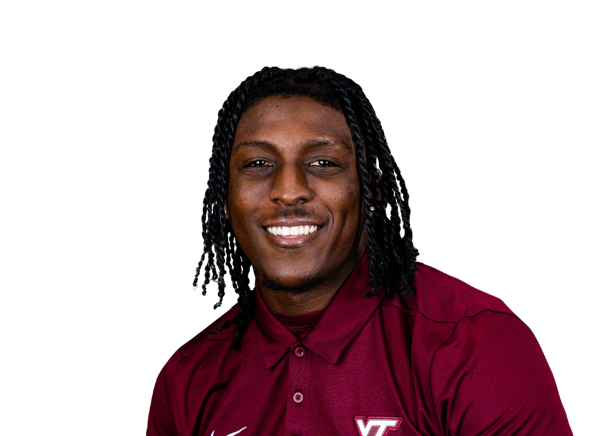 Isaiah Brown-Murray#9 | 1 | 1 | 0 | 0 | 0 | 0 | 0 |
 Samuel Okunlola#51 | 1 | 1 | 0 | 1 | 0 | 0 | 0 |
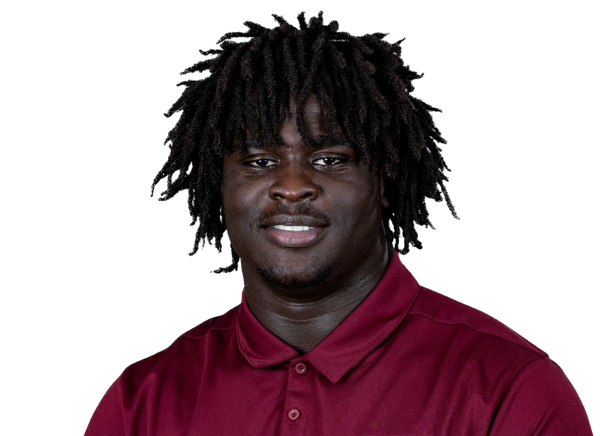 Elhadj Fall#94 | 1 | 1 | 0 | 1 | 0 | 0 | 0 |
 Kenny Woseley Jr.#22 | 1 | 1 | 0 | 0 | 0 | 0 | 0 |
 Eric Mensah#45 | 1 | 1 | 0 | 0 | 0 | 0 | 0 |
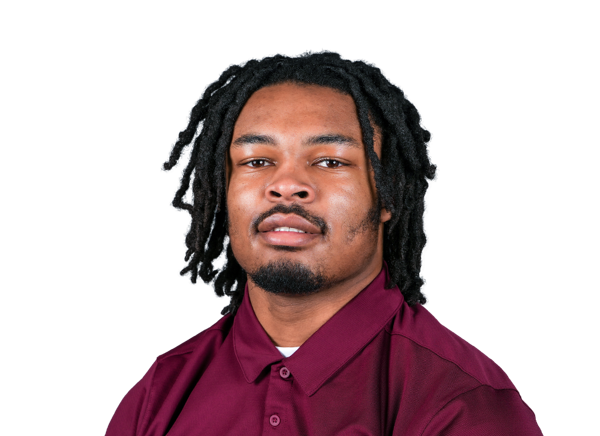 Keon Wylie#33 | 1 | 0 | 0.5 | 0.5 | 0 | 0 | 0 |
 Antwone Santiago#26 | 1 | 0 | 0 | 0 | 0 | 0 | 0 |
 Jason Abbey#31 | 1 | 0 | 0 | 0 | 0 | 0 | 0 |
 DQ Smith#11 | 1 | 0 | 0 | 0 | 0 | 0 | 0 |
 Kemari Copeland#13 | 1 | 0 | 0 | 0.5 | 0 | 0 | 0 |
 Brett Clatterbaugh#44 | 1 | 0 | 0 | 0 | 0 | 0 | 0 |
 Javion Hilson#40 | 1 | 0 | 0 | 0.5 | 0 | 0 | 0 |
| Tyler Mason#23 | 1 | 0 | 0 | 0 | 0 | 0 | 0 |
 Matt Henderson#44 | 1 | 0 | 0 | 0 | 0 | 0 | 0 |
 Christian Evans#88 | 1 | 0 | 0 | 0 | 0 | 0 | 0 |
 Sherrod Covil#7 | 0 | 0 | 0 | 0 | 0 | 1 | 0 |
Old Dominion| Player | FUM | LOST | REC |
|---|---|---|---|
| Quinn Henicle#10 | 3 | 2 | 0 |
| Team | 1 | 1 | 0 |
| TJ Johnson#11 | 0 | 0 | 1 |
| Chris Forbes#90 | 0 | 0 | 1 |
Virginia Tech| Player | FUM | LOST | REC |
|---|---|---|---|
| Keon Wylie#33 | 1 | 1 | 1 |
| Ethan Grunkemeyer#17 | 1 | 1 | 0 |
| Tyson Flowers#1 | 0 | 0 | 1 |
| Kaleb Spencer#3 | 0 | 0 | 1 |
Old Dominion| Player | FG | PCT | LONG | XP | PTS |
|---|---|---|---|---|---|
 Nathanial Eichner#93 | 2/2 | 100.0 | 51 | 1/1 | 7 |
Virginia Tech| Player | FG | PCT | LONG | XP | PTS |
|---|---|---|---|---|---|
 John Love#17 | 3/3 | 100.0 | 39 | 5/5 | 14 |
Old Dominion| Player | NO | YDS | AVG | TB | In 20 | LONG |
|---|---|---|---|---|---|---|
 Ian Brandt#96 | 6 | 271 | 45.2 | 1 | 1 | 54 |
Virginia Tech| Player | NO | YDS | AVG | TB | In 20 | LONG |
|---|---|---|---|---|---|---|
 Nathan Totten#95 | 2 | 96 | 48.0 | 0 | 2 | 58 |
Virginia Tech| Player | NO | YDS | AVG | LONG | TD |
|---|---|---|---|---|---|
| Tyler Mason#23 | 1 | 4 | 4.0 | 4 | 0 |
Virginia Tech| Player | NO | YDS | AVG | LONG | TD |
|---|---|---|---|---|---|
| Que'Sean Brown#3 | 1 | 79 | 79.0 | 79 | 0 |
| Tyseer Denmark#4 | 1 | -1 | -1.0 | 0 | 0 |
Drive Summary
VT
Field Goal
54
ODU
Punt
8
VT
Touchdown
77
ODU
Fumble
-22
ODU
Fumble Touchdown
-20
ODU
Field Goal
59
VT
Touchdown
75
ODU
Fumble
-5
VT
Touchdown
20
ODU
Punt
1
VT
Field Goal
-3
ODU
Punt
11
VT
End Of Half
16
ODU
Field Goal
0
ODU
Punt
30
VT
Field Goal
73
ODU
Touchdown
75
VT
Touchdown
84
ODU
Punt
-47
VT
Punt
2
ODU
Touchdown
84
VT
Punt
13
ODU
Punt
18
VT
End Of Quarter
5
Injury Report
No current injury report is available for this matchup.
Head-to-Head
Historical meetings are not available for this matchup.
Game Information
StageWeek 2
Season2026
KickoffSat, Sep 12, 12:00 pm
VenueLane Stadium
LocationBlacksburg, VA
SurfaceGrass
BroadcastCW
Division Standings
FBS — Atlantic Coast Conference
| Team | W | L | T | Pct | PF | PA | Home | Away | Strk |
|---|---|---|---|---|---|---|---|---|---|
 Miami | 9 | 1 | 0 | 0.900 | 441 | 198 | 5-0 | 4-1 | W1 |
 Virginia | 5 | 5 | 0 | 0.500 | 269 | 215 | 5-2 | 0-3 | W1 |
 SMU | 7 | 3 | 0 | 0.700 | 340 | 255 | 6-1 | 1-2 | L1 |
| Virginia Tech | 6 | 4 | 0 | 0.600 | 330 | 255 | 3-2 | 3-2 | L2 |
 Wake Forest | 9 | 1 | 0 | 0.900 | 439 | 150 | 4-1 | 5-0 | W7 |
 Duke | 7 | 3 | 0 | 0.700 | 322 | 153 | 4-1 | 3-2 | L1 |
 North Carolina | 5 | 5 | 0 | 0.500 | 258 | 221 | 1-4 | 4-1 | L1 |
 Pittsburgh | 6 | 4 | 0 | 0.600 | 297 | 194 | 5-2 | 1-2 | L1 |
 Syracuse | 5 | 5 | 0 | 0.500 | 298 | 260 | 2-3 | 3-2 | W1 |
 Boston College | 4 | 6 | 0 | 0.400 | 204 | 284 | 3-2 | 1-4 | L3 |
 Louisville | 7 | 3 | 0 | 0.700 | 383 | 247 | 4-1 | 3-2 | W5 |
 California | 3 | 7 | 0 | 0.300 | 204 | 320 | 2-3 | 1-4 | L4 |
 Clemson | 6 | 4 | 0 | 0.600 | 210 | 206 | 3-3 | 3-1 | L1 |
 Georgia Tech | 3 | 7 | 0 | 0.300 | 235 | 296 | 2-4 | 1-3 | W1 |
 Florida State | 5 | 5 | 0 | 0.500 | 292 | 265 | 3-2 | 2-3 | W2 |
 NC State | 4 | 6 | 0 | 0.400 | 291 | 282 | 4-3 | 0-3 | L2 |
 Stanford | 5 | 5 | 0 | 0.500 | 223 | 358 | 4-1 | 1-4 | W1 |
Old Dominion
14th in Sun Belt
VS
Virginia Tech
10th in ACC
Quarterbacks & Specialists
#96
Ian Brandt
#10
Quinn Henicle
Receivers & Backs
#6
Trey Hall
#1
JJ Harrell
#7
Kendall Harris
#86
Leon Haughton Jr.
#13
Lonnie Johnson
#11
TJ Johnson
#3
Devin Roche
#8
Josh Rodriguez
#26
Ja'Varien Salter
Defensive Line & Linebackers
#42
Talan Babin
#31
BJ Campbell
#6
Montrell Chapman
#32
Ja'Mez Drummer
#44
Bucci Farmer
#90
Chris Forbes
#18
Jackson Forrest
#95
Ahmaad Foster
#4
Javen Gibson
#88
Malachi Harris
#9
DeAndre Lynch
#40
Hunter Malecki
#94
Lorenzo McFadden-Pressley
#17
DeVeion McLilley-Bulo
#97
LeDarrion Menter
#10
Koa Naotala
Mario Thompson
Defensive Backs
#11
Kollin Collier
#5
Brandon Crutchfield
#3
Mario Easterly
#1
Zion Frink
#12
Asher Horn
#2
Daevon Iles
#8
Greg Johnson
#29
Tavares Murray Jr.
#19
Lucas Struck
#26
Justin Watts
Other
#93
Nathanial Eichner
Quarterbacks & Specialists
#22
Bryce Baker
#17
Ethan Grunkemeyer
#95
Nathan Totten
Receivers & Backs
#11
Davion Brown
#3
Que'Sean Brown
#4
Tyseer Denmark
#82
Benji Gosnell
Ayden Greene
#13
Ja'Ricous Hairston
#27
Marcellous Hawkins Jr.
#44
Matt Henderson
#5
Marlion Jackson
#23
Tyler Mason
#26
Messiah Mickens
#16
Jeffrey Overton Jr.
#85
Luke Reynolds
#87
Harrison Saint Germain
Defensive Line & Linebackers
#31
Jason Abbey
#16
Noah Chambers
#44
Brett Clatterbaugh
#13
Kemari Copeland
#88
Christian Evans
#94
Elhadj Fall
#34
Cortez Harris
#40
Javion Hilson
#30
Curtis Jones Jr.
#45
Eric Mensah
#51
Samuel Okunlola
#26
Antwone Santiago
#3
Kaleb Spencer
#42
Aycen Stevens
#37
Mylachi Williams
#33
Keon Wylie
Defensive Backs
#9
Isaiah Brown-Murray
#21
Zaevion Cleveland
#7
Sherrod Covil
#1
Tyson Flowers
Quentin Reddish
#11
DQ Smith
#2
Jaquez White
#22
Kenny Woseley Jr.
Other
#17
John Love
Old Dominion
7th in Sun Belt - East
VS
Virginia Tech
7th in ACC
Passing
53.8
Completion Percentage
69.9
150
Completions
244
3.60
Interception Percentage
1.40
10
Interceptions
5
71
Longest Pass
69
1,746
Net Passing Yards
2,836
174.6
Net Passing Yards Per Game
283.6
279
Passing Attempts
349
2.50
Passing Touchdown %
6.00
7
Passing Touchdowns
21
107.8
Passer Rating
155.0
44
Total Sacks
33
264
Sack Yards Lost
217
6.3
Yards Per Pass Attempt
8.1
1,746
Passing Yards
2,836
0
Passing Fumbles Lost
0
10
Team Games Played
10
268.2
Yards Per Game
420.8
16.8
Total Points Per Game
33.0
168
Total Points
330
20
Total Touchdowns
42
174.6
Passing Yards Per Game
283.6
150-279
Comp-Att
244-349
44-264
Sacks-Yards Lost
33-217
Rushing
358
Rushing Attempts
368
936
Rushing Yards
1,372
2.6
Yards Per Rush Attempt
3.7
76
Long Rushing
76
0
20+ Yard Rushing Plays
0
9
Rushing Touchdowns
19
93.6
Rushing Yards Per Game
137.2
0
Rushing Fumbles
0
0
Rushing Fumbles Lost
0
53
Rushing 1st downs
90
10
Team Games Played
10
2,682
Total Yards
4,208
681
Total Offensive Plays
750
16.8
Total Points Per Game
33.0
168
Total Points
330
20
Total Touchdowns
42
Receiving
150
Receptions
244
0
Receiving Targets
0
1,746
Receiving Yards
2,836
1,746
Receiving Yards
2,836
7
Receiving Touchdowns
21
71
Long Reception
69
0
20+ Yard Receiving Plays
0
174.6
Receiving Yards Per Game
283.6
0
Receiving Fumbles
0
0
Receiving Fumbles Lost
0
649
Receiving Yards After Catch
1741
76
Receiving First Downs
113
10
Team Games Played
10
11.6
Yards Per Reception
11.6
16.8
Total Points Per Game
33.0
168
Total Points
330
20
Total Touchdowns
42
Miscellaneous
148
Total 1st downs
229
53
Rushing 1st downs
90
76
Passing 1st downs
113
19
1st downs by penalty
26
50
Third Down Conversions
60
142
Third Down Attempts
144
35.21
3rd down %
41.67
3
Fourth Down Conversions
15
14
First Downs Attempts
22
21.43
4th down %
68.18
75
Total Penalties
63
648
Total Penalty Yards
565
16072
Possession Time Seconds
18669
0.00
Red Zone Field Goal Percentage
0.00
0.00
Red Zone Scoring Percentage
0.00
0.00
Red Zone Efficiency Percentage
0.00
0.00
Red Zone Touchdown Percentage
0.00
22
Total Takeaways
9
21
Total Giveaways
15
1
Turnover Ratio
-6
0
Fumbles Lost
0
50-142
3rd down efficiency
60-144
3-14
4th down efficiency
15-22
75-648
Total-Yards
63-565
Defense
298
Solo Tackles
313
504
Assist Tackles
284
802
Total Tackles
597
25
Sacks
28
187
Sack Yards
174
99
Stuffs
108
23
Passes Defended
37
8.3
Average Interception Yards
7.3
44
Long Interception
22
0
Miscellaneous Touchdowns
0
0
Kicks Blocked
2
50
Tackles For Loss
65
10
Team Games Played
10
Defensive Interceptions
10
Interceptions
3
83
Interception Yards
22
1
Interception Touchdowns
0
10-83
INT: Total
3-22
General
19
Fumbles
14
8
Forced Fumbles
11
12
Fumbles Recovered
4
2
Fumbles Touchdowns
1
10
Games Played
10
19-0
Fumbles-Lost
14-0
Returning
21
Kick Returns
13
417
Kick Return Yards
308
19.9
Yards Per Kick Return
23.7
36
Long Kick Return
62
0
Kick Return Touchdowns
0
16
Punt Returns
18
191
Punt Return Yards
363
11.9
Yards Per Punt Return
20.2
78
Long Punt Return
79
1
Punt Return Touchdowns
1
0
Punt Return Fair Catches
0
0
Kick Return Fumbles Lost
0
0
Punt Return Fumbles Lost
0
10
Team Games Played
10
16-191
Punt: Total
18-363
Kicking
8
Field Goal Made
11
13
Field Goal Attempts
14
61.5
Field Goal Percentage
78.6
51
Long Field Goal Made
47
0
Field Goal Attempts 1-19
0
2
Field Goal Attempts 20-29
5
5
Field Goal Attempts 30-39
6
4
Field Goal Attempts 40-49
2
2
Field Goal Attempts 50+
1
16
Extra Points Made
35
16
Extra Point Attempts
36
100.0
Extra Point Percentage
97.2
0
Field Goals Made 1-19
0
2
Field Goals Made 20-29
5
4
Field Goals Made 30-39
4
1
Field Goals Made 40-49
2
1
Field Goals Made 50+
0
40
Total Kicking Points
68
10
Team Games Played
10
65
Touchback Percentage
80
0.0
Average Kickoff Return Yards
0.0
0
Kickoff Return Yards
0
0
Kickoff Returns
0
0-0
Kickoffs: Total
0-0
8-13
FG: Good-Attempts
11-14
Punting
60
Punts
35
2,478
Punt Yards
1,490
67
Long Punt
60
41.3
Gross Average Punt Yards
42.6
41.3
Net Average Punt Yards
42.6
0
Punts Blocked
0
13
Punts Inside 20
14
5
Touchbacks
2
19
Fair Catches
9
12
Punt Returns
12
0
Punt Return Yards
0
0.0
Average Punt Return Yards
0.0
10
Team Games Played
10
60-2,478
Punt: Total Yards
35-1,490
Scoring
9
Rushing Touchdowns
19
7
Receiving Touchdowns
21
1
Return Touchdowns
1
19
Total Touchdowns
42
8
Field Goals
11
16
Kick Extra Points
35
3
Total Two Point Conversions
4
168
Total Points
330
16.8
Total Points Per Game
33.0