

Ole Miss vs Georgia Live Score (2 Jan, 2026)
Score by Quarter
| Team | Q1 | Q2 | Q3 | Q4 | Final |
|---|---|---|---|---|---|
 Ole Miss |
6 | 6 | 7 | 20 | 39 |
 Georgia |
0 | 21 | 3 | 10 | 34 |
Scoring Plays
Q1
5:47
5:47
Lucas Carneiro 55 Yd Field Goal
Field Goal Good
3 – 0
Q1
2:13
2:13
Lucas Carneiro 56 Yd Field Goal
Field Goal Good
6 – 0
Q2
13:37
13:37
Gunner Stockton 12 Yd Run (Peyton Woodring Kick)
Rushing Touchdown
6 – 7
Q2
10:33
10:33
Luke Hasz 3 Yd pass from Trinidad Chambliss (Two-Point Run Conversion Failed)
Passing Touchdown
12 – 7
Q2
4:05
4:05
Gunner Stockton 1 Yd Run (Peyton Woodring Kick)
Rushing Touchdown
12 – 14
Q2
2:34
2:34
Daylen Everette 47 Yd Fumble Return (Peyton Woodring Kick)
Fumble Recovery (Opponent)
12 – 21
Q3
4:51
4:51
Kewan Lacy 7 Yd Run (Lucas Carneiro Kick)
Rushing Touchdown
19 – 21
Q3
0:30
0:30
Peyton Woodring 37 Yd Field Goal
Field Goal Good
19 – 24
Q4
11:29
11:29
Kewan Lacy 5 Yd Run (Trinidad Chambliss Pass to Harrison Wallace III for Two-Point Conversion)
Rushing Touchdown
27 – 24
Q4
9:02
9:02
Harrison Wallace III 13 Yd pass from Trinidad Chambliss (Lucas Carneiro Kick)
Passing Touchdown
34 – 24
Q4
7:03
7:03
Zachariah Branch 18 Yd pass from Gunner Stockton (Peyton Woodring Kick)
Passing Touchdown
34 – 31
Q4
0:56
0:56
Peyton Woodring 24 Yd Field Goal
Field Goal Good
34 – 34
Q4
0:06
0:06
Lucas Carneiro 47 Yd Field Goal
Field Goal Good
37 – 34
Q4
0:01
0:01
Team Safety
Safety
39 – 34
Game Leaders
Ole MissGeorgia
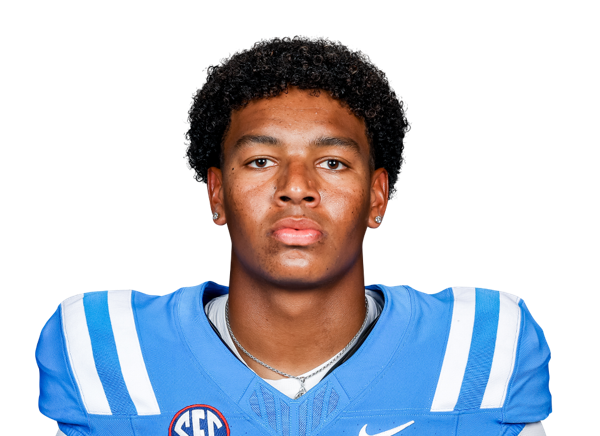 T. Chambliss QB
Passing Yards
 G. Stockton QB
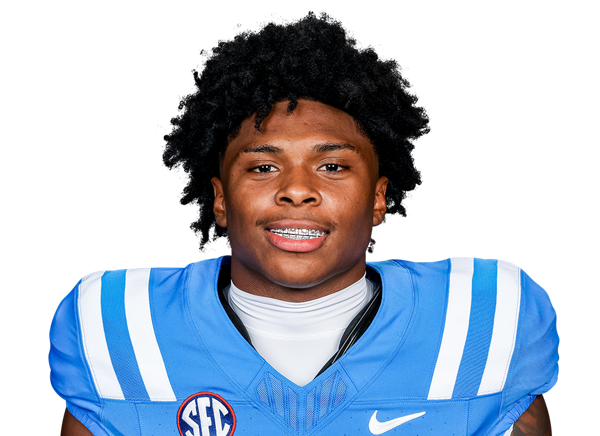 K. Lacy RB
Rushing Yards
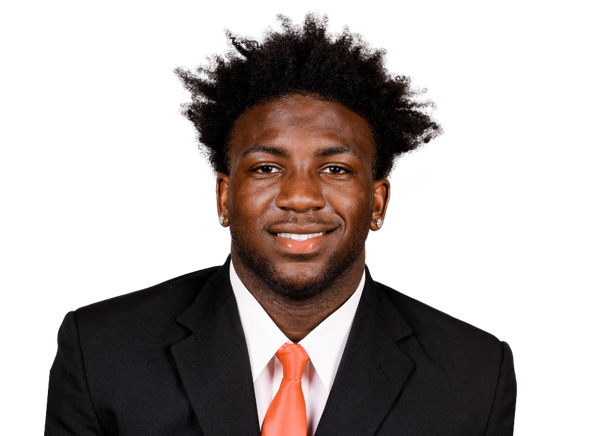 N. Frazier RB
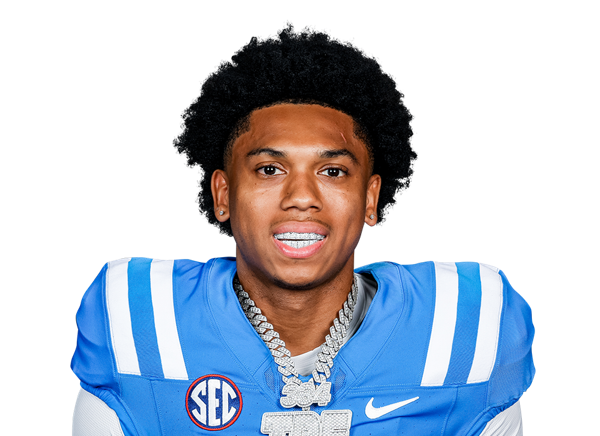 H. Wallace III WR
Receiving Yards
 Z. Branch WR
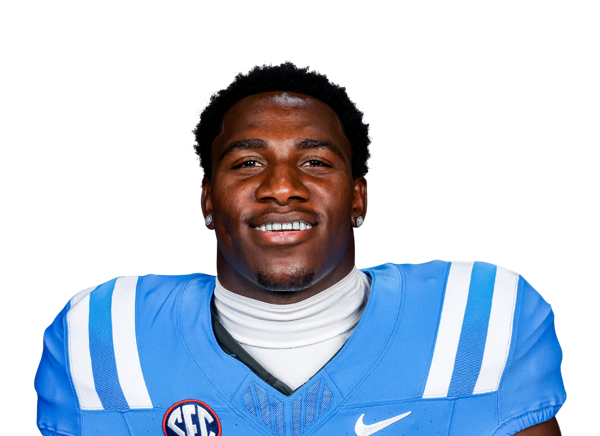 S. Perkins LB
Sacks
—
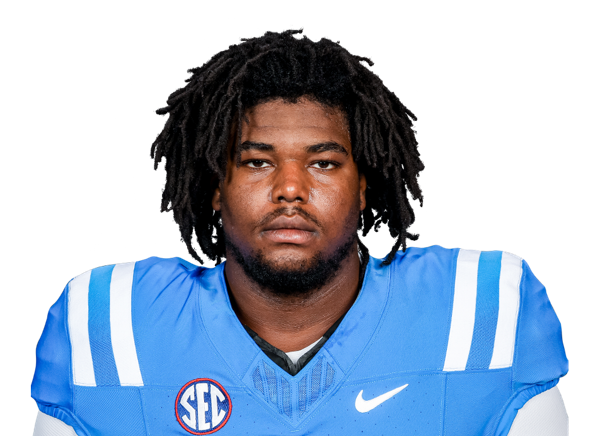 Z. Harris DT
Tackles
 K. Bolden DB
Player Box Score
Ole Miss| Player | C/ATT | YDS | AVG | TD | INT | QBR |
|---|---|---|---|---|---|---|
| Trinidad Chambliss#6 | 30/46 | 362 | 7.9 | 2 | 0 | 90.5 |
Georgia| Player | C/ATT | YDS | AVG | TD | INT | QBR |
|---|---|---|---|---|---|---|
| Gunner Stockton#14 | 18/31 | 203 | 6.5 | 1 | 0 | 75.1 |
 Landon Roldan#84 | 1/1 | 16 | 16.0 | 0 | 0 | 100.0 |
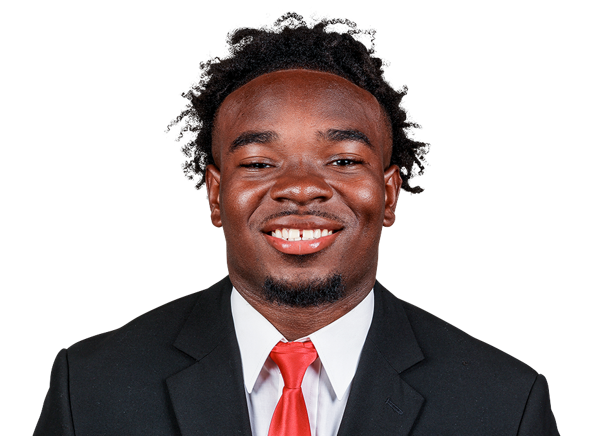 Dillon Bell#86 | 0/1 | 0 | 0.0 | 0 | 0 | 3.1 |
Ole Miss| Player | CAR | YDS | AVG | TD | LONG |
|---|---|---|---|---|---|
| Kewan Lacy#5 | 22 | 98 | 4.5 | 2 | 16 |
| Trinidad Chambliss#6 | 4 | 14 | 3.5 | 0 | 5 |
 Deuce Alexander#11 | 1 | -1 | -1.0 | 0 | 0 |
Georgia| Player | CAR | YDS | AVG | TD | LONG |
|---|---|---|---|---|---|
| Nate Frazier#3 | 15 | 86 | 5.7 | 0 | 16 |
| Gunner Stockton#14 | 13 | 20 | 1.5 | 2 | 12 |
 Cash Jones#32 | 2 | 11 | 5.5 | 0 | 8 |
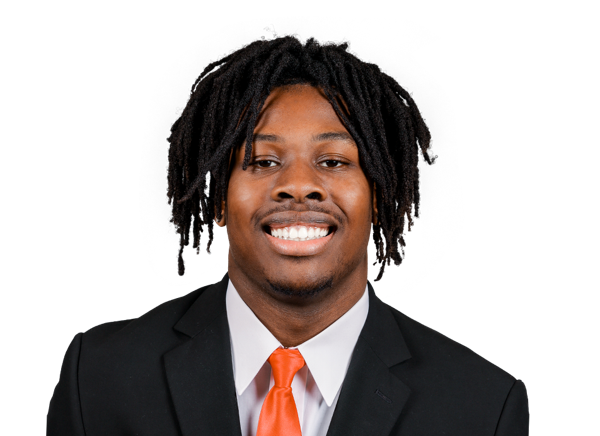 Chauncey Bowens#33 | 5 | 10 | 2.0 | 0 | 6 |
 Josh McCray#2 | 2 | -3 | -1.5 | 0 | 0 |
Ole Miss| Player | REC | YDS | AVG | TD | LONG |
|---|---|---|---|---|---|
| Harrison Wallace III#2 | 9 | 156 | 17.3 | 1 | 44 |
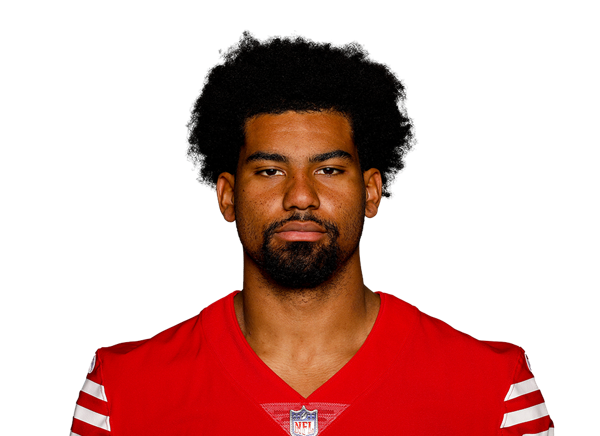 De'Zhaun Stribling#1 | 7 | 122 | 17.4 | 0 | 40 |
 Cayden Lee#19 | 4 | 19 | 4.8 | 0 | 12 |
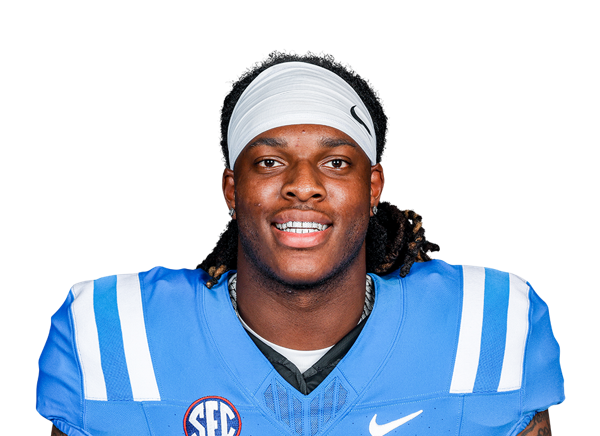 Dae'Quan Wright#8 | 2 | 18 | 9.0 | 0 | 10 |
| Deuce Alexander#11 | 2 | 13 | 6.5 | 0 | 7 |
| Kewan Lacy#5 | 2 | 12 | 6.0 | 0 | 8 |
 Logan Diggs#22 | 1 | 8 | 8.0 | 0 | 8 |
 Winston Watkins Jr.#17 | 1 | 7 | 7.0 | 0 | 7 |
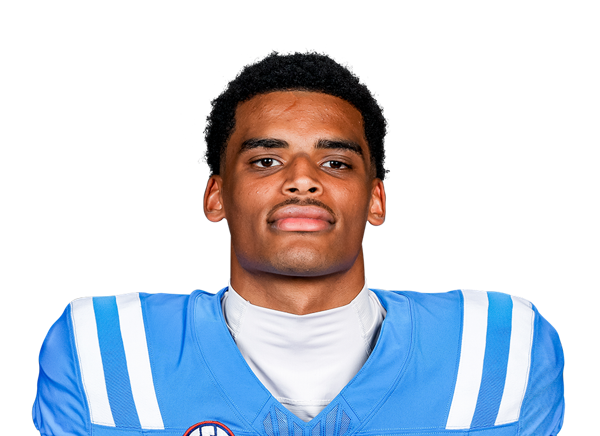 Caleb Odom#4 | 1 | 4 | 4.0 | 0 | 4 |
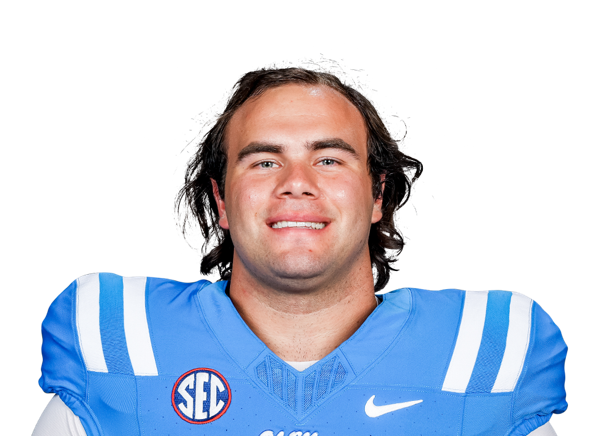 Luke Hasz#9 | 1 | 3 | 3.0 | 1 | 3 |
Georgia| Player | REC | YDS | AVG | TD | LONG |
|---|---|---|---|---|---|
| Zachariah Branch#1 | 8 | 67 | 8.4 | 1 | 18 |
| Cash Jones#32 | 2 | 45 | 22.5 | 0 | 26 |
| Nate Frazier#3 | 3 | 42 | 14.0 | 0 | 24 |
 Colbie Young#8 | 3 | 22 | 7.3 | 0 | 31 |
 Lawson Luckie#7 | 1 | 20 | 20.0 | 0 | 16 |
 Sacovie White-Helton#18 | 1 | 20 | 20.0 | 0 | 20 |
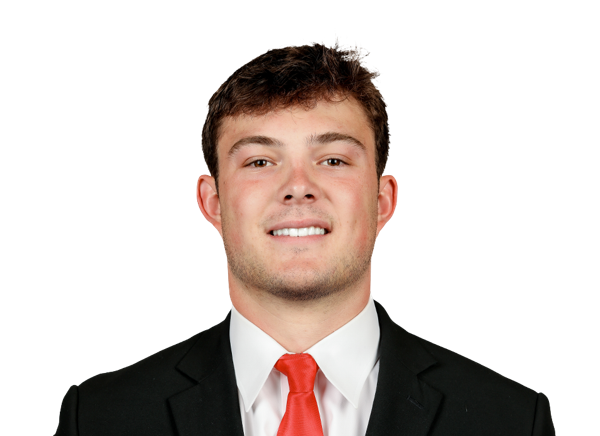 Oscar Delp#4 | 1 | 16 | 16.0 | 0 | 16 |
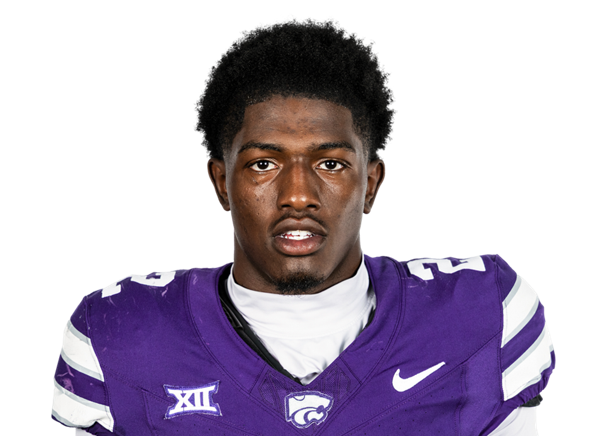 Adrian Maddox#14 | 0 | -2 | 0.0 | 0 | -2 |
| Dillon Bell#86 | 0 | -11 | 0.0 | 0 | 0 |
Ole Miss| Player | TOT | SOLO | SACKS | TFL | PD | QB HUR | TD |
|---|---|---|---|---|---|---|---|
| Zxavian Harris#51 | 10 | 5 | 0 | 1 | 1 | 0 | 0 |
 Princewill Umanmielen#1 | 7 | 3 | 0 | 0.5 | 0 | 0 | 0 |
| Suntarine Perkins#4 | 6 | 3 | 1 | 2 | 1 | 0 | 0 |
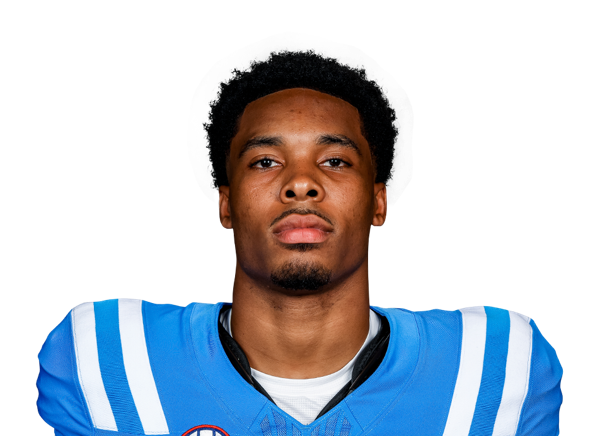 Wydett Williams Jr.#16 | 6 | 3 | 0 | 0 | 0 | 0 | 0 |
 Tahj Chambers#26 | 5 | 3 | 0 | 0 | 1 | 0 | 0 |
 Will Echoles#52 | 5 | 3 | 0 | 2 | 2 | 0 | 0 |
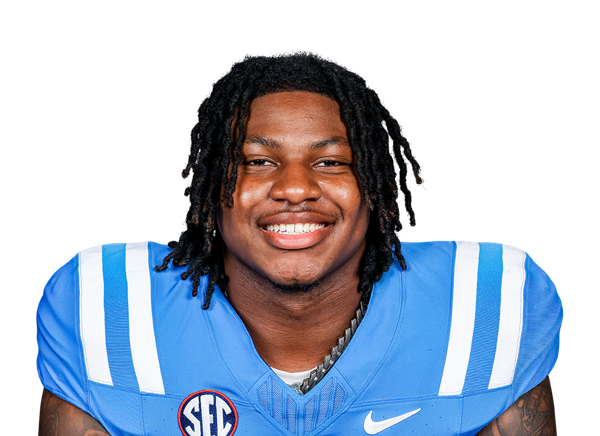 Kam Franklin#5 | 5 | 1 | 1 | 1 | 0 | 0 | 0 |
 Jaylon Braxton#2 | 4 | 3 | 0 | 0 | 0 | 0 | 0 |
 Andrew Jones#44 | 4 | 2 | 0 | 0.5 | 0 | 0 | 0 |
 TJ Dottery#6 | 4 | 1 | 0 | 0 | 0 | 0 | 0 |
 Antonio Kite#8 | 2 | 1 | 0 | 0 | 1 | 0 | 0 |
 Chris Graves Jr.#32 | 2 | 1 | 0 | 0.5 | 0 | 0 | 0 |
 Nick Cull#29 | 2 | 1 | 0 | 0.5 | 0 | 0 | 0 |
 Da'Shawn Womack#15 | 2 | 1 | 0 | 0.5 | 0 | 0 | 0 |
 T.J. Banks#7 | 2 | 1 | 0 | 0.5 | 0 | 0 | 0 |
 Kapena Gushiken#14 | 2 | 1 | 0 | 0 | 0 | 0 | 0 |
 Ladarian Clardy#31 | 2 | 1 | 0 | 0 | 0 | 0 | 0 |
 Team | 1 | 1 | 0 | 0 | 0 | 0 | 0 |
 Carter Short#93 | 1 | 1 | 0 | 0 | 0 | 0 | 0 |
 Jamarious Brown#96 | 1 | 0 | 0 | 0 | 0 | 0 | 0 |
 Jaden Yates#30 | 1 | 0 | 0 | 0 | 0 | 0 | 0 |
Georgia| Player | TOT | SOLO | SACKS | TFL | PD | QB HUR | TD |
|---|---|---|---|---|---|---|---|
| KJ Bolden#4 | 10 | 6 | 0 | 0 | 1 | 0 | 0 |
 Daylen Everette#6 | 9 | 6 | 0 | 0 | 2 | 0 | 1 |
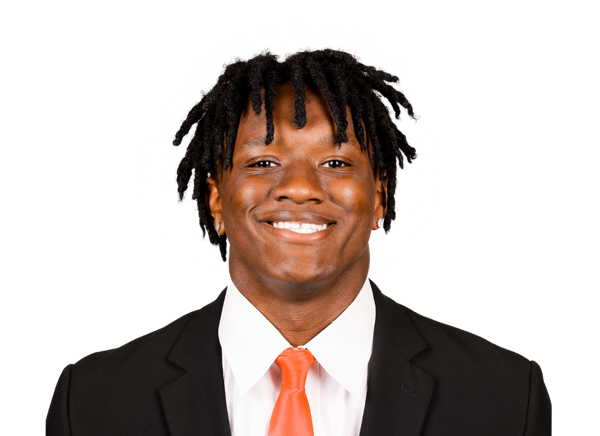 Chris Cole#9 | 7 | 4 | 0 | 0 | 0 | 0 | 0 |
 Zion Branch#2 | 5 | 3 | 0 | 0 | 1 | 0 | 0 |
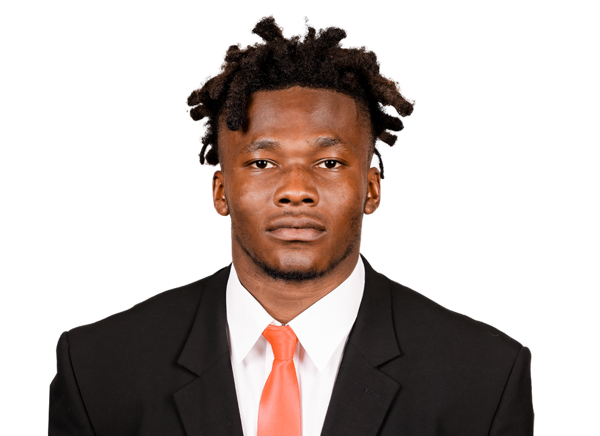 Raylen Wilson#5 | 4 | 2 | 0 | 1 | 0 | 0 | 0 |
 Elijah Griffin#90 | 4 | 2 | 0 | 0 | 0 | 0 | 0 |
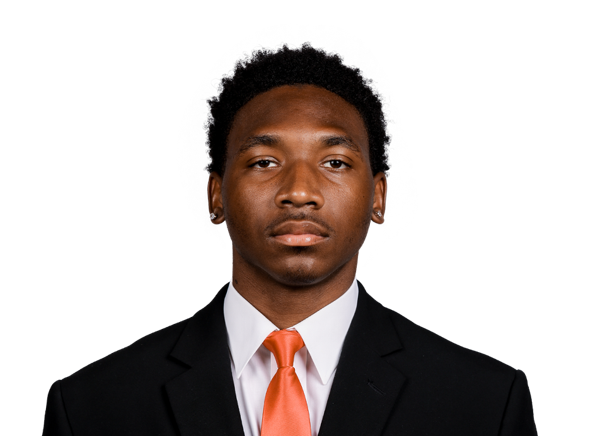 Rasean Dinkins#27 | 4 | 2 | 0 | 1 | 0 | 0 | 0 |
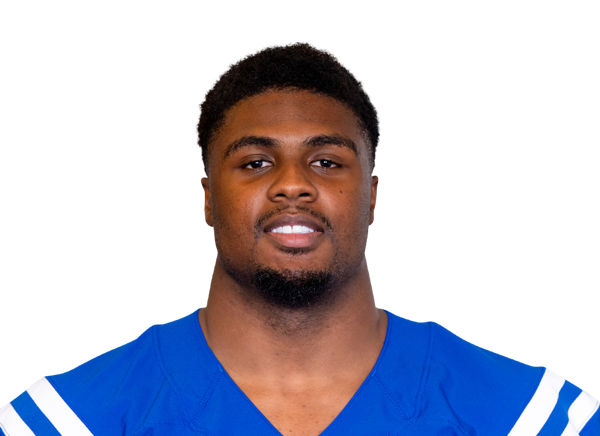 CJ Allen#3 | 3 | 2 | 0 | 0 | 0 | 0 | 0 |
 Ellis Robinson IV#1 | 3 | 2 | 0 | 0 | 0 | 0 | 0 |
 Elo Modozie#18 | 3 | 2 | 0 | 0 | 0 | 0 | 0 |
 Christen Miller#52 | 3 | 1 | 0 | 1 | 0 | 0 | 0 |
 JaCorey Thomas#20 | 3 | 0 | 0 | 0 | 0 | 0 | 0 |
 Josh Horton#81 | 2 | 1 | 0 | 0 | 0 | 0 | 0 |
 Joseph Jonah-Ajonye#99 | 2 | 1 | 0 | 0 | 1 | 0 | 0 |
 Xzavier McLeod#94 | 2 | 0 | 0 | 0 | 0 | 0 | 0 |
| Adrian Maddox#14 | 1 | 1 | 0 | 0 | 0 | 0 | 0 |
 Demello Jones#15 | 1 | 1 | 0 | 0 | 0 | 0 | 0 |
 Justin Williams#19 | 1 | 0 | 0 | 0 | 0 | 0 | 0 |
 Quintavius Johnson#33 | 1 | 0 | 0 | 0 | 2 | 0 | 0 |
Ole Miss| Player | FUM | LOST | REC |
|---|---|---|---|
| Kewan Lacy#5 | 1 | 1 | 0 |
| Suntarine Perkins#4 | 0 | 0 | 1 |
Georgia| Player | FUM | LOST | REC |
|---|---|---|---|
| Gunner Stockton#14 | 1 | 1 | 0 |
| Daylen Everette#6 | 0 | 0 | 1 |
Ole Miss| Player | FG | PCT | LONG | XP | PTS |
|---|---|---|---|---|---|
 Lucas Carneiro#17 | 3/3 | 100.0 | 56 | 2/2 | 11 |
Georgia| Player | FG | PCT | LONG | XP | PTS |
|---|---|---|---|---|---|
 Peyton Woodring#91 | 2/3 | 66.7 | 37 | 4/4 | 10 |
Ole Miss| Player | NO | YDS | AVG | TB | In 20 | LONG |
|---|---|---|---|---|---|---|
 Oscar Bird#33 | 3 | 144 | 48.0 | 0 | 1 | 51 |
Georgia| Player | NO | YDS | AVG | TB | In 20 | LONG |
|---|---|---|---|---|---|---|
 Brett Thorson#92 | 4 | 194 | 48.5 | 0 | 2 | 54 |
Georgia| Player | NO | YDS | AVG | LONG | TD |
|---|---|---|---|---|---|
| Landon Roldan#84 | 1 | 6 | 6.0 | 6 | 0 |
Georgia| Player | NO | YDS | AVG | LONG | TD |
|---|---|---|---|---|---|
| Zachariah Branch#1 | 2 | 23 | 11.5 | 12 | 0 |
Drive Summary
MISS
Punt
12
UGA
Punt
29
MISS
Field Goal
60
UGA
Punt
8
MISS
Field Goal
42
UGA
Touchdown
75
MISS
Touchdown
75
UGA
Touchdown
75
MISS
Fumble Touchdown
22
MISS
Punt
7
UGA
Punt
3
MISS
End of Half
39
UGA
Punt
4
MISS
Downs
28
UGA
Missed FG
12
MISS
Touchdown
63
UGA
Field Goal
56
MISS
Touchdown
75
UGA
Fumble
-2
MISS
Touchdown
23
UGA
Touchdown
75
MISS
Punt
5
UGA
Field Goal
58
MISS
Field Goal
45
UGA
Safety
0
UGA
End of Game
-12
Injury Report
No current injury report is available for this matchup.
Head-to-Head
Ole MissLast 1 Game
Georgia
7
College Football Wk 10
FINAL
11/7/26
▸42
Game Information
EventCollege Football Playoff Quarterfinal at the Allstate Sugar Bowl
StagePostseason Week 1
Season2025
KickoffThu, Jan 1, 8:00 pm
VenueCaesars Superdome
LocationNew Orleans, LA
SurfaceArtificial Turf
SiteNeutral Site
BroadcastESPN, ERADM
Attendance68,371
Division Standings
FBS — Southeastern Conference
| Team | W | L | T | Pct | PF | PA | Home | Away | Strk |
|---|---|---|---|---|---|---|---|---|---|
 Alabama | 0 | 1 | 0 | 0.000 | 3 | 38 | 0-0 | 0-1 | L1 |
 Arkansas | 0 | 0 | 0 | .000 | 0 | 0 | — | — | — |
 Auburn | 0 | 0 | 0 | .000 | 0 | 0 | — | — | — |
 Florida | 0 | 0 | 0 | .000 | 0 | 0 | — | — | — |
| Georgia | 0 | 1 | 0 | 0.000 | 34 | 39 | 0-1 | 0-0 | L1 |
 Kentucky | 0 | 0 | 0 | .000 | 0 | 0 | — | — | — |
 LSU | 0 | 0 | 0 | .000 | 0 | 0 | — | — | — |
 Mississippi State | 0 | 1 | 0 | 0.000 | 29 | 43 | 0-1 | 0-0 | L1 |
 Missouri | 0 | 0 | 0 | .000 | 0 | 0 | — | — | — |
 Oklahoma | 0 | 0 | 0 | .000 | 0 | 0 | — | — | — |
| Ole Miss | 1 | 1 | 0 | 0.500 | 66 | 65 | 0-1 | 1-0 | L1 |
 South Carolina | 0 | 0 | 0 | .000 | 0 | 0 | — | — | — |
 Tennessee | 0 | 0 | 0 | .000 | 0 | 0 | — | — | — |
 Texas A&M | 0 | 0 | 0 | .000 | 0 | 0 | — | — | — |
 Texas | 0 | 0 | 0 | .000 | 0 | 0 | — | — | — |
 Vanderbilt | 0 | 0 | 0 | .000 | 0 | 0 | — | — | — |
Ole Miss
6th in SEC
VS
Georgia
1st in SEC
Quarterbacks & Specialists
#33
Oscar Bird
#6
Trinidad Chambliss
Receivers & Backs
#1
Deuce Alexander
#9
Luke Hasz
#5
Kewan Lacy
#4
Caleb Odom
Defensive Line & Linebackers
#96
Jamarious Brown
#52
Will Echoles
#5
Kam Franklin
#4
Suntarine Perkins
Defensive Backs
#2
Jaylon Braxton
#31
Ladarian Clardy
#29
Nick Cull
#8
Antonio Kite
Other
#17
Lucas Carneiro
Quarterbacks & Specialists
#14
Gunner Stockton
Receivers & Backs
#5
Chauncey Bowens
#3
Nate Frazier
#7
Lawson Luckie
#8
Landon Roldan
Sacovie White-Helton
Defensive Line & Linebackers
#9
Chris Cole
#90
Elijah Griffin
#81
Josh Horton
#3
Quintavius Johnson
#99
Joseph Jonah-Ajonye
#19
Justin Williams
#5
Raylen Wilson
Defensive Backs
#4
KJ Bolden
#2
Zion Branch
#14
Rasean Dinkins
#8
Demello Jones
#1
Ellis Robinson IV
Other
#91
Peyton Woodring
Ole Miss
7th in SEC
VS
Georgia
1st in SEC
Passing
61.3
Completion Percentage
70.1
228
Completions
183
2.70
Interception Percentage
1.50
10
Interceptions
4
62
Longest Pass
70
2,570
Net Passing Yards
2,478
257.0
Net Passing Yards Per Game
247.8
372
Passing Attempts
261
5.10
Passing Touchdown %
9.20
19
Passing Touchdowns
24
130.7
Passer Rating
177.2
12
Total Sacks
11
84
Sack Yards Lost
69
6.9
Yards Per Pass Attempt
9.5
2,570
Passing Yards
2,478
0
Passing Fumbles Lost
0
10
Team Games Played
10
407.5
Yards Per Game
455.6
32.1
Total Points Per Game
41.8
321
Total Points
418
40
Total Touchdowns
55
257.0
Passing Yards Per Game
247.8
228-372
Comp-Att
183-261
12-84
Sacks-Yards Lost
11-69
Rushing
331
Rushing Attempts
355
1,505
Rushing Yards
2,078
4.5
Yards Per Rush Attempt
5.9
35
Long Rushing
70
0
20+ Yard Rushing Plays
0
19
Rushing Touchdowns
27
150.5
Rushing Yards Per Game
207.8
0
Rushing Fumbles
0
0
Rushing Fumbles Lost
0
101
Rushing 1st downs
97
10
Team Games Played
10
4,075
Total Yards
4,556
715
Total Offensive Plays
627
32.1
Total Points Per Game
41.8
321
Total Points
418
40
Total Touchdowns
55
Receiving
228
Receptions
183
0
Receiving Targets
0
2,570
Receiving Yards
2,478
2,570
Receiving Yards
2,478
19
Receiving Touchdowns
24
62
Long Reception
70
0
20+ Yard Receiving Plays
0
257.0
Receiving Yards Per Game
247.8
0
Receiving Fumbles
0
0
Receiving Fumbles Lost
0
1025
Receiving Yards After Catch
1402
116
Receiving First Downs
105
10
Team Games Played
10
11.3
Yards Per Reception
13.5
32.1
Total Points Per Game
41.8
321
Total Points
418
40
Total Touchdowns
55
Miscellaneous
240
Total 1st downs
220
101
Rushing 1st downs
97
116
Passing 1st downs
105
23
1st downs by penalty
17
63
Third Down Conversions
58
134
Third Down Attempts
112
47.01
3rd down %
51.79
8
Fourth Down Conversions
4
13
First Downs Attempts
6
61.54
4th down %
66.67
75
Total Penalties
47
633
Total Penalty Yards
443
16016
Possession Time Seconds
18524
0.00
Red Zone Field Goal Percentage
0.00
0.00
Red Zone Scoring Percentage
0.00
0.00
Red Zone Efficiency Percentage
0.00
0.00
Red Zone Touchdown Percentage
0.00
16
Total Takeaways
16
14
Total Giveaways
10
2
Turnover Ratio
6
0
Fumbles Lost
0
63-134
3rd down efficiency
58-112
8-13
4th down efficiency
4-6
75-633
Total-Yards
47-443
Defense
378
Solo Tackles
377
318
Assist Tackles
208
696
Total Tackles
585
21
Sacks
31
145
Sack Yards
207
95
Stuffs
84
32
Passes Defended
39
6.1
Average Interception Yards
20.7
38
Long Interception
43
0
Miscellaneous Touchdowns
0
1
Kicks Blocked
2
49
Tackles For Loss
58
10
Team Games Played
10
Defensive Interceptions
7
Interceptions
9
43
Interception Yards
186
0
Interception Touchdowns
1
7-43
INT: Total
9-186
General
11
Fumbles
16
5
Forced Fumbles
10
6
Fumbles Recovered
12
2
Fumbles Touchdowns
2
10
Games Played
10
11-0
Fumbles-Lost
16-0
Returning
10
Kick Returns
8
184
Kick Return Yards
249
18.4
Yards Per Kick Return
31.1
27
Long Kick Return
91
0
Kick Return Touchdowns
1
9
Punt Returns
23
78
Punt Return Yards
194
8.7
Yards Per Punt Return
8.4
20
Long Punt Return
35
0
Punt Return Touchdowns
0
0
Punt Return Fair Catches
0
0
Kick Return Fumbles Lost
0
0
Punt Return Fumbles Lost
0
10
Team Games Played
10
9-78
Punt: Total
23-194
Kicking
13
Field Goal Made
11
17
Field Goal Attempts
15
76.5
Field Goal Percentage
73.3
57
Long Field Goal Made
49
0
Field Goal Attempts 1-19
0
1
Field Goal Attempts 20-29
3
4
Field Goal Attempts 30-39
3
8
Field Goal Attempts 40-49
8
4
Field Goal Attempts 50+
1
38
Extra Points Made
55
38
Extra Point Attempts
55
100.0
Extra Point Percentage
100.0
0
Field Goals Made 1-19
0
1
Field Goals Made 20-29
3
4
Field Goals Made 30-39
2
7
Field Goals Made 40-49
6
1
Field Goals Made 50+
0
77
Total Kicking Points
88
10
Team Games Played
10
69
Touchback Percentage
64
0.0
Average Kickoff Return Yards
0.0
0
Kickoff Return Yards
0
0
Kickoff Returns
0
0-0
Kickoffs: Total
0-0
13-17
FG: Good-Attempts
11-15
Punting
37
Punts
28
1,634
Punt Yards
1,285
60
Long Punt
65
44.2
Gross Average Punt Yards
45.9
44.2
Net Average Punt Yards
45.9
0
Punts Blocked
0
10
Punts Inside 20
10
1
Touchbacks
6
14
Fair Catches
9
11
Punt Returns
6
0
Punt Return Yards
0
0.0
Average Punt Return Yards
0.0
10
Team Games Played
10
37-1,634
Punt: Total Yards
28-1,285
Scoring
19
Rushing Touchdowns
27
19
Receiving Touchdowns
24
0
Return Touchdowns
1
40
Total Touchdowns
54
13
Field Goals
11
38
Kick Extra Points
55
2
Total Two Point Conversions
0
321
Total Points
418
32.1
Total Points Per Game
41.8