

Oregon State vs UTEP Live Score (27 Sep, 2026)
Score by Quarter
| Team | Q1 | Q2 | Q3 | Q4 | Final |
|---|---|---|---|---|---|
 Oregon State | 17 | 3 | 7 | 6 | 33 |
 UTEP | 0 | 0 | 7 | 0 | 7 |
Scoring Plays
Q1
12:23
12:23
AJ Newberry 12 Yd Run (Caleb Ojeda Kick)
Rushing Touchdown
7 – 0
Q1
7:22
7:22
Caleb Ojeda 37 Yd Field Goal
Field Goal Good
10 – 0
Q1
1:50
1:50
Jesse Legree 14 Yd pass from Braden Atkinson (Caleb Ojeda Kick)
Passing Touchdown
17 – 0
Q2
2:20
2:20
Caleb Ojeda 35 Yd Field Goal
Field Goal Good
20 – 0
Q3
10:08
10:08
Carver Cheeks 6 Yd pass from EJ Colson Jr. (Carlos Arreola Kick)
Pass Reception
20 – 7
Q3
6:16
6:16
Jesse Legree 19 Yd pass from Braden Atkinson (Caleb Ojeda Kick)
Passing Touchdown
27 – 7
Q4
14:56
14:56
Jameson Powell 18 Yd pass from Braden Atkinson (Two-Point Pass Conversion Failed)
Passing Touchdown
33 – 7
Game Leaders
Oregon StateUTEP
 B. Atkinson QB
Passing Yards
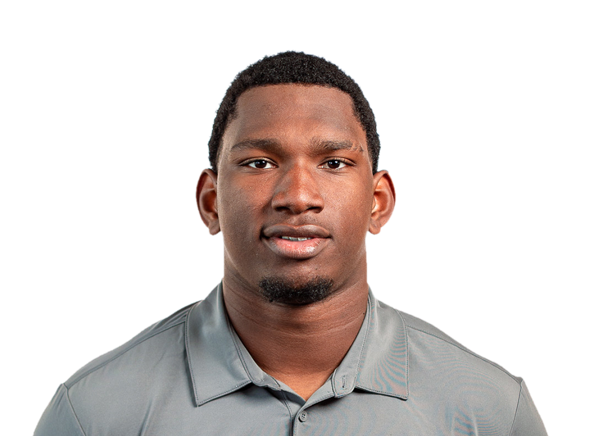 E. Colson Jr. QB
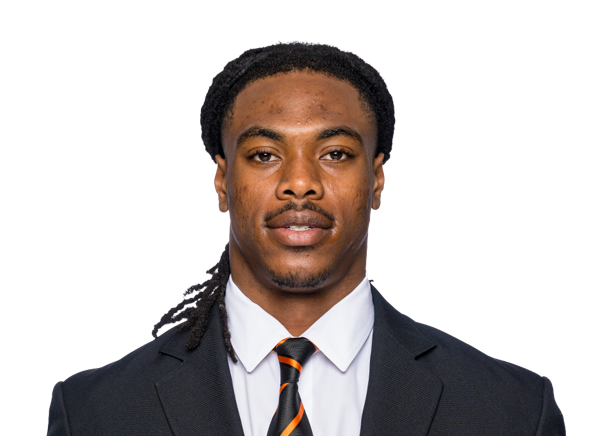 A. Newberry RB
Rushing Yards
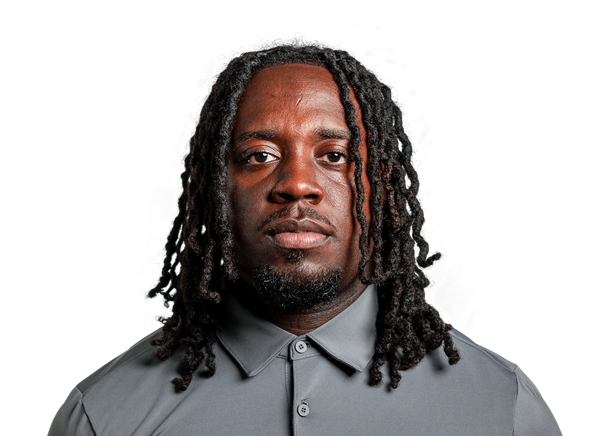 T. Jones RB
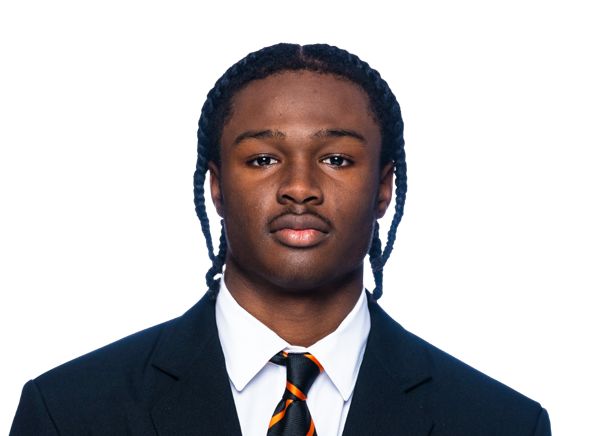 J. Legree WR
Receiving Yards
 J. Smith WR
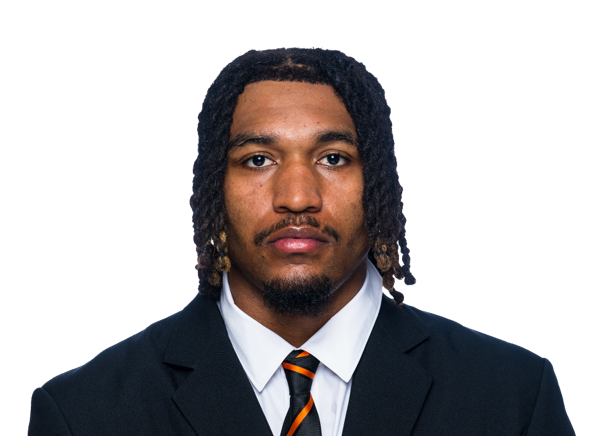 T. Hickle LB
Sacks
—
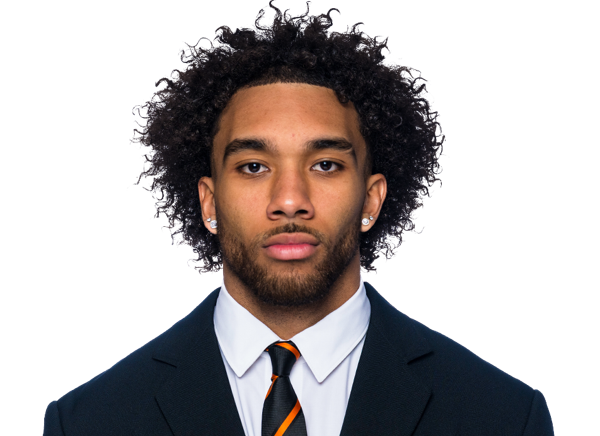 G. Goodman LB
Tackles
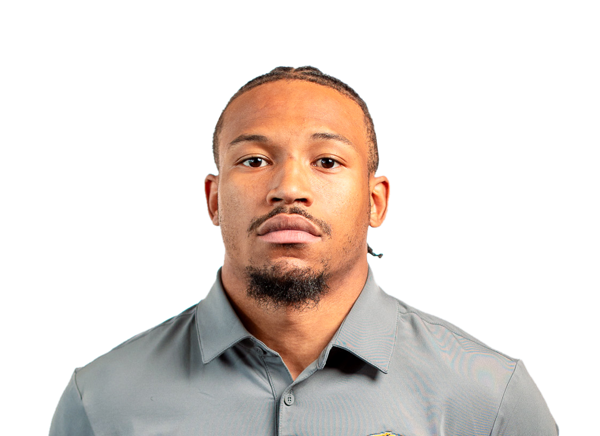 J. Content CB
Player Box Score
Oregon State| Player | C/ATT | YDS | AVG | TD | INT |
|---|---|---|---|---|---|
| Braden Atkinson#2 | 24/34 | 301 | 8.9 | 3 | 1 |
UTEP| Player | C/ATT | YDS | AVG | TD | INT |
|---|---|---|---|---|---|
| EJ Colson Jr.#1 | 16/23 | 119 | 5.2 | 1 | 1 |
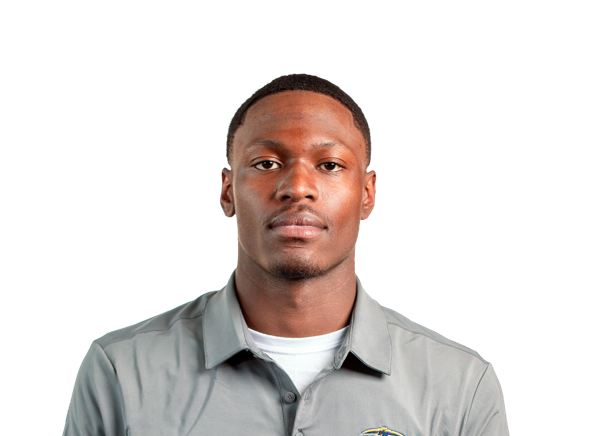 Raymond Moore III#12 | 2/2 | 11 | 5.5 | 0 | 0 |
Oregon State| Player | CAR | YDS | AVG | TD | LONG |
|---|---|---|---|---|---|
| AJ Newberry#23 | 11 | 111 | 10.1 | 1 | 35 |
 Cornell Hatcher Jr.#3 | 6 | 19 | 3.2 | 0 | 14 |
| Braden Atkinson#2 | 2 | 8 | 4.0 | 0 | 5 |
 Aaron Butler | 1 | 6 | 6.0 | 0 | 6 |
 Jake Reichle#34 | 1 | 5 | 5.0 | 0 | 5 |
 Tre Garrison#22 | 1 | 2 | 2.0 | 0 | 2 |
 Team | 1 | -1 | -1.0 | 0 | 0 |
UTEP| Player | CAR | YDS | AVG | TD | LONG |
|---|---|---|---|---|---|
| Tavorus Jones | 10 | 34 | 3.4 | 0 | 10 |
 Elijah McCoy#6 | 2 | 25 | 12.5 | 0 | 21 |
| EJ Colson Jr.#1 | 19 | 15 | 0.8 | 0 | 10 |
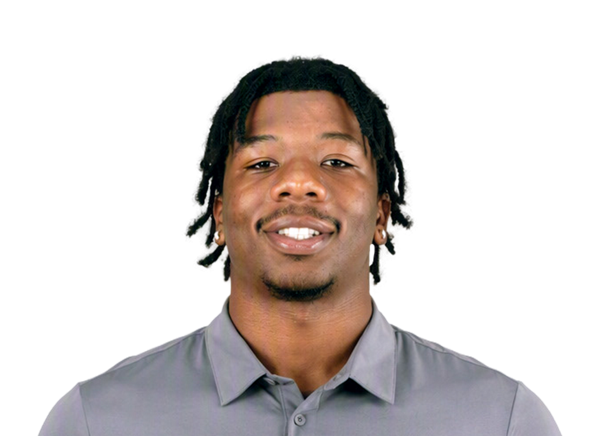 Jaden Moore#21 | 3 | 7 | 2.3 | 0 | 5 |
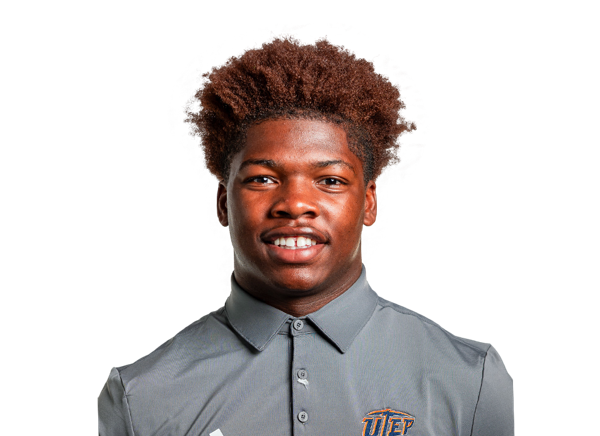 Chris Hunter#22 | 2 | 6 | 3.0 | 0 | 5 |
| Jaden Smith#3 | 1 | 5 | 5.0 | 0 | 5 |
| Raymond Moore III#12 | 4 | 0 | 0.0 | 0 | 3 |
Oregon State| Player | REC | YDS | AVG | TD | LONG |
|---|---|---|---|---|---|
| Jesse Legree#12 | 6 | 109 | 18.2 | 2 | 46 |
 Eric Olsen#80 | 5 | 79 | 15.8 | 0 | 40 |
| Aaron Butler | 3 | 39 | 13.0 | 0 | 19 |
 Jameson Powell#15 | 2 | 20 | 10.0 | 1 | 18 |
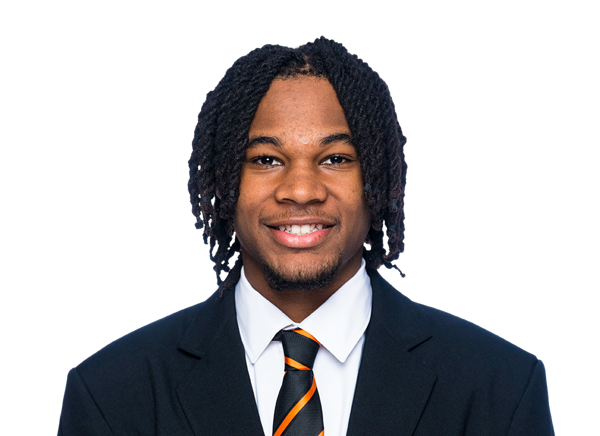 Cynai Thomas#16 | 1 | 16 | 16.0 | 0 | 16 |
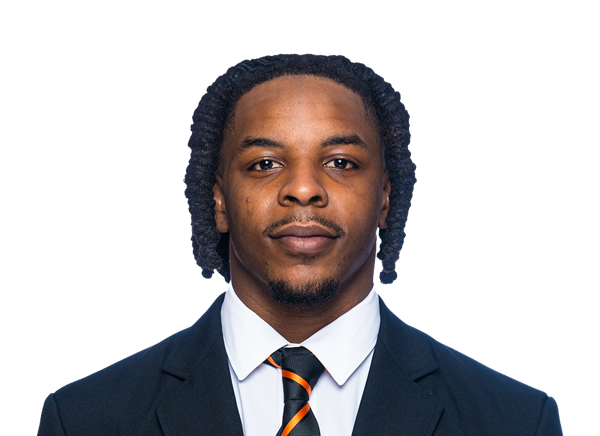 Aeryn Hampton#7 | 2 | 16 | 8.0 | 0 | 8 |
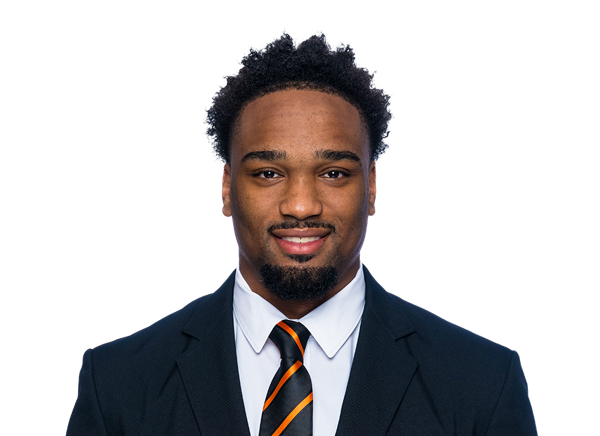 DeCorion Temple#8 | 2 | 8 | 4.0 | 0 | 8 |
 Gabe Milbourn#82 | 1 | 6 | 6.0 | 0 | 6 |
| AJ Newberry#23 | 1 | 6 | 6.0 | 0 | 6 |
| Jake Reichle#34 | 1 | 2 | 2.0 | 0 | 2 |
UTEP| Player | REC | YDS | AVG | TD | LONG |
|---|---|---|---|---|---|
| Jaden Smith#3 | 8 | 62 | 7.8 | 0 | 13 |
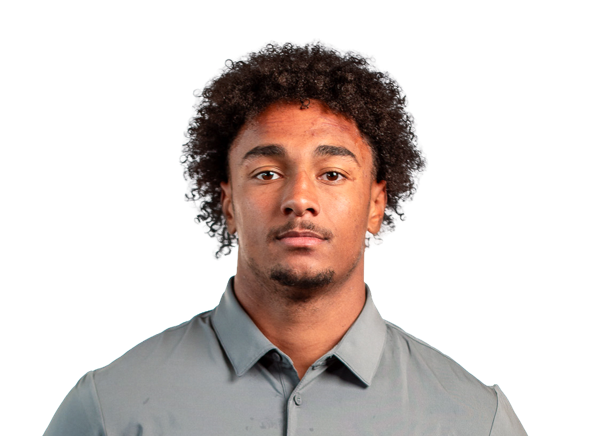 Carver Cheeks#5 | 4 | 46 | 11.5 | 1 | 27 |
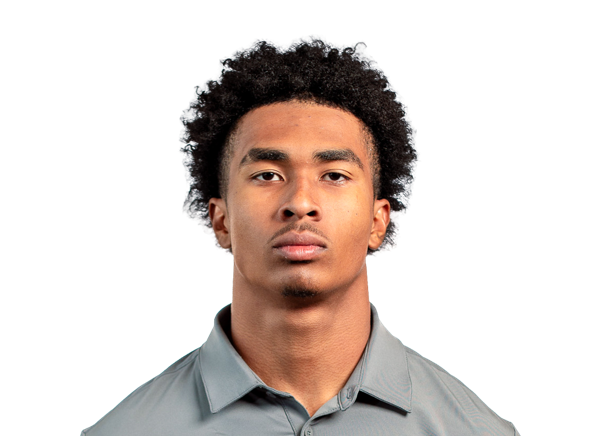 Jeremiah Nash#81 | 2 | 9 | 4.5 | 0 | 7 |
 Cash Cheeks#4 | 1 | 8 | 8.0 | 0 | 8 |
 Carmelo Taylor#17 | 1 | 5 | 5.0 | 0 | 5 |
| Tavorus Jones | 1 | 0 | 0.0 | 0 | 0 |
| Chris Hunter#22 | 1 | 0 | 0.0 | 0 | 0 |
Oregon State| Player | TOT | SOLO | SACKS | TFL | PD | QB HUR | TD |
|---|---|---|---|---|---|---|---|
| Gyriece Goodman#12 | 9 | 5 | 1 | 1 | 1 | 0 | 0 |
 Dylan Layne#1 | 8 | 3 | 1 | 1 | 0 | 1 | 0 |
 Kord Shaw#14 | 7 | 3 | 0 | 0 | 1 | 0 | 0 |
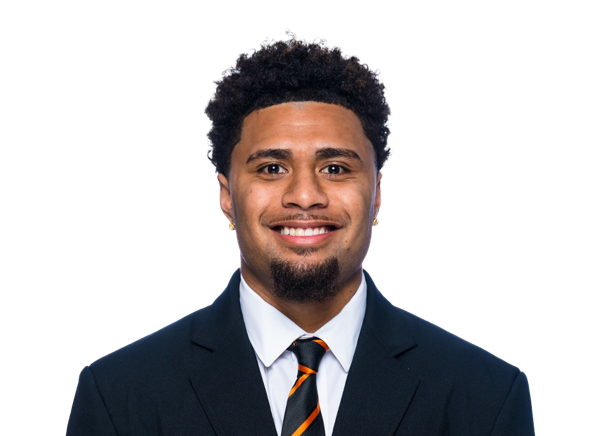 Sailasa Vadrawale III#8 | 6 | 4 | 0 | 0 | 0 | 0 | 0 |
 Tevita Pome'e#59 | 6 | 3 | 0.5 | 2 | 0 | 0 | 0 |
| Takari Hickle#44 | 5 | 1 | 1.5 | 2 | 0 | 0 | 0 |
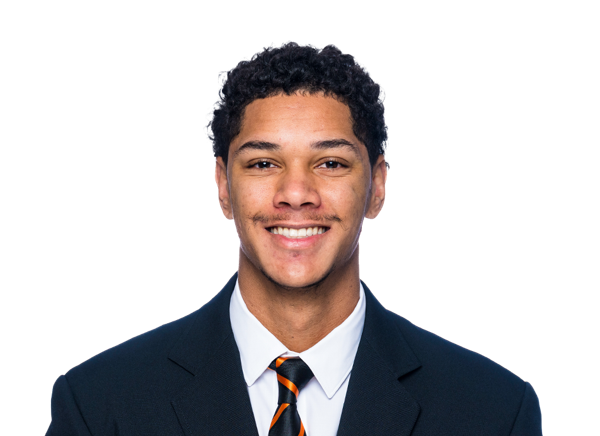 Drake Vickers#36 | 5 | 1 | 0 | 0 | 0 | 0 | 0 |
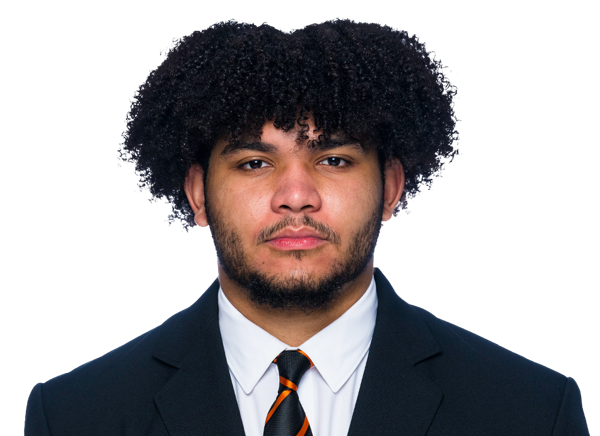 Niklas Fisher#99 | 5 | 1 | 0 | 0 | 0 | 0 | 0 |
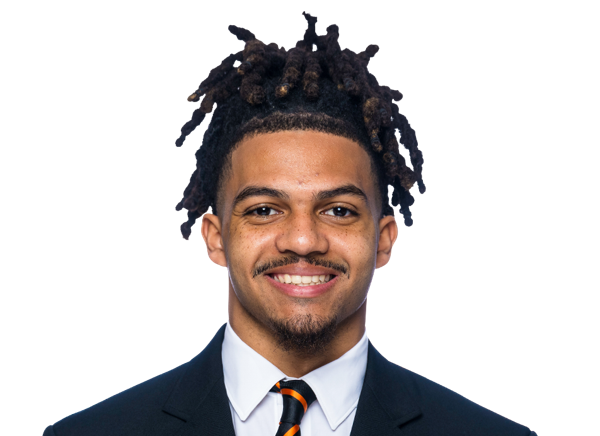 Isaiah Houi#22 | 4 | 3 | 0 | 0 | 0 | 0 | 0 |
 Aiden Sullivan#2 | 4 | 2 | 1 | 1 | 0 | 1 | 0 |
 Logan Knapp#10 | 3 | 2 | 0 | 0 | 0 | 0 | 0 |
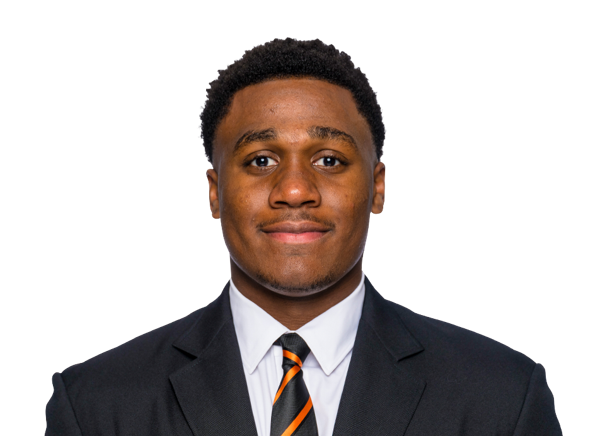 Jarrel Comer#18 | 3 | 1 | 0.5 | 0.5 | 0 | 0 | 0 |
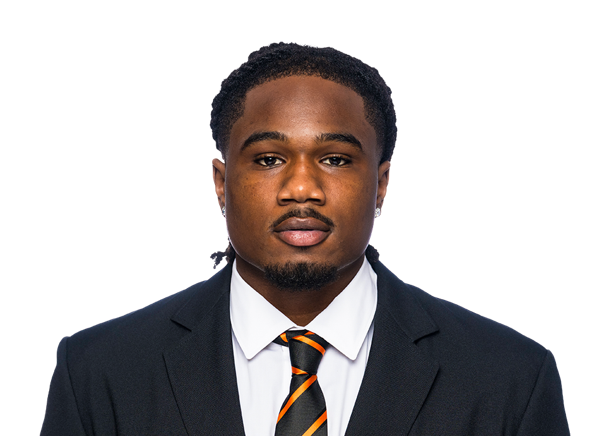 Jabari Odoemenem#3 | 3 | 0 | 0.5 | 0.5 | 0 | 0 | 0 |
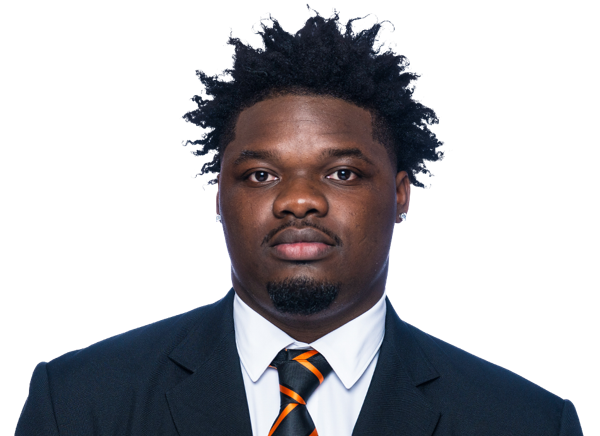 Tyler Bailey#97 | 3 | 0 | 0.5 | 0.5 | 0 | 0 | 0 |
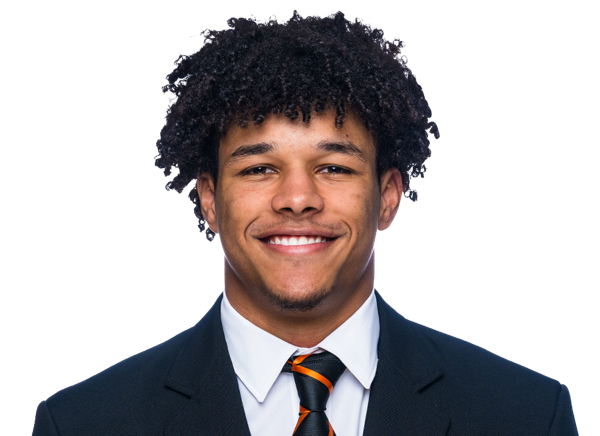 TJ Crandall#4 | 2 | 1 | 0 | 0 | 0 | 0 | 0 |
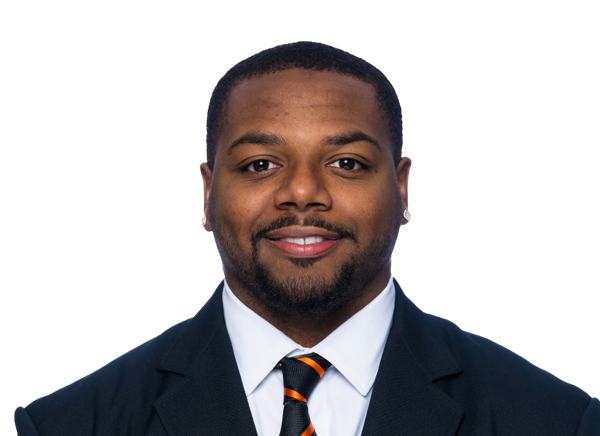 Raesjon Davis#9 | 1 | 1 | 0 | 0 | 0 | 0 | 0 |
 Jacob Schuster#62 | 1 | 0 | 0 | 0 | 0 | 0 | 0 |
| Jake Reichle#34 | 1 | 0 | 0 | 0 | 0 | 0 | 0 |
| Eric Olsen#80 | 1 | 0 | 0 | 0 | 0 | 0 | 0 |
 Daniel Matagi#90 | 1 | 0 | 0.5 | 0.5 | 0 | 0 | 0 |
 Jaylen Hill#91 | 1 | 0 | 0 | 0 | 0 | 0 | 0 |
 Clive Pond#54 | 0 | 0 | 0 | 0 | 0 | 1 | 0 |
UTEP| Player | TOT | SOLO | SACKS | TFL | PD | QB HUR | TD |
|---|---|---|---|---|---|---|---|
| Justin Content | 9 | 5 | 0 | 0 | 0 | 0 | 0 |
 Xavier Smith#2 | 6 | 3 | 0 | 0 | 1 | 0 | 0 |
 Decorian Thompson#18 | 5 | 3 | 0 | 0 | 1 | 0 | 0 |
 Esteban Guillory#16 | 4 | 2 | 0 | 0.5 | 0 | 0 | 0 |
 Jayden Wilson#10 | 4 | 1 | 0 | 0 | 0 | 1 | 0 |
 Isaiah Bogerty#13 | 4 | 1 | 0 | 0 | 0 | 0 | 0 |
 Oryend Fisher#9 | 3 | 2 | 0 | 0 | 1 | 0 | 0 |
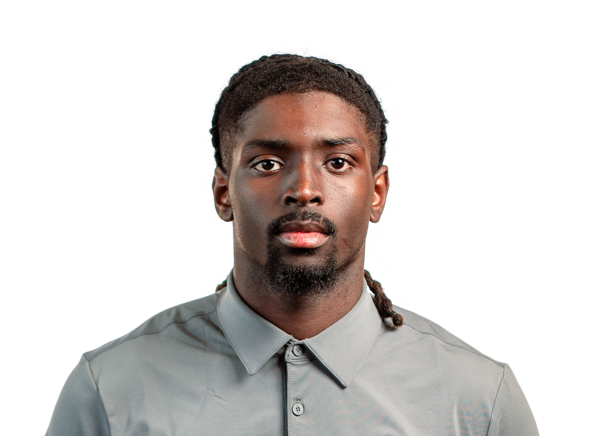 Donavan Howard#12 | 3 | 2 | 0 | 0 | 0 | 0 | 0 |
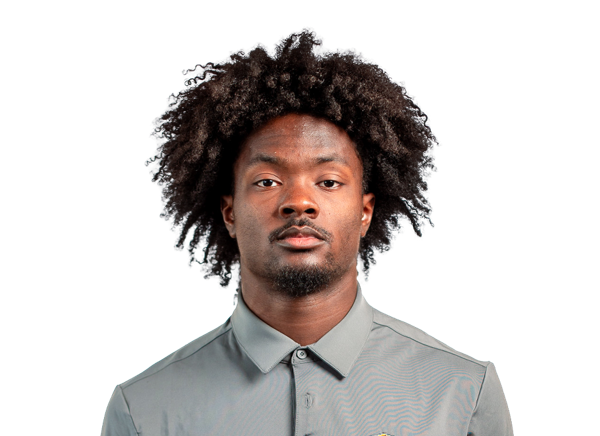 Kaleb Miles#23 | 3 | 2 | 0 | 0 | 0 | 0 | 0 |
 Garrett Hawkins#4 | 3 | 0 | 0 | 0.5 | 0 | 1 | 0 |
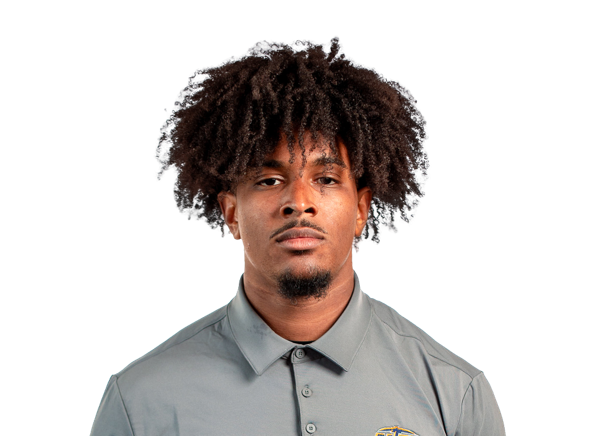 Shakaun Bowser#3 | 2 | 1 | 0 | 1 | 0 | 0 | 0 |
 Kode Lowe#7 | 2 | 0 | 0 | 0 | 0 | 0 | 0 |
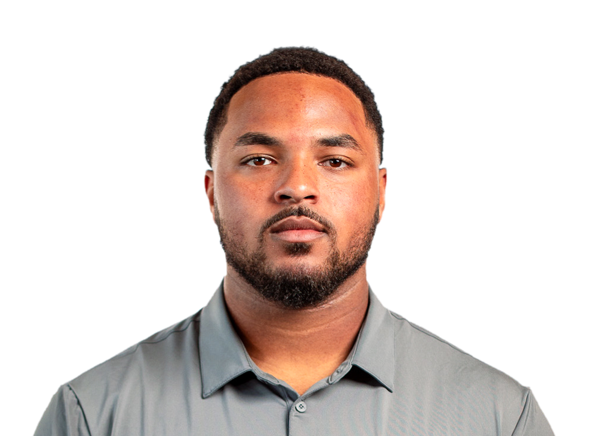 Ashton Coker#90 | 2 | 0 | 0 | 0 | 0 | 0 | 0 |
 Darnell Williams#17 | 1 | 1 | 0 | 0 | 0 | 0 | 0 |
 LaTristan Thompson#27 | 1 | 1 | 0 | 0 | 0 | 0 | 0 |
 Dycin Davis#21 | 1 | 1 | 0 | 0 | 0 | 0 | 0 |
 Colt Matlock#15 | 1 | 1 | 0 | 0 | 0 | 0 | 0 |
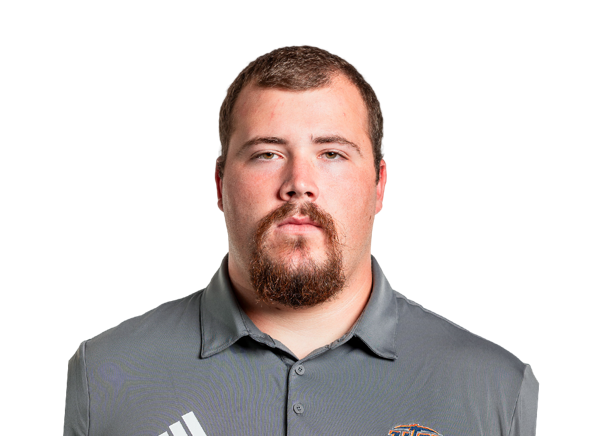 Preston Hickey#98 | 1 | 0 | 0 | 0 | 0 | 0 | 0 |
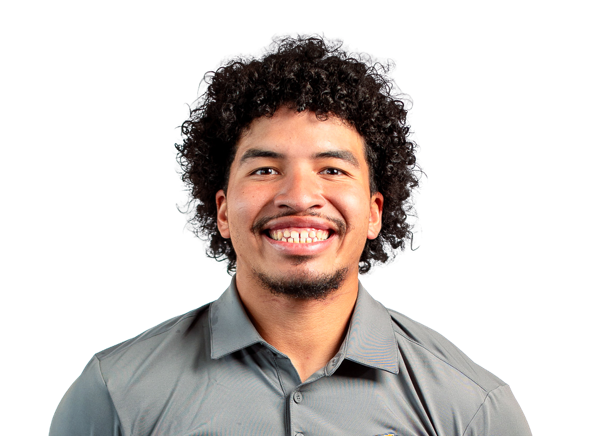 Shay Smith#8 | 1 | 0 | 0 | 0 | 0 | 0 | 0 |
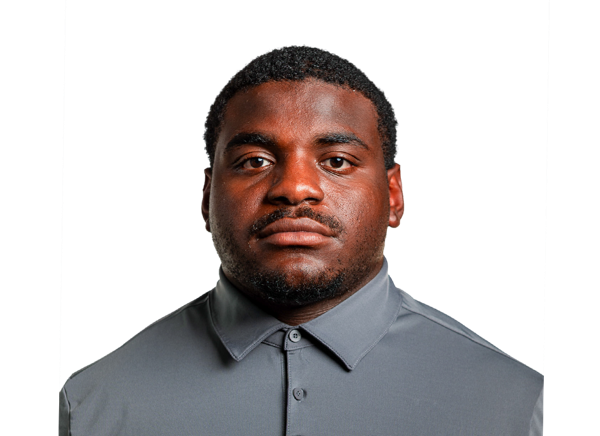 Elijah Fields#1 | 1 | 0 | 0 | 0 | 0 | 0 | 0 |
 Royce Wilson#25 | 1 | 0 | 0 | 0 | 0 | 0 | 0 |
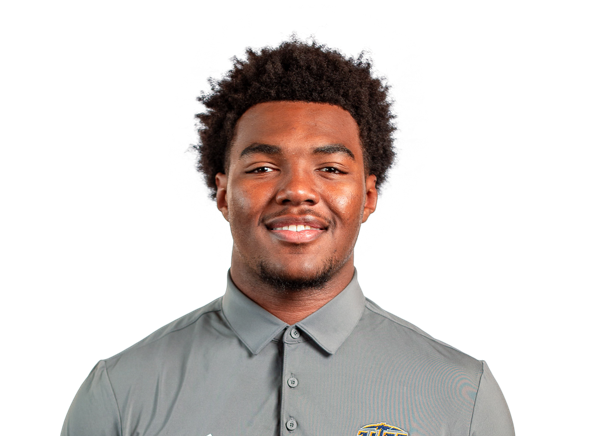 Justin Lee#45 | 1 | 0 | 0 | 0 | 0 | 0 | 0 |
 Jerrell Brasher#93 | 1 | 0 | 0 | 0 | 0 | 0 | 0 |
Oregon State| Player | FG | PCT | LONG | XP | PTS |
|---|---|---|---|---|---|
 Caleb Ojeda#28 | 2/2 | 100.0 | 37 | 3/3 | 9 |
UTEP| Player | FG | PCT | LONG | XP | PTS |
|---|---|---|---|---|---|
 Carlos Arreola#91 | 0/0 | 0.0 | 0 | 1/1 | 1 |
Oregon State| Player | NO | YDS | AVG | TB | In 20 | LONG |
|---|---|---|---|---|---|---|
 AJ Winsor#38 | 1 | 49 | 49.0 | 0 | 0 | 49 |
UTEP| Player | NO | YDS | AVG | TB | In 20 | LONG |
|---|---|---|---|---|---|---|
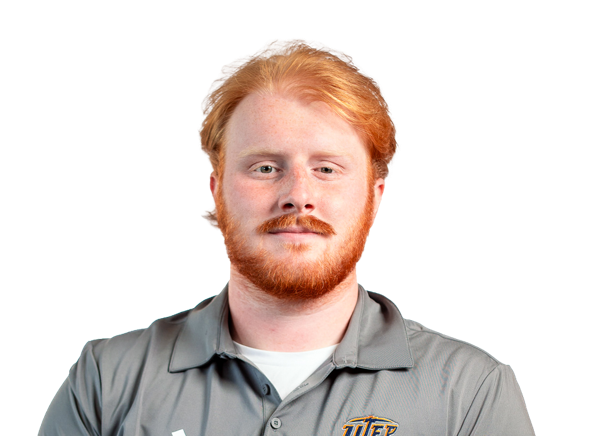 Brady Braun#47 | 5 | 247 | 49.4 | 0 | 1 | 55 |
UTEP| Player | NO | YDS | AVG | LONG | TD |
|---|---|---|---|---|---|
| Decorian Thompson#18 | 1 | 0 | 0.0 | 0 | 0 |
Oregon State| Player | NO | YDS | AVG | LONG | TD |
|---|---|---|---|---|---|
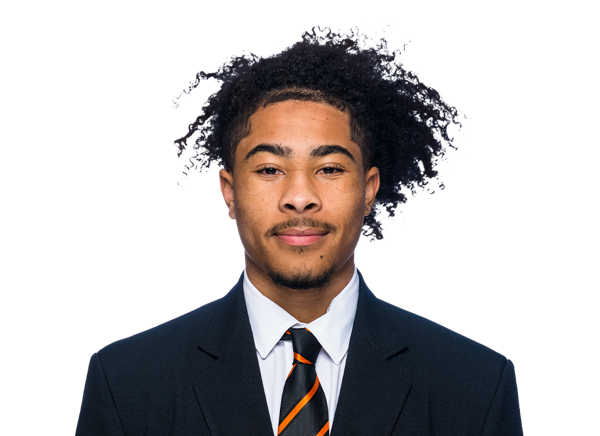 Xavyion Noland#4 | 3 | 12 | 4.0 | 5 | 0 |
UTEP| Player | NO | YDS | AVG | LONG | TD |
|---|---|---|---|---|---|
 Kam Thomas#8 | 1 | 6 | 6.0 | 6 | 0 |
Oregon State| Player | INT | YDS | TD |
|---|---|---|---|
| TJ Crandall#4 | 1 | 0 | 0 |
UTEP| Player | INT | YDS | TD |
|---|---|---|---|
| Kaleb Miles#23 | 1 | 1 | 0 |
Drive Summary
ORST
Touchdown
75
UTEP
Punt
-10
ORST
Field Goal
40
UTEP
Punt
3
ORST
Touchdown
75
UTEP
Punt
4
ORST
Interception
22
UTEP
Downs
13
ORST
Downs
30
UTEP
Punt
7
ORST
Field Goal
65
UTEP
End of Half
50
UTEP
Touchdown
75
ORST
Touchdown
75
UTEP
Punt
8
ORST
Touchdown
74
UTEP
Interception
56
ORST
Punt
16
UTEP
Downs
72
ORST
End of Game
-1
Injury Report
No current injury report is available for this matchup.
Head-to-Head
Historical meetings are not available for this matchup.
Game Information
StageWeek 4
Season2026
KickoffSat, Sep 26, 9:00 pm
VenueSun Bowl
LocationEl Paso, TX
SurfaceArtificial Turf
BroadcastMW+
Division Standings
FBS — Pac-12 Conference
| Team | W | L | T | Pct | PF | PA | Home | Away | Strk |
|---|---|---|---|---|---|---|---|---|---|
 Boise State | 7 | 1 | 0 | 0.875 | 287 | 189 | 4-0 | 3-1 | W7 |
 Fresno State | 5 | 3 | 0 | 0.625 | 231 | 168 | 3-1 | 2-2 | W1 |
 Colorado State | 3 | 5 | 0 | 0.375 | 284 | 339 | 3-2 | 0-3 | L1 |
| Oregon State | 5 | 3 | 0 | 0.625 | 321 | 200 | 3-1 | 2-2 | L1 |
 Texas State | 4 | 4 | 0 | 0.500 | 305 | 256 | 4-1 | 0-3 | L1 |
 San Diego State | 4 | 5 | 0 | 0.444 | 238 | 309 | 4-1 | 0-4 | W1 |
 Utah State | 3 | 5 | 0 | 0.375 | 135 | 175 | 3-1 | 0-4 | W1 |
 Washington State | 1 | 8 | 0 | 0.111 | 171 | 247 | 1-3 | 0-5 | L6 |
FBS — Mountain West Conference
| Team | W | L | T | Pct | PF | PA | Home | Away | Strk |
|---|---|---|---|---|---|---|---|---|---|
 North Dakota State | 7 | 2 | 0 | 0.778 | 253 | 107 | 5-0 | 2-2 | W1 |
 UNLV | 5 | 3 | 0 | 0.625 | 200 | 190 | 3-1 | 2-2 | W1 |
 Wyoming | 5 | 3 | 0 | 0.625 | 156 | 160 | 4-0 | 1-3 | W3 |
 New Mexico | 7 | 1 | 0 | 0.875 | 280 | 95 | 4-0 | 3-1 | W5 |
 San José State | 4 | 5 | 0 | 0.444 | 179 | 201 | 1-3 | 3-2 | L2 |
 Nevada | 3 | 5 | 0 | 0.375 | 184 | 181 | 2-2 | 1-3 | L1 |
| UTEP | 1 | 7 | 0 | 0.125 | 113 | 292 | 1-3 | 0-4 | L6 |
 Northern Illinois | 0 | 8 | 0 | 0.000 | 130 | 301 | 0-3 | 0-5 | L8 |
 Air Force | 6 | 2 | 0 | 0.750 | 234 | 172 | 4-1 | 2-1 | W1 |
 Hawai'i | 2 | 6 | 0 | 0.250 | 166 | 196 | 1-3 | 1-3 | W1 |
Oregon State
1st in Pac-12
VS
UTEP
9th in Mountain West
Quarterbacks & Specialists
#2
Braden Atkinson
#38
AJ Winsor
Receivers & Backs
Aaron Butler
#22
Tre Garrison
#7
Aeryn Hampton
#3
Cornell Hatcher Jr.
#12
Jesse Legree
#82
Gabe Milbourn
#23
AJ Newberry
#4
Xayvion Noland
#80
Eric Olsen
#15
Jameson Powell
#34
Jake Reichle
#8
DeCorion Temple
#16
Cynai Thomas
Defensive Line & Linebackers
#97
Tyler Bailey
#18
Jarrel Comer
#9
Raesjon Davis
#99
Niklas Fisher
#12
Gyriece Goodman
#44
Takari Hickle
#91
Jaylen Hill
#10
Logan Knapp
#1
Dylan Layne
#90
Daniel Matagi
#3
Jabari Odoemenem
#59
Tevita Pome'e
#54
Clive Pond
#62
Jacob Schuster
#14
Kord Shaw
#2
Aiden Sullivan
Defensive Backs
#4
TJ Crandall
#22
Isaiah Houi
#8
Sailasa Vadrawale III
#36
Drake Vickers
Other
#28
Caleb Ojeda
Quarterbacks & Specialists
#47
Brady Braun
#1
EJ Colson Jr.
#12
Raymond Moore III
Receivers & Backs
#5
Carver Cheeks
#4
Cash Cheeks
#22
Chris Hunter
Tavorus Jones
#6
Elijah McCoy
#21
Jaden Moore
#81
Jeremiah Nash
#3
Jaden Smith
#17
Carmelo Taylor
#8
Kam Thomas
Defensive Line & Linebackers
#13
Isaiah Bogerty
#3
Shakaun Bowser
#93
Jerrell Brasher
#90
Ashton Coker
#21
Dycin Davis
#1
Elijah Fields
#9
Oryend Fisher
#4
Garrett Hawkins
#98
Preston Hickey
#45
Justin Lee
#8
Shay Smith
#10
Jayden Wilson
#25
Royce Wilson
Defensive Backs
Justin Content
#16
Esteban Guillory
#12
Donavan Howard
#7
Kode Lowe
#15
Colt Matlock
#23
Kaleb Miles
#2
Xavier Smith
#18
Decorian Thompson
#27
LaTristan Thompson
#17
Darnell Williams
Other
#91
Carlos Arreola
Oregon State
1st in Pac-12
VS
UTEP
9th in Mountain West
Passing
69.9
Completion Percentage
64.3
202
Completions
101
0.70
Interception Percentage
3.20
2
Interceptions
5
90
Longest Pass
83
2,694
Net Passing Yards
1,063
384.9
Net Passing Yards Per Game
151.9
289
Passing Attempts
157
9.00
Passing Touchdown %
5.70
26
Passing Touchdowns
9
176.3
Passer Rating
133.9
9
Total Sacks
36
71
Sack Yards Lost
204
9.3
Yards Per Pass Attempt
6.8
2,694
Passing Yards
1,063
0
Passing Fumbles Lost
0
7
Team Games Played
7
527.0
Yards Per Game
286.3
42.7
Total Points Per Game
15.1
299
Total Points
106
40
Total Touchdowns
14
384.9
Passing Yards Per Game
151.9
202-289
Comp-Att
101-157
9-71
Sacks-Yards Lost
36-204
Rushing
213
Rushing Attempts
254
995
Rushing Yards
941
4.7
Yards Per Rush Attempt
3.7
35
Long Rushing
86
0
20+ Yard Rushing Plays
0
14
Rushing Touchdowns
5
142.1
Rushing Yards Per Game
134.4
0
Rushing Fumbles
0
0
Rushing Fumbles Lost
0
54
Rushing 1st downs
48
7
Team Games Played
7
3,689
Total Yards
2,004
511
Total Offensive Plays
447
42.7
Total Points Per Game
15.1
299
Total Points
106
40
Total Touchdowns
14
Receiving
202
Receptions
101
0
Receiving Targets
0
2,694
Receiving Yards
1,063
2,694
Receiving Yards
1,063
26
Receiving Touchdowns
9
90
Long Reception
83
0
20+ Yard Receiving Plays
0
384.9
Receiving Yards Per Game
151.9
0
Receiving Fumbles
0
0
Receiving Fumbles Lost
0
1618
Receiving Yards After Catch
536
117
Receiving First Downs
44
7
Team Games Played
7
13.3
Yards Per Reception
10.5
42.7
Total Points Per Game
15.1
299
Total Points
106
40
Total Touchdowns
14
Miscellaneous
186
Total 1st downs
105
54
Rushing 1st downs
48
117
Passing 1st downs
44
15
1st downs by penalty
13
42
Third Down Conversions
22
88
Third Down Attempts
90
47.73
3rd down %
24.44
10
Fourth Down Conversions
12
17
First Downs Attempts
19
58.82
4th down %
63.16
45
Total Penalties
41
428
Total Penalty Yards
376
13162
Possession Time Seconds
12285
0.00
Red Zone Field Goal Percentage
0.00
0.00
Red Zone Scoring Percentage
0.00
0.00
Red Zone Efficiency Percentage
0.00
0.00
Red Zone Touchdown Percentage
0.00
6
Total Takeaways
11
4
Total Giveaways
10
2
Turnover Ratio
1
0
Fumbles Lost
0
42-88
3rd down efficiency
22-90
10-17
4th down efficiency
12-19
45-428
Total-Yards
41-376
Defense
230
Solo Tackles
200
258
Assist Tackles
290
488
Total Tackles
490
18
Sacks
8
99
Sack Yards
51
49
Stuffs
49
31
Passes Defended
13
8.2
Average Interception Yards
6.0
24
Long Interception
17
0
Miscellaneous Touchdowns
0
0
Kicks Blocked
0
27
Tackles For Loss
20
7
Team Games Played
7
Defensive Interceptions
6
Interceptions
3
49
Interception Yards
18
0
Interception Touchdowns
0
6-49
INT: Total
3-18
General
7
Fumbles
8
3
Forced Fumbles
5
4
Fumbles Recovered
6
0
Fumbles Touchdowns
0
7
Games Played
7
7-0
Fumbles-Lost
8-0
Returning
13
Kick Returns
12
230
Kick Return Yards
211
17.7
Yards Per Kick Return
17.6
46
Long Kick Return
25
0
Kick Return Touchdowns
0
14
Punt Returns
6
114
Punt Return Yards
30
8.1
Yards Per Punt Return
5.0
29
Long Punt Return
8
0
Punt Return Touchdowns
0
0
Punt Return Fair Catches
0
0
Kick Return Fumbles Lost
0
0
Punt Return Fumbles Lost
0
7
Team Games Played
7
14-114
Punt: Total
6-30
Kicking
7
Field Goal Made
3
10
Field Goal Attempts
8
70.0
Field Goal Percentage
37.5
53
Long Field Goal Made
47
0
Field Goal Attempts 1-19
0
1
Field Goal Attempts 20-29
0
3
Field Goal Attempts 30-39
4
3
Field Goal Attempts 40-49
3
3
Field Goal Attempts 50+
1
36
Extra Points Made
11
36
Extra Point Attempts
12
100.0
Extra Point Percentage
91.7
0
Field Goals Made 1-19
0
1
Field Goals Made 20-29
0
3
Field Goals Made 30-39
2
2
Field Goals Made 40-49
1
1
Field Goals Made 50+
0
57
Total Kicking Points
20
7
Team Games Played
7
62
Touchback Percentage
74
0.0
Average Kickoff Return Yards
0.0
0
Kickoff Return Yards
0
0
Kickoff Returns
0
0-0
Kickoffs: Total
0-0
7-10
FG: Good-Attempts
3-8
Punting
18
Punts
35
768
Punt Yards
1,444
57
Long Punt
71
42.7
Gross Average Punt Yards
41.3
42.7
Net Average Punt Yards
41.3
0
Punts Blocked
0
7
Punts Inside 20
10
0
Touchbacks
2
9
Fair Catches
5
5
Punt Returns
12
0
Punt Return Yards
0
0.0
Average Punt Return Yards
0.0
7
Team Games Played
7
18-768
Punt: Total Yards
35-1,444
Scoring
14
Rushing Touchdowns
5
26
Receiving Touchdowns
9
0
Return Touchdowns
0
40
Total Touchdowns
14
7
Field Goals
3
36
Kick Extra Points
11
1
Total Two Point Conversions
1
299
Total Points
106
42.7
Total Points Per Game
15.1