

Oregon vs Texas Tech Live Score (1 Jan, 2026)
Score by Quarter
| Team | Q1 | Q2 | Q3 | Q4 | Final |
|---|---|---|---|---|---|
 Oregon | 3 | 3 | 7 | 10 | 23 |
 Texas Tech | 0 | 0 | 0 | 0 | 0 |
Scoring Plays
Q1
10:41
10:41
Atticus Sappington 50 Yd Field Goal
Field Goal Good
3 – 0
Q2
1:33
1:33
Atticus Sappington 39 Yd Field Goal
Field Goal Good
6 – 0
Q3
11:20
11:20
Jordon Davison 6 Yd Run (Atticus Sappington Kick)
Rushing Touchdown
13 – 0
Q4
7:53
7:53
Atticus Sappington 43 Yd Field Goal
Field Goal Good
16 – 0
Q4
0:16
0:16
Jordon Davison 1 Yd Run (Atticus Sappington Kick)
Rushing Touchdown
23 – 0
Game Leaders
OregonTexas Tech
 D. Moore QB
Passing Yards
 B. Morton QB
 J. Davison RB
Rushing Yards
 J. Williams RB
 J. Johnson TE
Receiving Yards
 T. Carter Jr. TE
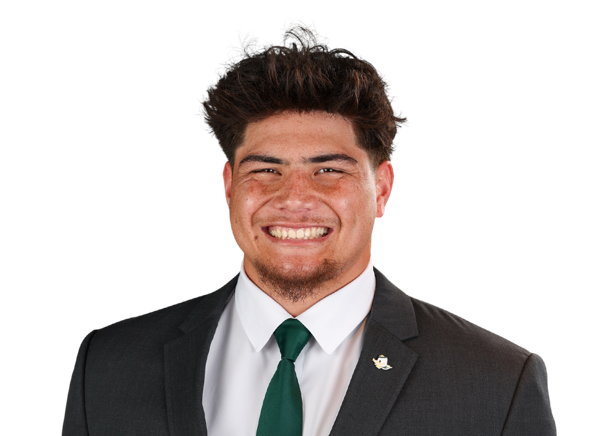 T. Tuioti LB
Sacks
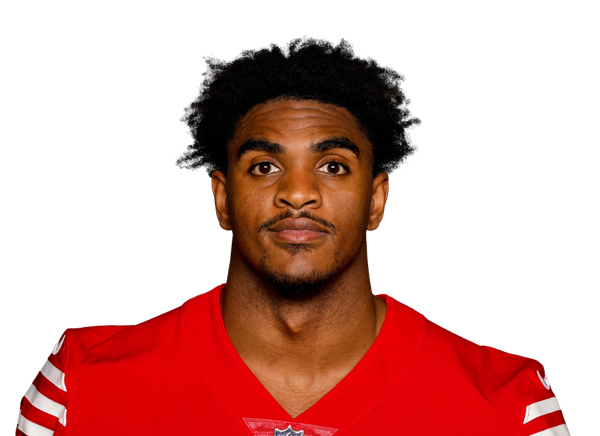 R. Height EDGE
 D. Thieneman S
Tackles
 B. Roberts LB
Player Box Score
Oregon| Player | C/ATT | YDS | AVG | TD | INT | QBR |
|---|---|---|---|---|---|---|
| Dante Moore#5 | 26/33 | 234 | 7.1 | 0 | 1 | 62.3 |
 James Ferguson-Reynolds#46 | 1/1 | 11 | 11.0 | 0 | 0 | 100.0 |
Texas Tech| Player | C/ATT | YDS | AVG | TD | INT | QBR |
|---|---|---|---|---|---|---|
| Behren Morton#2 | 18/32 | 137 | 4.3 | 0 | 2 | 17.2 |
Oregon| Player | CAR | YDS | AVG | TD | LONG |
|---|---|---|---|---|---|
| Jordon Davison | 15 | 42 | 2.8 | 2 | 7 |
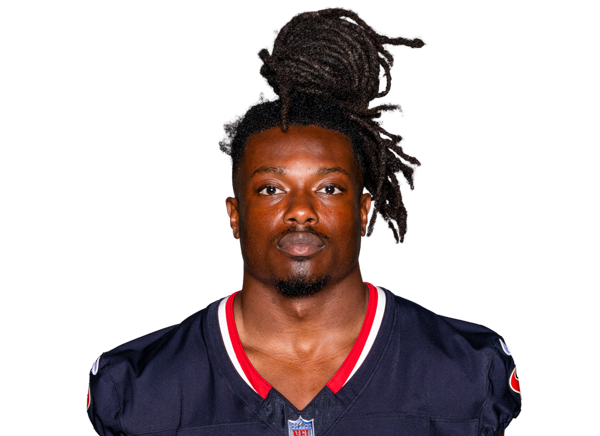 Noah Whittington#6 | 13 | 31 | 2.4 | 0 | 9 |
 Dierre Hill Jr.#23 | 5 | 13 | 2.6 | 0 | 6 |
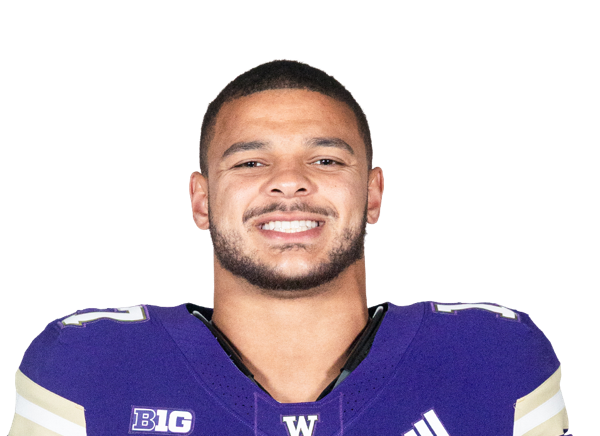 Jayden Limar#27 | 3 | 3 | 1.0 | 0 | 2 |
| Dante Moore#5 | 10 | -12 | -1.2 | 0 | 8 |
 Team | 1 | -13 | -13.0 | 0 | 0 |
Texas Tech| Player | CAR | YDS | AVG | TD | LONG |
|---|---|---|---|---|---|
| J'Koby Williams#20 | 13 | 81 | 6.2 | 0 | 50 |
 Cameron Dickey#8 | 11 | 29 | 2.6 | 0 | 9 |
| Behren Morton#2 | 6 | -32 | -5.3 | 0 | 6 |
Oregon| Player | REC | YDS | AVG | TD | LONG |
|---|---|---|---|---|---|
| Jamari Johnson#9 | 4 | 66 | 16.5 | 0 | 26 |
 Malik Benson#4 | 5 | 51 | 10.2 | 0 | 24 |
| Jayden Limar#27 | 1 | 27 | 27.0 | 0 | 27 |
 Kenyon Sadiq#18 | 4 | 22 | 5.5 | 0 | 11 |
 Dakorien Moore#1 | 3 | 21 | 7.0 | 0 | 13 |
| Jordon Davison | 1 | 14 | 14.0 | 0 | 14 |
 Jeremiah McClellan#11 | 2 | 13 | 6.5 | 0 | 11 |
| Teitum Tuioti#44 | 1 | 11 | 11.0 | 0 | 11 |
| Noah Whittington#6 | 2 | 10 | 5.0 | 0 | 6 |
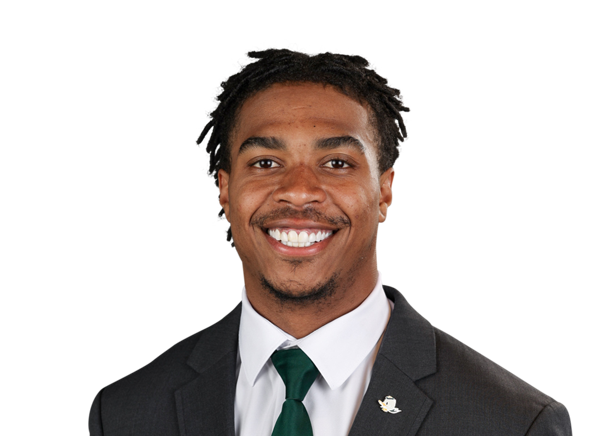 Gary Bryant Jr.#2 | 1 | 7 | 7.0 | 0 | 7 |
| Dierre Hill Jr.#23 | 3 | 3 | 1.0 | 0 | 4 |
Texas Tech| Player | REC | YDS | AVG | TD | LONG |
|---|---|---|---|---|---|
| Terrance Carter Jr.#7 | 9 | 72 | 8.0 | 0 | 24 |
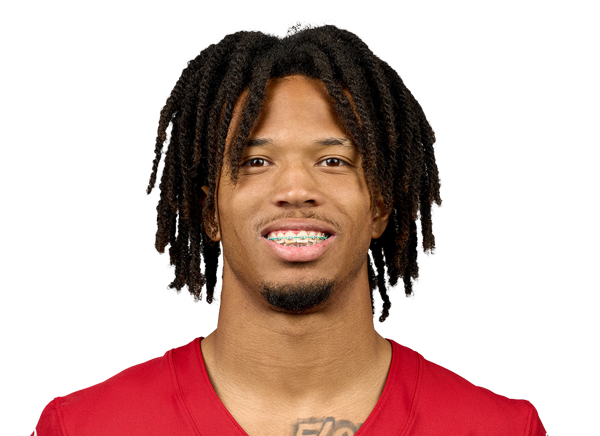 Reggie Virgil#1 | 2 | 29 | 14.5 | 0 | 24 |
| J'Koby Williams#20 | 5 | 17 | 3.4 | 0 | 6 |
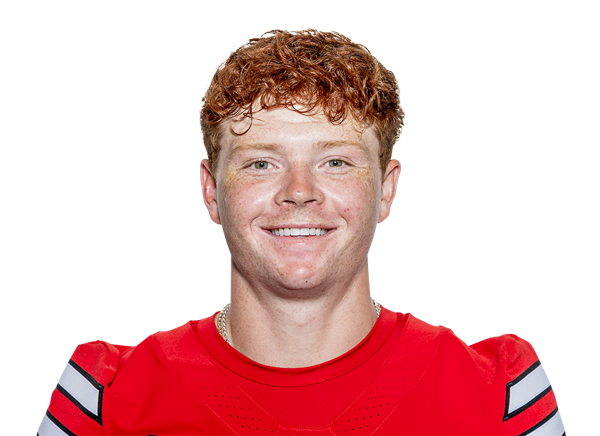 Coy Eakin#3 | 1 | 11 | 11.0 | 0 | 11 |
| Cameron Dickey#8 | 1 | 8 | 8.0 | 0 | 8 |
Oregon| Player | TOT | SOLO | SACKS | TFL | PD | QB HUR | TD |
|---|---|---|---|---|---|---|---|
| Dillon Thieneman#31 | 12 | 6 | 0 | 1 | 0 | 0 | 0 |
 Bryce Boettcher#28 | 12 | 6 | 0 | 0 | 0 | 0 | 0 |
| Teitum Tuioti#44 | 6 | 6 | 2 | 2 | 0 | 0 | 0 |
 Brandon Finney Jr.#4 | 6 | 4 | 0 | 0 | 0 | 0 | 0 |
 Jerry Mixon#54 | 4 | 4 | 0 | 1 | 2 | 0 | 0 |
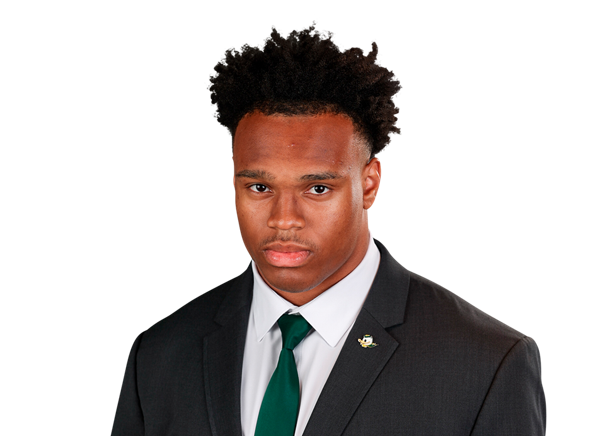 Devon Jackson#26 | 4 | 1 | 0 | 0 | 0 | 0 | 0 |
 Aaron Flowers#21 | 3 | 3 | 0 | 0 | 1 | 0 | 0 |
 Blake Purchase#9 | 2 | 2 | 1 | 1 | 0 | 0 | 0 |
 Matayo Uiagalelei#10 | 2 | 1 | 1 | 1 | 0 | 0 | 0 |
 Jadon Canady#22 | 2 | 1 | 0 | 1 | 0 | 0 | 0 |
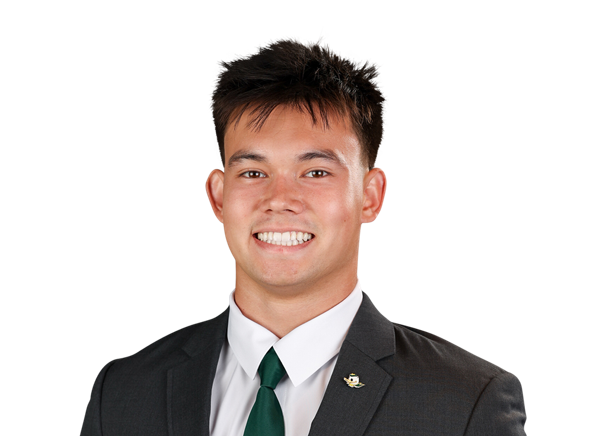 Will Straton#38 | 1 | 1 | 0 | 0 | 0 | 0 | 0 |
 Theran Johnson#5 | 1 | 0 | 0 | 0 | 0 | 0 | 0 |
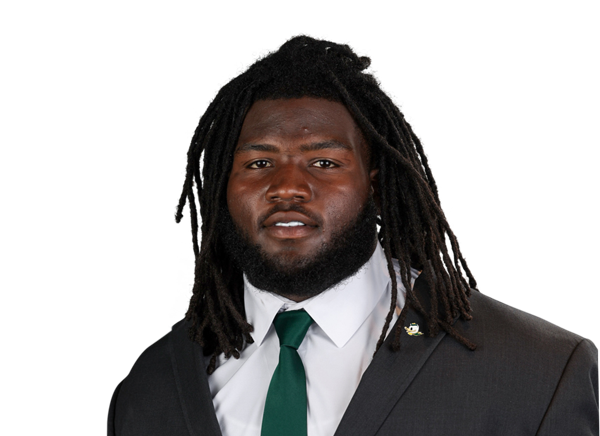 Bear Alexander#1 | 1 | 0 | 0 | 0 | 0 | 1 | 0 |
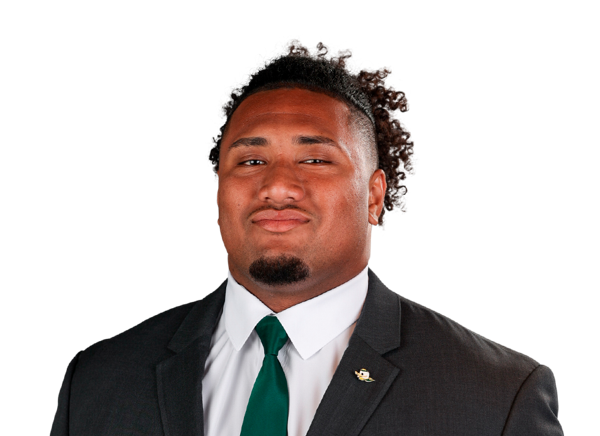 Iapani Laloulu#72 | 1 | 0 | 0 | 0 | 0 | 0 | 0 |
| Jamari Johnson#9 | 1 | 0 | 0 | 0 | 0 | 0 | 0 |
 Terrance Green#99 | 1 | 0 | 0 | 0 | 0 | 0 | 0 |
 A'Mauri Washington#52 | 0 | 0 | 0 | 0 | 1 | 0 | 0 |
Texas Tech| Player | TOT | SOLO | SACKS | TFL | PD | QB HUR | TD |
|---|---|---|---|---|---|---|---|
| Ben Roberts#13 | 16 | 8 | 0 | 1 | 0 | 0 | 0 |
 Jacob Rodriguez#10 | 11 | 2 | 0 | 0 | 0 | 0 | 0 |
 Brenden Jordan#7 | 9 | 7 | 0 | 1 | 0 | 0 | 0 |
 David Bailey#31 | 9 | 5 | 1 | 2 | 2 | 0 | 0 |
 Lee Hunter#2 | 7 | 5 | 0 | 2 | 0 | 0 | 0 |
 Amier Boyd#27 | 7 | 3 | 0 | 1 | 1 | 0 | 0 |
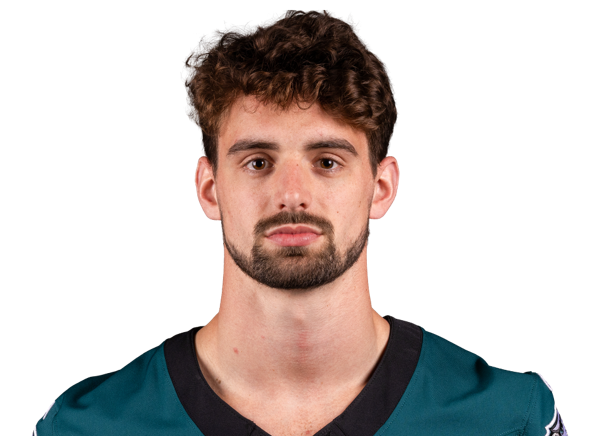 Cole Wisniewski#5 | 6 | 4 | 0 | 1 | 0 | 0 | 0 |
| Romello Height#9 | 5 | 3 | 1 | 1 | 0 | 0 | 0 |
 John Curry#6 | 5 | 2 | 0 | 0 | 0 | 0 | 0 |
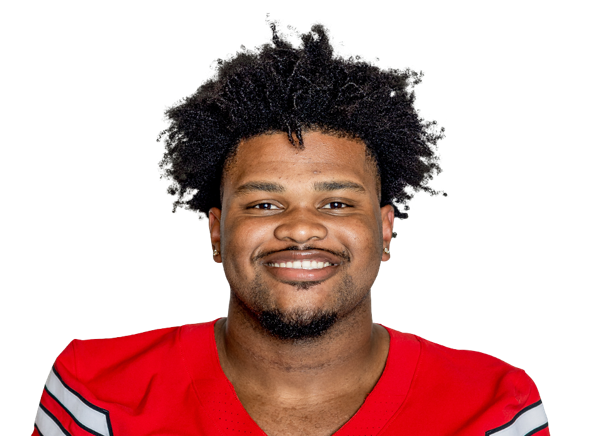 A.J. Holmes Jr.#33 | 3 | 2 | 0 | 0 | 0 | 0 | 0 |
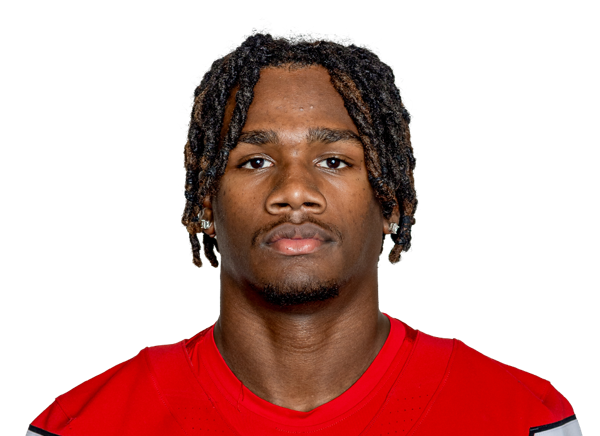 Brice Pollock#14 | 2 | 2 | 0 | 0 | 1 | 0 | 0 |
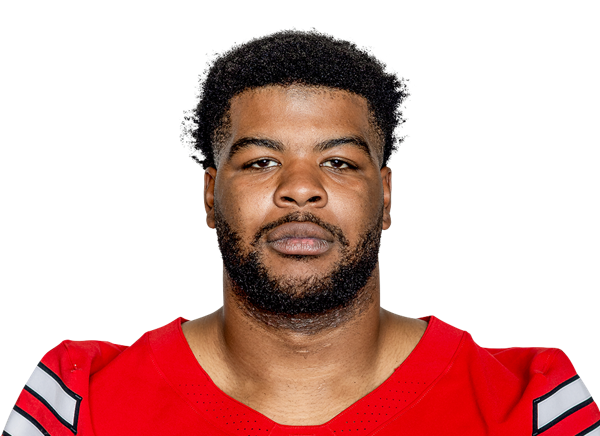 E'Maurion Banks#8 | 1 | 1 | 0 | 0 | 0 | 0 | 0 |
| Behren Morton#2 | 1 | 1 | 0 | 0 | 0 | 0 | 0 |
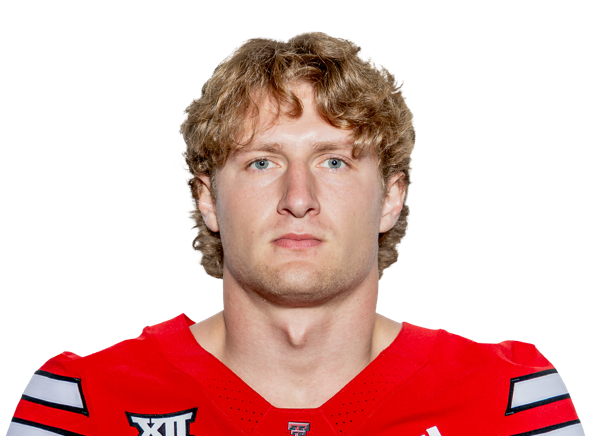 Luke Dillingham#39 | 1 | 1 | 0 | 0 | 0 | 0 | 0 |
 Terrell Tilmon#18 | 1 | 0 | 0 | 0 | 0 | 0 | 0 |
Oregon| Player | FUM | LOST | REC |
|---|---|---|---|
| Team | 1 | 0 | 0 |
| Dante Moore#5 | 1 | 0 | 0 |
| Matayo Uiagalelei#10 | 1 | 0 | 1 |
| Brandon Finney Jr.#4 | 0 | 0 | 1 |
Texas Tech| Player | FUM | LOST | REC |
|---|---|---|---|
| Behren Morton#2 | 1 | 1 | 0 |
| Cameron Dickey#8 | 1 | 1 | 0 |
Oregon| Player | FG | PCT | LONG | XP | PTS |
|---|---|---|---|---|---|
 Atticus Sappington#36 | 3/4 | 75.0 | 50 | 2/2 | 11 |
Texas Tech| Player | FG | PCT | LONG | XP | PTS |
|---|---|---|---|---|---|
 Stone Harrington#48 | 0/1 | 0.0 | 0 | 0/0 | 0 |
Oregon| Player | NO | YDS | AVG | TB | In 20 | LONG |
|---|---|---|---|---|---|---|
| James Ferguson-Reynolds#46 | 2 | 72 | 36.0 | 0 | 1 | 39 |
Texas Tech| Player | NO | YDS | AVG | TB | In 20 | LONG |
|---|---|---|---|---|---|---|
 Jack Burgess#41 | 4 | 178 | 44.5 | 0 | 0 | 50 |
Texas Tech| Player | NO | YDS | AVG | LONG | TD |
|---|---|---|---|---|---|
| J'Koby Williams#20 | 2 | 35 | 17.5 | 19 | 0 |
Oregon| Player | NO | YDS | AVG | LONG | TD |
|---|---|---|---|---|---|
| Malik Benson#4 | 1 | 28 | 28.0 | 28 | 0 |
Oregon| Player | INT | YDS | TD |
|---|---|---|---|
| Brandon Finney Jr.#4 | 2 | 2 | 0 |
Texas Tech| Player | INT | YDS | TD |
|---|---|---|---|
| Ben Roberts#13 | 1 | 8 | 0 |
Drive Summary
ORE
Field Goal
43
TTU
Punt
8
ORE
Downs
47
TTU
Punt
-10
ORE
Punt
4
TTU
Interception
3
ORE
Punt
-10
TTU
Missed FG
54
ORE
Downs
62
TTU
Fumble
27
ORE
Field Goal
9
TTU
Punt
6
ORE
End Of Half
19
TTU
Punt
2
ORE
Downs
9
TTU
Fumble
-26
ORE
Touchdown
6
TTU
Downs
57
ORE
Interception
19
TTU
Interception
46
ORE
Field Goal
55
TTU
Downs
0
ORE
Missed FG
7
TTU
Downs
8
ORE
Touchdown
27
TTU
End of Game
9
Injury Report
No current injury report is available for this matchup.
Head-to-Head
Historical meetings are not available for this matchup.
Game Information
EventCollege Football Playoff Quarterfinal at the Capital One Orange Bowl
StagePostseason Week 1
Season2025
KickoffThu, Jan 1, 12:00 pm
VenueHard Rock Stadium
LocationMiami Gardens, FL
SurfaceGrass
SiteNeutral Site
BroadcastESPN, ERADM
Attendance65,021
Division Standings
FBS — Big Ten Conference
| Team | W | L | T | Pct | PF | PA | Home | Away | Strk |
|---|---|---|---|---|---|---|---|---|---|
 Illinois | 0 | 0 | 0 | .000 | 0 | 0 | — | — | — |
 Indiana | 3 | 0 | 0 | 1.000 | 121 | 46 | 3-0 | 0-0 | W3 |
 Iowa | 0 | 0 | 0 | .000 | 0 | 0 | — | — | — |
 Maryland | 0 | 0 | 0 | .000 | 0 | 0 | — | — | — |
 Michigan State | 0 | 0 | 0 | .000 | 0 | 0 | — | — | — |
 Michigan | 0 | 0 | 0 | .000 | 0 | 0 | — | — | — |
 Minnesota | 0 | 0 | 0 | .000 | 0 | 0 | — | — | — |
 Nebraska | 0 | 0 | 0 | .000 | 0 | 0 | — | — | — |
 Northwestern | 0 | 0 | 0 | .000 | 0 | 0 | — | — | — |
 Ohio State | 0 | 0 | 0 | .000 | 0 | 0 | — | — | — |
| Oregon | 1 | 1 | 0 | 0.500 | 45 | 56 | 0-0 | 1-1 | L1 |
 Penn State | 0 | 0 | 0 | .000 | 0 | 0 | — | — | — |
 Purdue | 0 | 0 | 0 | .000 | 0 | 0 | — | — | — |
 Rutgers | 0 | 0 | 0 | .000 | 0 | 0 | — | — | — |
 UCLA | 0 | 0 | 0 | .000 | 0 | 0 | — | — | — |
 USC | 0 | 0 | 0 | .000 | 0 | 0 | — | — | — |
 Washington | 0 | 0 | 0 | .000 | 0 | 0 | — | — | — |
 Wisconsin | 0 | 0 | 0 | .000 | 0 | 0 | — | — | — |
FBS — Big 12 Conference
| Team | W | L | T | Pct | PF | PA | Home | Away | Strk |
|---|---|---|---|---|---|---|---|---|---|
 Arizona State | 0 | 0 | 0 | .000 | 0 | 0 | — | — | — |
 Arizona | 0 | 1 | 0 | 0.000 | 19 | 24 | 0-0 | 0-1 | L1 |
 BYU | 0 | 0 | 0 | .000 | 0 | 0 | — | — | — |
 Baylor | 0 | 0 | 0 | .000 | 0 | 0 | — | — | — |
 Cincinnati | 0 | 1 | 0 | 0.000 | 13 | 35 | 0-1 | 0-0 | L1 |
 Colorado | 0 | 0 | 0 | .000 | 0 | 0 | — | — | — |
 Houston | 0 | 0 | 0 | .000 | 0 | 0 | — | — | — |
 Iowa State | 0 | 0 | 0 | .000 | 0 | 0 | — | — | — |
 Kansas | 0 | 0 | 0 | .000 | 0 | 0 | — | — | — |
 Kansas State | 0 | 0 | 0 | .000 | 0 | 0 | — | — | — |
 Oklahoma State | 0 | 0 | 0 | .000 | 0 | 0 | — | — | — |
 TCU | 0 | 0 | 0 | .000 | 0 | 0 | — | — | — |
| Texas Tech | 0 | 1 | 0 | 0.000 | 0 | 23 | 0-1 | 0-0 | L1 |
 UCF | 0 | 0 | 0 | .000 | 0 | 0 | — | — | — |
 Utah | 0 | 0 | 0 | .000 | 0 | 0 | — | — | — |
 West Virginia | 0 | 0 | 0 | .000 | 0 | 0 | — | — | — |
Oregon
8th in Big Ten
VS
Texas Tech
2nd in Big 12
Quarterbacks & Specialists
#5
Dante Moore
Offensive Line
#72
Iapani Laloulu
Receivers & Backs
Jordon Davison
#6
Dierre Hill Jr.
#9
Jamari Johnson
#3
Jeremiah McClellan
#1
Dakorien Moore
Defensive Line & Linebackers
#1
Bear Alexander
#9
Devon Jackson
#6
Jerry Mixon
#38
Will Straton
#44
Teitum Tuioti
#10
Matayo Uiagalelei
#52
A'Mauri Washington
Defensive Backs
#4
Brandon Finney Jr.
#21
Aaron Flowers
Receivers & Backs
#7
Terrance Carter Jr.
#8
Cameron Dickey
#3
Coy Eakin
#20
J'Koby Williams
Defensive Line & Linebackers
#6
John Curry
#10
A.J. Holmes Jr.
#13
Ben Roberts
Defensive Backs
#27
Amier Boyd
#7
Brenden Jordan
#14
Brice Pollock
Other
#48
Stone Harrington
Oregon
5th in Big Ten
VS
Texas Tech
2nd in Big 12
Passing
65.5
Completion Percentage
64.8
190
Completions
153
1.00
Interception Percentage
3.00
3
Interceptions
7
75
Longest Pass
64
2,280
Net Passing Yards
1,750
285.0
Net Passing Yards Per Game
218.8
290
Passing Attempts
236
6.60
Passing Touchdown %
4.20
19
Passing Touchdowns
10
151.5
Passer Rating
134.9
11
Total Sacks
13
67
Sack Yards Lost
93
7.9
Yards Per Pass Attempt
7.4
2,280
Passing Yards
1,750
0
Passing Fumbles Lost
0
8
Team Games Played
8
425.4
Yards Per Game
425.8
33.3
Total Points Per Game
35.6
266
Total Points
285
33
Total Touchdowns
34
285.0
Passing Yards Per Game
218.8
190-290
Comp-Att
153-236
11-67
Sacks-Yards Lost
13-93
Rushing
264
Rushing Attempts
313
1,123
Rushing Yards
1,656
4.3
Yards Per Rush Attempt
5.3
45
Long Rushing
64
0
20+ Yard Rushing Plays
0
13
Rushing Touchdowns
19
140.4
Rushing Yards Per Game
207.0
0
Rushing Fumbles
0
0
Rushing Fumbles Lost
0
59
Rushing 1st downs
84
8
Team Games Played
8
3,403
Total Yards
3,406
565
Total Offensive Plays
562
33.3
Total Points Per Game
35.6
266
Total Points
285
33
Total Touchdowns
34
Receiving
190
Receptions
153
0
Receiving Targets
0
2,280
Receiving Yards
1,750
2,280
Receiving Yards
1,750
19
Receiving Touchdowns
10
75
Long Reception
64
0
20+ Yard Receiving Plays
0
285.0
Receiving Yards Per Game
218.8
0
Receiving Fumbles
0
0
Receiving Fumbles Lost
0
1092
Receiving Yards After Catch
693
91
Receiving First Downs
78
8
Team Games Played
8
12.0
Yards Per Reception
11.4
33.3
Total Points Per Game
35.6
266
Total Points
285
33
Total Touchdowns
34
Miscellaneous
161
Total 1st downs
176
59
Rushing 1st downs
84
91
Passing 1st downs
78
11
1st downs by penalty
14
40
Third Down Conversions
39
111
Third Down Attempts
102
36.04
3rd down %
38.24
10
Fourth Down Conversions
9
18
First Downs Attempts
14
55.56
4th down %
64.29
44
Total Penalties
51
386
Total Penalty Yards
451
13541
Possession Time Seconds
13532
0.00
Red Zone Field Goal Percentage
0.00
0.00
Red Zone Scoring Percentage
0.00
0.00
Red Zone Efficiency Percentage
0.00
0.00
Red Zone Touchdown Percentage
0.00
7
Total Takeaways
11
13
Total Giveaways
13
-6
Turnover Ratio
-2
0
Fumbles Lost
0
40-111
3rd down efficiency
39-102
10-18
4th down efficiency
9-14
44-386
Total-Yards
51-451
Defense
249
Solo Tackles
302
262
Assist Tackles
208
511
Total Tackles
510
19
Sacks
26
141
Sack Yards
164
61
Stuffs
67
44
Passes Defended
32
12.9
Average Interception Yards
13.6
96
Long Interception
53
0
Miscellaneous Touchdowns
0
1
Kicks Blocked
1
31
Tackles For Loss
42
8
Team Games Played
8
Defensive Interceptions
9
Interceptions
13
116
Interception Yards
177
1
Interception Touchdowns
5
9-116
INT: Total
13-177
General
13
Fumbles
14
2
Forced Fumbles
5
4
Fumbles Recovered
4
0
Fumbles Touchdowns
0
8
Games Played
8
13-0
Fumbles-Lost
14-0
Returning
10
Kick Returns
16
191
Kick Return Yards
394
19.1
Yards Per Kick Return
24.6
54
Long Kick Return
53
0
Kick Return Touchdowns
0
13
Punt Returns
18
103
Punt Return Yards
172
7.9
Yards Per Punt Return
9.6
15
Long Punt Return
34
0
Punt Return Touchdowns
0
0
Punt Return Fair Catches
0
0
Kick Return Fumbles Lost
0
0
Punt Return Fumbles Lost
0
8
Team Games Played
8
13-103
Punt: Total
18-172
Kicking
12
Field Goal Made
17
15
Field Goal Attempts
21
80.0
Field Goal Percentage
81.0
44
Long Field Goal Made
52
1
Field Goal Attempts 1-19
0
4
Field Goal Attempts 20-29
4
4
Field Goal Attempts 30-39
8
4
Field Goal Attempts 40-49
6
2
Field Goal Attempts 50+
3
30
Extra Points Made
30
30
Extra Point Attempts
31
100.0
Extra Point Percentage
96.8
1
Field Goals Made 1-19
0
4
Field Goals Made 20-29
4
4
Field Goals Made 30-39
6
3
Field Goals Made 40-49
6
0
Field Goals Made 50+
1
66
Total Kicking Points
81
8
Team Games Played
8
58
Touchback Percentage
79
0.0
Average Kickoff Return Yards
0.0
0
Kickoff Return Yards
0
0
Kickoff Returns
0
0-0
Kickoffs: Total
0-0
12-15
FG: Good-Attempts
17-21
Punting
32
Punts
27
1,484
Punt Yards
1,271
67
Long Punt
67
46.4
Gross Average Punt Yards
47.1
46.4
Net Average Punt Yards
47.1
0
Punts Blocked
0
12
Punts Inside 20
15
1
Touchbacks
1
14
Fair Catches
9
7
Punt Returns
3
0
Punt Return Yards
0
0.0
Average Punt Return Yards
0.0
8
Team Games Played
8
32-1,484
Punt: Total Yards
27-1,271
Scoring
13
Rushing Touchdowns
19
19
Receiving Touchdowns
10
0
Return Touchdowns
0
32
Total Touchdowns
29
12
Field Goals
17
30
Kick Extra Points
30
1
Total Two Point Conversions
0
266
Total Points
285
33.3
Total Points Per Game
35.6