

Rutgers vs Boston College Live Score (11 Sep, 2026)
Score by Quarter
| Team | Q1 | Q2 | Q3 | Q4 | Final |
|---|---|---|---|---|---|
 Rutgers |
0 | 7 | 7 | 7 | 21 |
 Boston College |
14 | 6 | 0 | 8 | 28 |
Scoring Plays
Q1
10:42
10:42
Evan Dickens 19 Yd Run (Luca Lombardo Kick)
Rushing Touchdown
0 – 7
Q1
5:15
5:15
Mason McKenzie 10 Yd Run (Luca Lombardo Kick)
Rushing Touchdown
0 – 14
Q2
13:33
13:33
Luca Lombardo 30 Yd Field Goal
Field Goal Good
0 – 17
Q2
1:55
1:55
Antwan Raymond 4 Yd pass from AJ Surace (Dane Pizzaro Kick)
Passing Touchdown
7 – 17
Q2
0:00
0:00
Luca Lombardo 46 Yd Field Goal
Field Goal Good
7 – 20
Q3
2:37
2:37
KJ Duff 4 Yd pass from AJ Surace (Dane Pizzaro Kick)
Passing Touchdown
14 – 20
Q4
7:06
7:06
Dawson Pough 78 Yd pass from Mason McKenzie (Mason McKenzie Pass to Johnathan Montague Jr. for Two-Point Conversion)
Passing Touchdown
14 – 28
Q4
6:18
6:18
KJ Duff 60 Yd pass from AJ Surace (Dane Pizzaro Kick)
Passing Touchdown
21 – 28
Game Leaders
RutgersBoston College
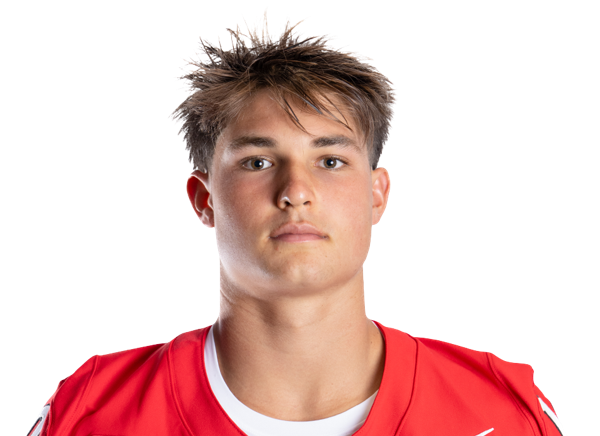 A. Surace QB
Passing Yards
 M. McKenzie QB
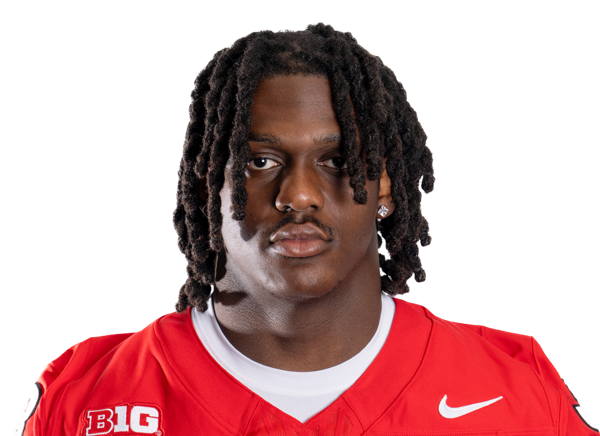 A. Raymond RB
Rushing Yards
M. McKenzie QB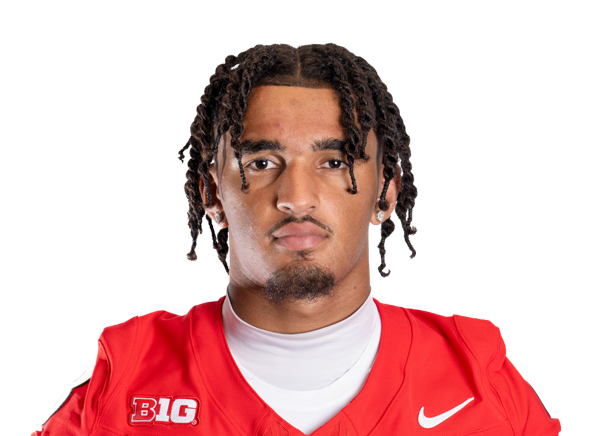 K. Duff WR
Receiving Yards
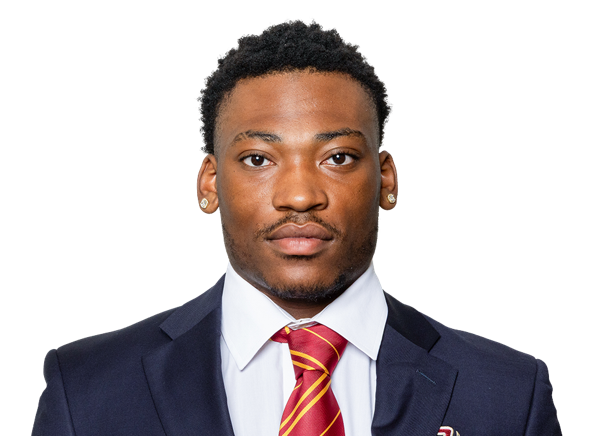 D. Pough WR
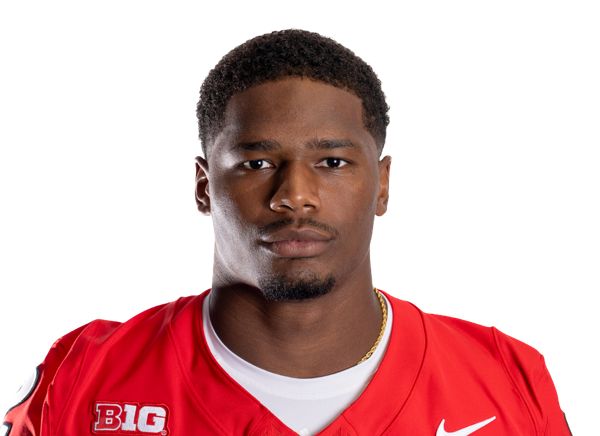 M. Walker LB
Sacks
 C. Hudson DL
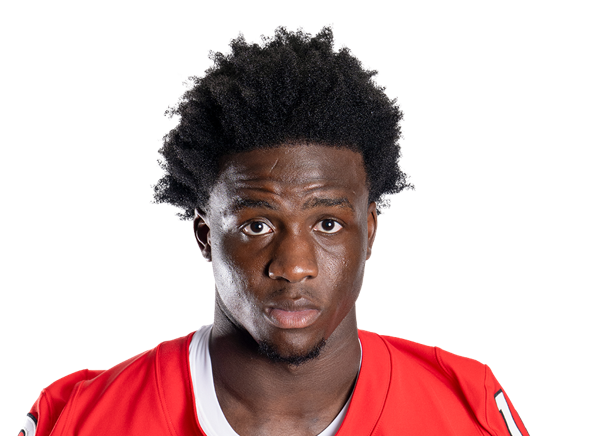 J. Ofurie DB
Tackles
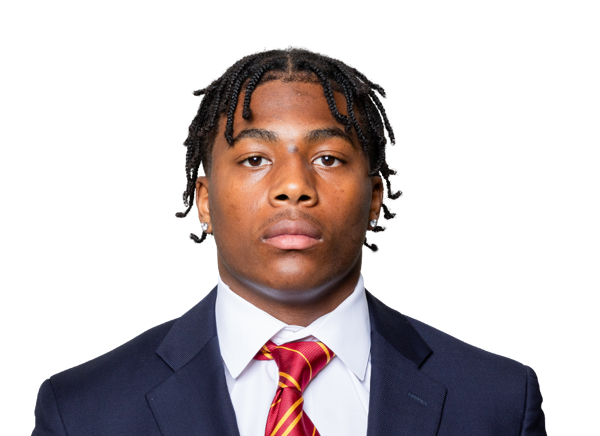 M. Upton DB
Player Box Score
Rutgers| Player | C/ATT | YDS | AVG | TD | INT | QBR |
|---|---|---|---|---|---|---|
| AJ Surace#10 | 18/27 | 230 | 8.5 | 3 | 4 | 22.9 |
Boston College| Player | C/ATT | YDS | AVG | TD | INT | QBR |
|---|---|---|---|---|---|---|
| Mason McKenzie#10 | 18/29 | 252 | 8.7 | 1 | 2 | 55.4 |
Rutgers| Player | CAR | YDS | AVG | TD | LONG |
|---|---|---|---|---|---|
| Antwan Raymond#3 | 27 | 134 | 5.0 | 0 | 22 |
 Clay Thevenin#9 | 7 | 36 | 5.1 | 0 | 11 |
| AJ Surace#10 | 7 | -16 | -2.3 | 0 | 4 |
Boston College| Player | CAR | YDS | AVG | TD | LONG |
|---|---|---|---|---|---|
| Mason McKenzie#10 | 13 | 94 | 7.2 | 1 | 19 |
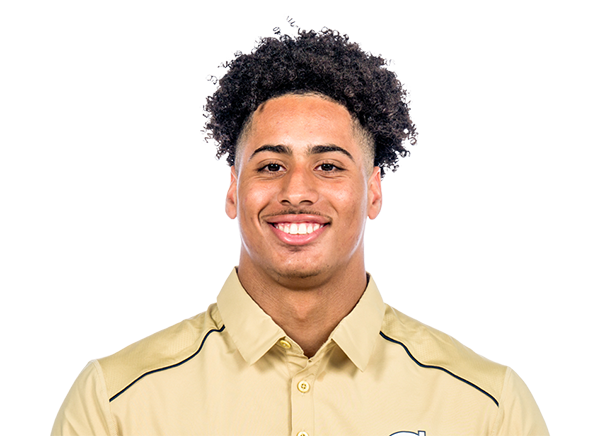 Evan Dickens#23 | 13 | 56 | 4.3 | 1 | 19 |
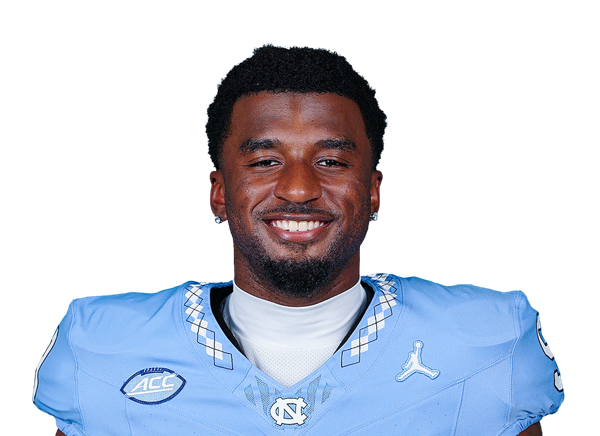 Javarius Green#4 | 2 | 8 | 4.0 | 0 | 4 |
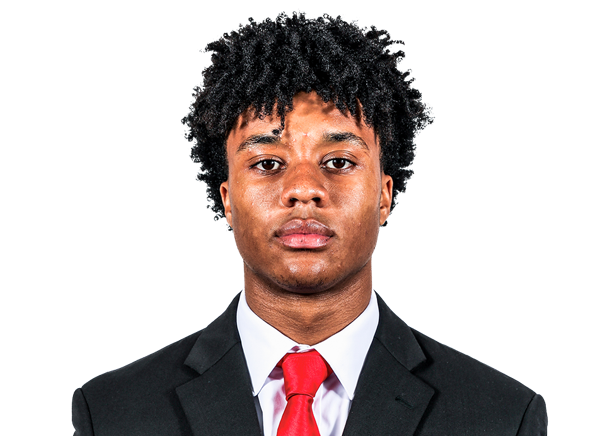 Nolan Ray#2 | 1 | 1 | 1.0 | 0 | 1 |
| Team | 3 | -9 | -3.0 | 0 | 0 |
Rutgers| Player | REC | YDS | AVG | TD | LONG |
|---|---|---|---|---|---|
| KJ Duff#8 | 8 | 137 | 17.1 | 2 | 60 |
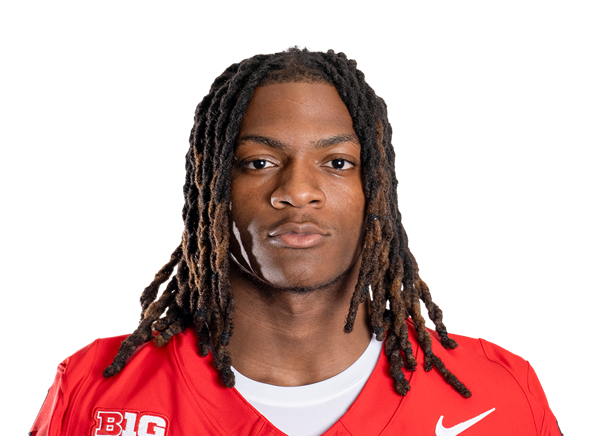 Jourdin Houston#4 | 5 | 40 | 8.0 | 0 | 14 |
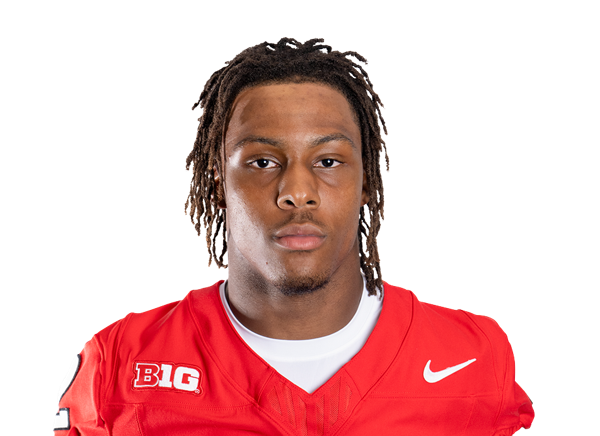 Ben Black III#2 | 2 | 30 | 15.0 | 0 | 20 |
| Antwan Raymond#3 | 2 | 18 | 9.0 | 1 | 14 |
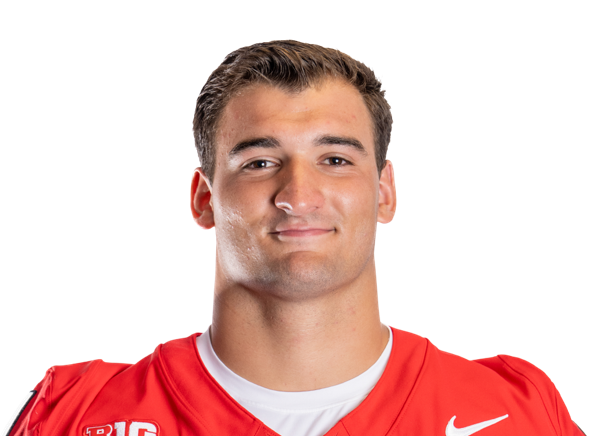 Logan Blake#11 | 1 | 5 | 5.0 | 0 | 5 |
Boston College| Player | REC | YDS | AVG | TD | LONG |
|---|---|---|---|---|---|
| Dawson Pough#3 | 4 | 106 | 26.5 | 1 | 78 |
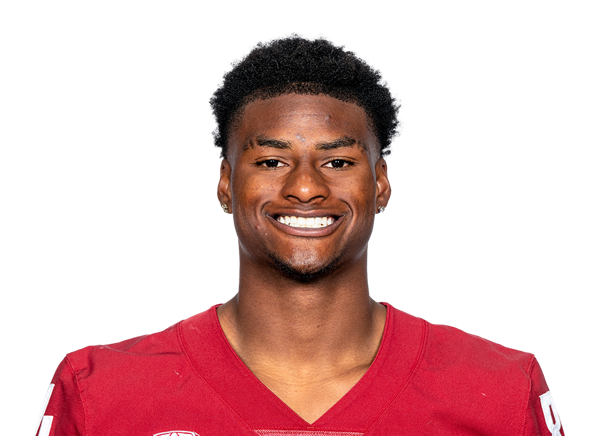 Landon Wright#9 | 2 | 60 | 30.0 | 0 | 53 |
| Evan Dickens#23 | 5 | 24 | 4.8 | 0 | 8 |
| Javarius Green#4 | 3 | 21 | 7.0 | 0 | 8 |
 Brady Clough#84 | 2 | 19 | 9.5 | 0 | 16 |
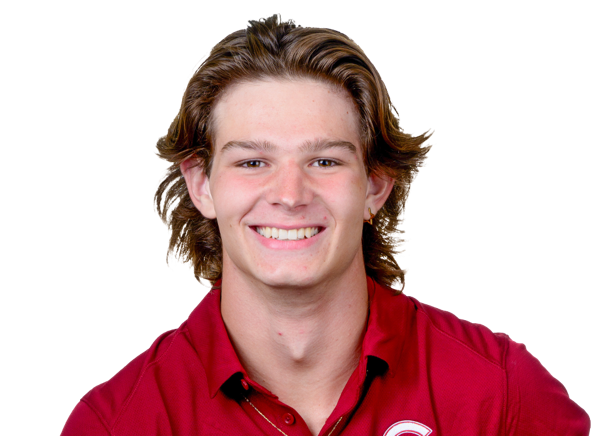 Reed Swanson#80 | 1 | 18 | 18.0 | 0 | 18 |
| Nolan Ray#2 | 1 | 4 | 4.0 | 0 | 4 |
Rutgers| Player | TOT | SOLO | SACKS | TFL | PD | QB HUR | TD |
|---|---|---|---|---|---|---|---|
| Jesse Ofurie#16 | 6 | 3 | 0 | 0 | 0 | 0 | 0 |
 Chris Joines#20 | 5 | 5 | 0 | 0 | 0 | 0 | 0 |
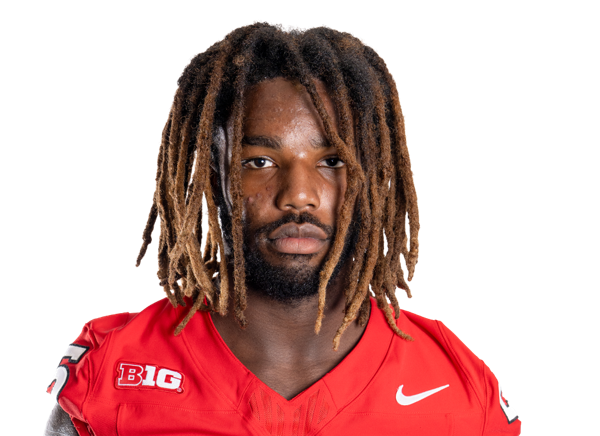 DK Gilley#9 | 5 | 3 | 0 | 0 | 0 | 0 | 0 |
 Bradlee Jones#5 | 4 | 4 | 0 | 1 | 0 | 0 | 0 |
| Moses Walker#2 | 4 | 3 | 1 | 1 | 0 | 0 | 0 |
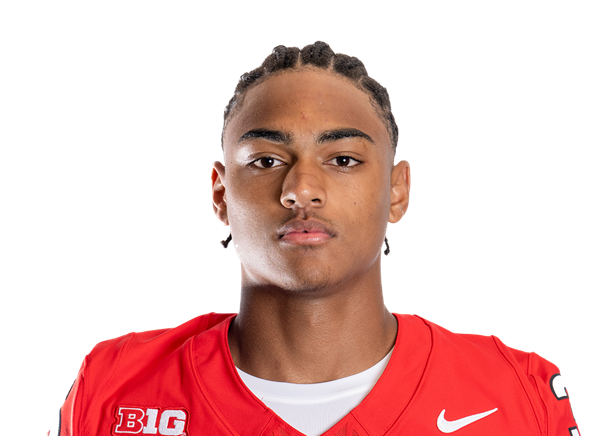 Latrell Noel#3 | 4 | 3 | 0 | 0 | 0 | 0 | 0 |
 Ty Morris#10 | 3 | 3 | 0 | 0 | 0 | 0 | 0 |
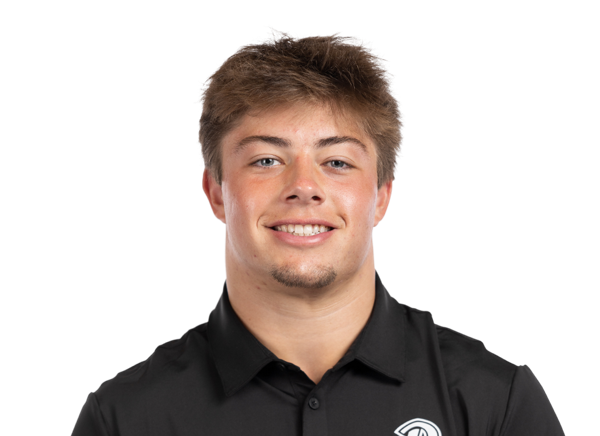 Sean Allison#41 | 2 | 2 | 0 | 0 | 0 | 0 | 0 |
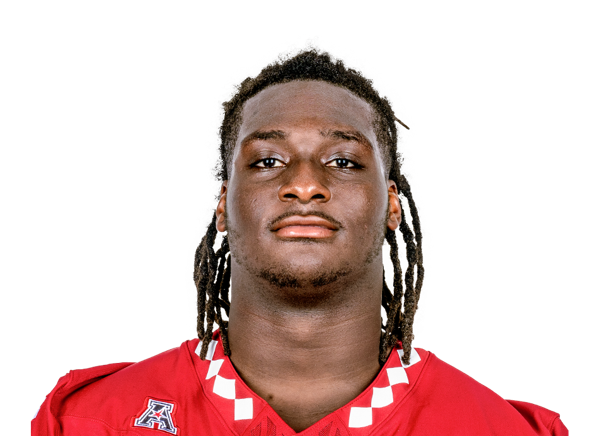 Sekou Kromah#8 | 2 | 2 | 0 | 1 | 0 | 1 | 0 |
 Kevyn Humes#4 | 2 | 1 | 0 | 0 | 1 | 0 | 0 |
 Malachi Davis#11 | 1 | 1 | 0 | 0 | 0 | 2 | 0 |
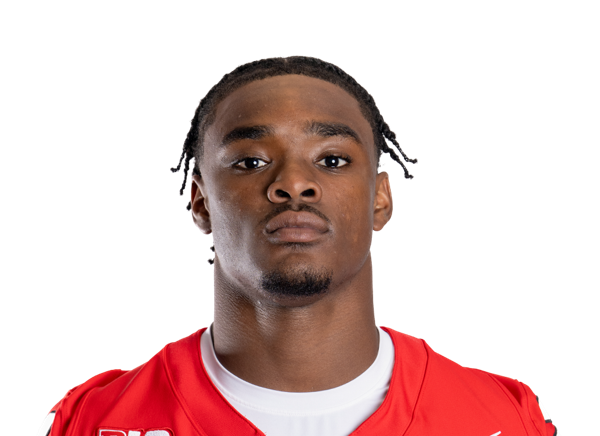 Kevin Levy#7 | 1 | 1 | 0 | 0 | 0 | 0 | 0 |
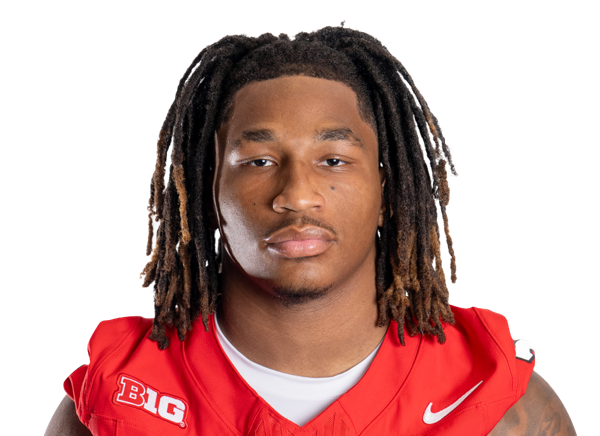 Kaj Sanders#1 | 1 | 1 | 0 | 0 | 0 | 0 | 0 |
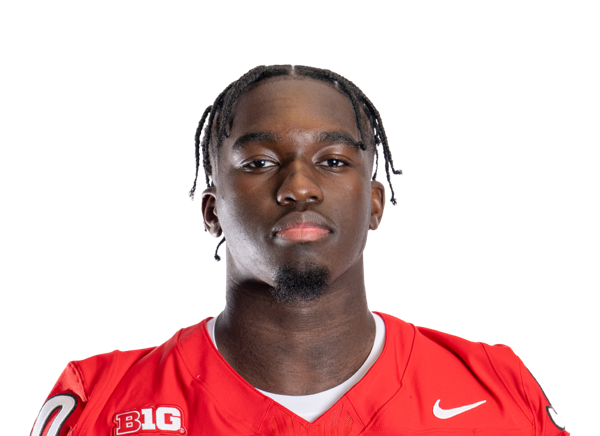 Farell Gnago#90 | 1 | 1 | 0 | 0 | 0 | 0 | 0 |
| Antwan Raymond#3 | 1 | 1 | 0 | 0 | 0 | 0 | 0 |
| Jourdin Houston#4 | 1 | 1 | 0 | 0 | 0 | 0 | 0 |
 Rondo Porter#99 | 1 | 1 | 0 | 0 | 0 | 1 | 0 |
 Mikey Munn#35 | 1 | 1 | 0 | 0 | 0 | 0 | 0 |
| Devonte Anderson#21 | 1 | 1 | 0 | 0 | 1 | 0 | 0 |
 DJ Allen#42 | 0 | 0 | 0 | 0 | 0 | 1 | 0 |
Boston College| Player | TOT | SOLO | SACKS | TFL | PD | QB HUR | TD |
|---|---|---|---|---|---|---|---|
| Marcus Upton#5 | 10 | 8 | 0 | 0 | 2 | 1 | 0 |
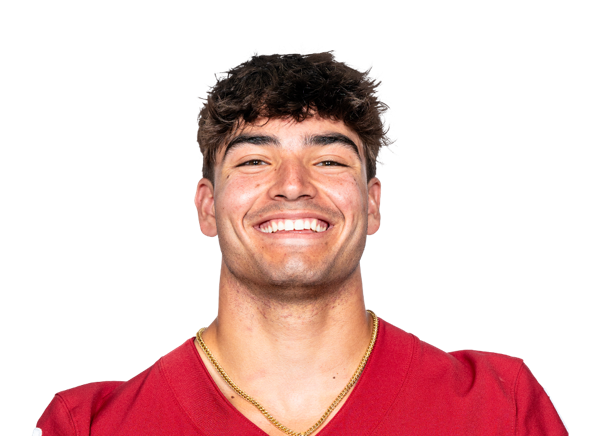 Anthony Palano#1 | 9 | 4 | 1 | 2 | 0 | 0 | 0 |
 Bodie Kahoun#36 | 6 | 5 | 0 | 0 | 0 | 0 | 0 |
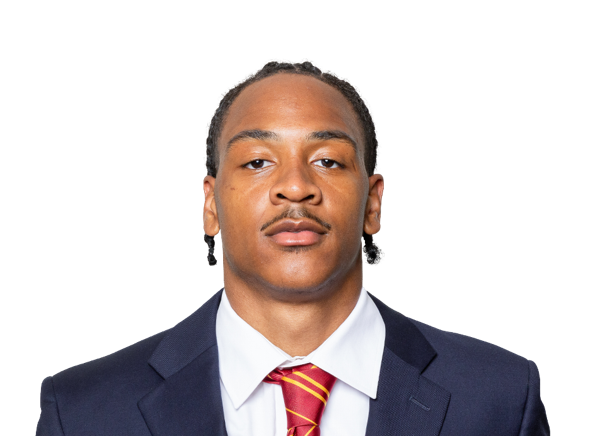 Carter Davis#7 | 6 | 4 | 0 | 0 | 0 | 0 | 0 |
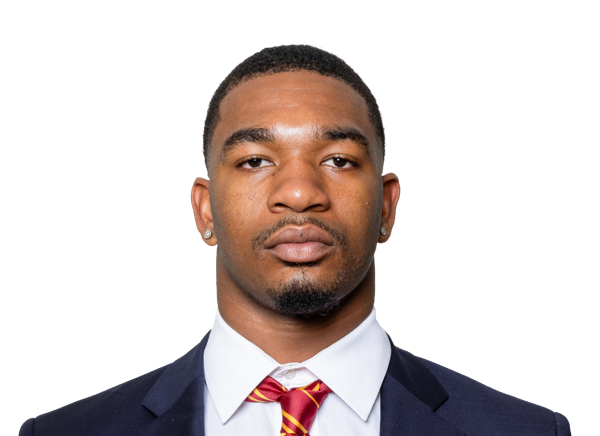 Zacari Thomas#28 | 5 | 3 | 0 | 0 | 0 | 0 | 0 |
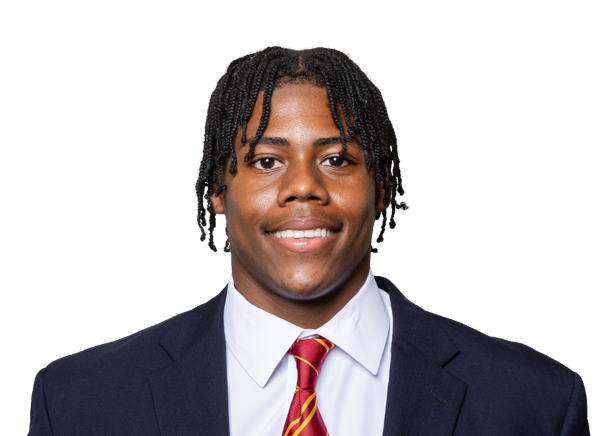 E'Lla Boykin#56 | 4 | 3 | 1 | 1 | 0 | 0 | 0 |
 Max Tucker#3 | 4 | 3 | 0 | 0 | 0 | 0 | 0 |
 KP Price#2 | 4 | 2 | 0 | 0 | 0 | 1 | 0 |
| Christian Hudson#55 | 4 | 1 | 1 | 1 | 0 | 0 | 0 |
 Kris Jones#4 | 3 | 2 | 0 | 0 | 0 | 0 | 0 |
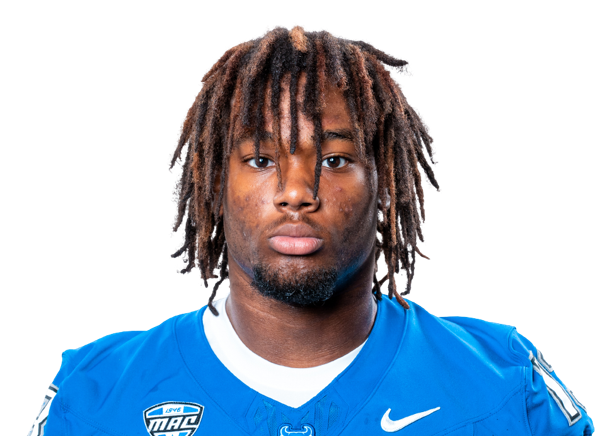 Demetrius Ballard#13 | 3 | 2 | 0 | 0 | 1 | 0 | 0 |
 Charlie Comella#32 | 2 | 1 | 0 | 0 | 0 | 0 | 0 |
 Cameron Martinez#29 | 1 | 1 | 0 | 0 | 0 | 0 | 0 |
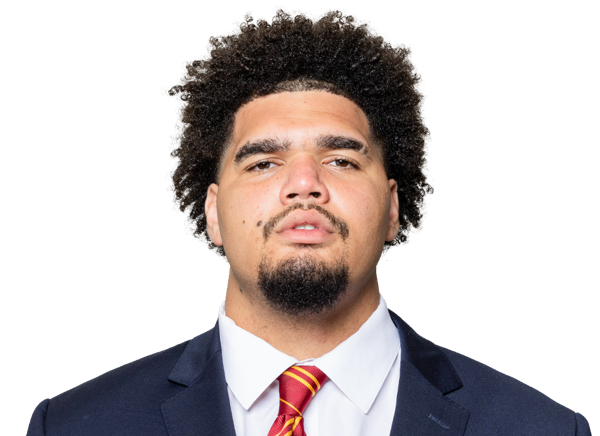 Chris Marable Jr.#6 | 1 | 1 | 0 | 0 | 0 | 0 | 0 |
| Evan Dickens#23 | 1 | 1 | 0 | 0 | 0 | 0 | 0 |
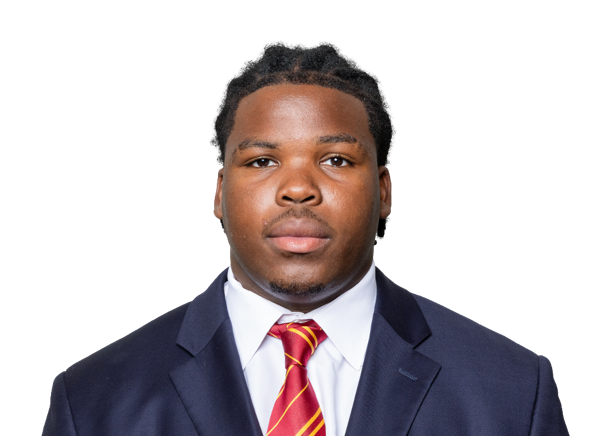 Micah Amedee#59 | 1 | 1 | 0 | 0 | 0 | 0 | 0 |
 Israel Oladipupo#98 | 1 | 1 | 0 | 0 | 0 | 1 | 0 |
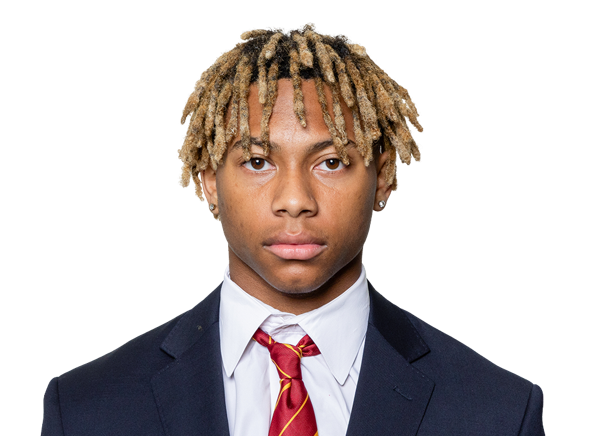 Ashton Cunningham#14 | 1 | 1 | 0 | 0 | 0 | 0 | 0 |
| Cameron McGee#88 | 1 | 1 | 0 | 1 | 0 | 0 | 0 |
Rutgers| Player | FUM | LOST | REC |
|---|---|---|---|
| Jourdin Houston#4 | 1 | 0 | 0 |
| Kevyn Humes#4 | 0 | 0 | 1 |
Boston College| Player | FUM | LOST | REC |
|---|---|---|---|
| Evan Dickens#23 | 1 | 1 | 0 |
Rutgers| Player | FG | PCT | LONG | XP | PTS |
|---|---|---|---|---|---|
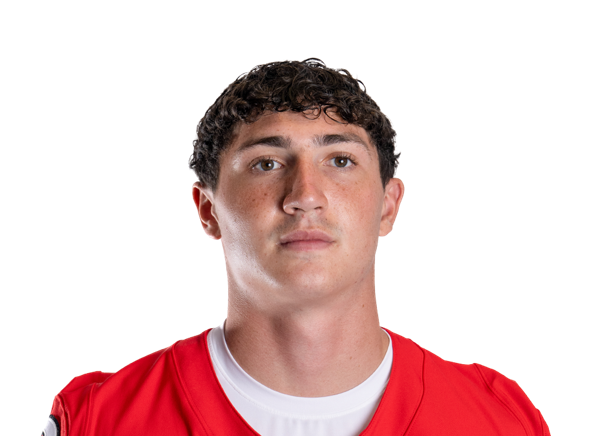 Dane Pizzaro#29 | 0/0 | 0.0 | 0 | 3/3 | 3 |
Boston College| Player | FG | PCT | LONG | XP | PTS |
|---|---|---|---|---|---|
 Luca Lombardo#99 | 2/2 | 100.0 | 46 | 2/2 | 8 |
Rutgers| Player | NO | YDS | AVG | TB | In 20 | LONG |
|---|---|---|---|---|---|---|
 Jakob Anderson#94 | 2 | 90 | 45.0 | 0 | 0 | 49 |
Boston College| Player | NO | YDS | AVG | TB | In 20 | LONG |
|---|---|---|---|---|---|---|
 Bryce LaFollette#96 | 3 | 110 | 36.7 | 0 | 0 | 46 |
Rutgers| Player | INT | YDS | TD |
|---|---|---|---|
| Moses Walker#2 | 2 | 8 | 0 |
Boston College| Player | INT | YDS | TD |
|---|---|---|---|
| Anthony Palano#1 | 2 | 6 | 0 |
| Carter Davis#7 | 1 | 4 | 0 |
| Charlie Comella#32 | 1 | 0 | 0 |
Drive Summary
RUTG
Downs
9
BC
Touchdown
34
RUTG
Interception
42
BC
Touchdown
77
RUTG
Punt
9
BC
Field Goal
63
RUTG
Punt
-5
BC
Punt
5
RUTG
Touchdown
72
BC
Field Goal
47
BC
Punt
3
RUTG
Interception
55
BC
Fumble
33
RUTG
Touchdown
52
BC
Interception
0
RUTG
Downs
7
BC
Punt
15
RUTG
Interception
33
BC
Touchdown
92
RUTG
Touchdown
75
BC
Interception
31
RUTG
Interception
15
BC
End of Game
-13
Injury Report
No current injury report is available for this matchup.
Head-to-Head
Historical meetings are not available for this matchup.
Game Information
StageWeek 2
Season2026
KickoffFri, Sep 11, 7:30 pm
VenueAlumni Stadium (Chestnut Hill, MA)
LocationChestnut Hill, MA
SurfaceArtificial Turf
BroadcastESPN2
Attendance40,611
Division Standings
FBS — Big Ten Conference
| Team | W | L | T | Pct | PF | PA | Home | Away | Strk |
|---|---|---|---|---|---|---|---|---|---|
 USC | 7 | 3 | 0 | 0.700 | 305 | 245 | 5-1 | 2-2 | L1 |
 Indiana | 9 | 1 | 0 | 0.900 | 319 | 125 | 6-1 | 3-0 | W3 |
 Iowa | 8 | 2 | 0 | 0.800 | 278 | 117 | 5-1 | 3-1 | W3 |
 Maryland | 4 | 6 | 0 | 0.400 | 273 | 303 | 2-4 | 2-2 | W2 |
 Michigan | 5 | 5 | 0 | 0.500 | 183 | 177 | 4-3 | 1-2 | L2 |
 Michigan State | 3 | 7 | 0 | 0.300 | 188 | 233 | 2-4 | 1-3 | L1 |
 Nebraska | 6 | 4 | 0 | 0.600 | 303 | 149 | 4-2 | 2-2 | W1 |
 Penn State | 6 | 4 | 0 | 0.600 | 302 | 188 | 4-2 | 2-2 | W3 |
 UCLA | 10 | 0 | 0 | 1.000 | 324 | 141 | 6-0 | 4-0 | W10 |
 Washington | 6 | 4 | 0 | 0.600 | 258 | 211 | 3-3 | 3-1 | W1 |
 Northwestern | 6 | 4 | 0 | 0.600 | 298 | 202 | 5-1 | 1-3 | L3 |
 Illinois | 6 | 4 | 0 | 0.600 | 270 | 229 | 4-2 | 2-2 | L1 |
 Minnesota | 5 | 5 | 0 | 0.500 | 236 | 240 | 4-2 | 1-3 | L3 |
 Ohio State | 7 | 3 | 0 | 0.700 | 349 | 184 | 5-1 | 2-2 | W1 |
 Oregon | 7 | 3 | 0 | 0.700 | 338 | 206 | 5-1 | 2-2 | W3 |
 Purdue | 3 | 7 | 0 | 0.300 | 272 | 319 | 2-4 | 1-3 | L4 |
 Wisconsin | 6 | 4 | 0 | 0.600 | 241 | 171 | 5-0 | 1-4 | L1 |
| Rutgers | 2 | 8 | 0 | 0.200 | 232 | 323 | 1-5 | 1-3 | L4 |
FBS — Atlantic Coast Conference
| Team | W | L | T | Pct | PF | PA | Home | Away | Strk |
|---|---|---|---|---|---|---|---|---|---|
 Miami | 9 | 1 | 0 | 0.900 | 441 | 198 | 5-0 | 4-1 | W1 |
 SMU | 7 | 3 | 0 | 0.700 | 340 | 255 | 6-1 | 1-2 | L1 |
 Virginia | 5 | 5 | 0 | 0.500 | 269 | 215 | 5-2 | 0-3 | W1 |
 California | 3 | 7 | 0 | 0.300 | 204 | 320 | 2-3 | 1-4 | L4 |
 Duke | 7 | 3 | 0 | 0.700 | 322 | 153 | 4-1 | 3-2 | L1 |
 North Carolina | 5 | 5 | 0 | 0.500 | 258 | 221 | 1-4 | 4-1 | L1 |
 Pittsburgh | 6 | 4 | 0 | 0.600 | 297 | 194 | 5-2 | 1-2 | L1 |
 Virginia Tech | 6 | 4 | 0 | 0.600 | 330 | 255 | 3-2 | 3-2 | L2 |
 Wake Forest | 9 | 1 | 0 | 0.900 | 439 | 150 | 4-1 | 5-0 | W7 |
| Boston College | 4 | 6 | 0 | 0.400 | 204 | 284 | 3-2 | 1-4 | L3 |
 Clemson | 6 | 4 | 0 | 0.600 | 210 | 206 | 3-3 | 3-1 | L1 |
 Louisville | 7 | 3 | 0 | 0.700 | 383 | 247 | 4-1 | 3-2 | W5 |
 Georgia Tech | 3 | 7 | 0 | 0.300 | 235 | 296 | 2-4 | 1-3 | W1 |
 Florida State | 5 | 5 | 0 | 0.500 | 292 | 265 | 3-2 | 2-3 | W2 |
 NC State | 4 | 6 | 0 | 0.400 | 291 | 282 | 4-3 | 0-3 | L2 |
 Stanford | 5 | 5 | 0 | 0.500 | 223 | 358 | 4-1 | 1-4 | W1 |
 Syracuse | 5 | 5 | 0 | 0.500 | 298 | 260 | 2-3 | 3-2 | W1 |
Rutgers
18th in Big Ten
VS
Boston College
14th in ACC
Quarterbacks & Specialists
#94
Jakob Anderson
#10
AJ Surace
Receivers & Backs
#2
Ben Black III
#11
Logan Blake
#8
KJ Duff
#4
Jourdin Houston
#3
Antwan Raymond
#9
Clay Thevenin
Defensive Line & Linebackers
#42
DJ Allen
#41
Sean Allison
#11
Malachi Davis
#90
Farell Gnago
#8
Sekou Kromah
#10
Ty Morris
#99
Rondo Porter
#2
Moses Walker
Defensive Backs
#21
Devonte Anderson
#9
DK Gilley
#4
Kevyn Humes
#20
Chris Joines
#5
Bradlee Jones
#7
Kevin Levy
#35
Mikey Munn
#3
Latrell Noel
#16
Jesse Ofurie
#1
Kaj Sanders
Other
#29
Dane Pizzaro
Quarterbacks & Specialists
#96
Bryce LaFollette
#10
Mason McKenzie
Receivers & Backs
#84
Brady Clough
#23
Evan Dickens
#4
Javarius Green
#3
Dawson Pough
#2
Nolan Ray
#80
Reed Swanson
#9
Landon Wright
Defensive Line & Linebackers
#59
Micah Amedee
#13
Demetrius Ballard
#56
E'Lla Boykin
#55
Christian Hudson
#4
Kris Jones
#36
Bodie Kahoun
#6
Chris Marable Jr.
#88
Cameron McGee
#98
Israel Oladipupo
#1
Anthony Palano
#28
Zacari Thomas
Defensive Backs
#32
Charlie Comella
#14
Ashton Cunningham
#7
Carter Davis
#29
Cameron Martinez
#2
KP Price
#3
Max Tucker
#5
Marcus Upton
Other
#99
Luca Lombardo
Rutgers
17th in Big Ten
VS
Boston College
12th in ACC
Passing
54.4
Completion Percentage
54.7
142
Completions
146
5.40
Interception Percentage
3.70
14
Interceptions
10
80
Longest Pass
78
2,021
Net Passing Yards
1,721
202.1
Net Passing Yards Per Game
172.1
261
Passing Attempts
267
6.90
Passing Touchdown %
3.70
18
Passing Touchdowns
10
131.0
Passer Rating
113.4
27
Total Sacks
28
149
Sack Yards Lost
188
7.7
Yards Per Pass Attempt
6.4
2,021
Passing Yards
1,721
0
Passing Fumbles Lost
0
10
Team Games Played
10
341.1
Yards Per Game
329.9
23.2
Total Points Per Game
20.4
232
Total Points
204
29
Total Touchdowns
26
202.1
Passing Yards Per Game
172.1
142-261
Comp-Att
146-267
27-149
Sacks-Yards Lost
28-188
Rushing
353
Rushing Attempts
363
1,390
Rushing Yards
1,578
3.9
Yards Per Rush Attempt
4.3
54
Long Rushing
45
0
20+ Yard Rushing Plays
0
11
Rushing Touchdowns
15
139.0
Rushing Yards Per Game
157.8
0
Rushing Fumbles
0
0
Rushing Fumbles Lost
0
78
Rushing 1st downs
90
10
Team Games Played
10
3,411
Total Yards
3,299
641
Total Offensive Plays
658
23.2
Total Points Per Game
20.4
232
Total Points
204
29
Total Touchdowns
26
Receiving
142
Receptions
146
0
Receiving Targets
0
2,021
Receiving Yards
1,721
2,021
Receiving Yards
1,721
18
Receiving Touchdowns
10
80
Long Reception
78
0
20+ Yard Receiving Plays
0
202.1
Receiving Yards Per Game
172.1
0
Receiving Fumbles
0
0
Receiving Fumbles Lost
0
684
Receiving Yards After Catch
886
88
Receiving First Downs
73
10
Team Games Played
10
14.2
Yards Per Reception
11.8
23.2
Total Points Per Game
20.4
232
Total Points
204
29
Total Touchdowns
26
Miscellaneous
182
Total 1st downs
187
78
Rushing 1st downs
90
88
Passing 1st downs
74
16
1st downs by penalty
23
45
Third Down Conversions
45
124
Third Down Attempts
129
36.29
3rd down %
34.88
16
Fourth Down Conversions
6
30
First Downs Attempts
24
53.33
4th down %
25.00
44
Total Penalties
76
353
Total Penalty Yards
640
18196
Possession Time Seconds
17727
0.00
Red Zone Field Goal Percentage
0.00
0.00
Red Zone Scoring Percentage
0.00
0.00
Red Zone Efficiency Percentage
0.00
0.00
Red Zone Touchdown Percentage
0.00
19
Total Takeaways
17
16
Total Giveaways
16
3
Turnover Ratio
1
0
Fumbles Lost
0
45-124
3rd down efficiency
45-129
16-30
4th down efficiency
6-24
44-353
Total-Yards
76-640
Defense
303
Solo Tackles
402
334
Assist Tackles
272
637
Total Tackles
674
11
Sacks
17
62
Sack Yards
118
65
Stuffs
74
26
Passes Defended
23
3.2
Average Interception Yards
8.0
8
Long Interception
47
0
Miscellaneous Touchdowns
0
0
Kicks Blocked
1
32
Tackles For Loss
50
10
Team Games Played
10
Defensive Interceptions
5
Interceptions
13
16
Interception Yards
104
0
Interception Touchdowns
1
5-16
INT: Total
13-104
General
5
Fumbles
14
3
Forced Fumbles
7
5
Fumbles Recovered
7
0
Fumbles Touchdowns
0
10
Games Played
10
5-0
Fumbles-Lost
14-0
Returning
5
Kick Returns
16
104
Kick Return Yards
309
20.8
Yards Per Kick Return
19.3
29
Long Kick Return
37
0
Kick Return Touchdowns
0
4
Punt Returns
7
24
Punt Return Yards
32
6.0
Yards Per Punt Return
4.6
14
Long Punt Return
21
0
Punt Return Touchdowns
0
0
Punt Return Fair Catches
0
0
Kick Return Fumbles Lost
0
0
Punt Return Fumbles Lost
0
10
Team Games Played
10
4-24
Punt: Total
7-32
Kicking
9
Field Goal Made
7
10
Field Goal Attempts
9
90.0
Field Goal Percentage
77.8
47
Long Field Goal Made
52
0
Field Goal Attempts 1-19
0
2
Field Goal Attempts 20-29
3
2
Field Goal Attempts 30-39
2
6
Field Goal Attempts 40-49
3
0
Field Goal Attempts 50+
1
25
Extra Points Made
19
26
Extra Point Attempts
22
96.2
Extra Point Percentage
86.4
0
Field Goals Made 1-19
0
2
Field Goals Made 20-29
3
2
Field Goals Made 30-39
1
5
Field Goals Made 40-49
2
0
Field Goals Made 50+
1
52
Total Kicking Points
40
10
Team Games Played
10
65
Touchback Percentage
37
0.0
Average Kickoff Return Yards
0.0
0
Kickoff Return Yards
0
0
Kickoff Returns
0
0-0
Kickoffs: Total
0-0
9-10
FG: Good-Attempts
7-9
Punting
36
Punts
41
1,525
Punt Yards
1,639
70
Long Punt
51
42.4
Gross Average Punt Yards
40.0
42.4
Net Average Punt Yards
40.0
0
Punts Blocked
0
9
Punts Inside 20
4
3
Touchbacks
5
14
Fair Catches
9
1
Punt Returns
18
0
Punt Return Yards
0
0.0
Average Punt Return Yards
0.0
10
Team Games Played
10
36-1,525
Punt: Total Yards
41-1,639
Scoring
11
Rushing Touchdowns
15
18
Receiving Touchdowns
10
0
Return Touchdowns
0
29
Total Touchdowns
25
9
Field Goals
7
25
Kick Extra Points
19
3
Total Two Point Conversions
2
232
Total Points
204
23.2
Total Points Per Game
20.4