

Sacred Heart vs Massachusetts Live Score (12 Sep, 2026)
Score by Quarter
| Team | Q1 | Q2 | Q3 | Q4 | Final |
|---|---|---|---|---|---|
 Sacred Heart |
0 | 0 | 3 | 7 | 10 |
 Massachusetts |
17 | 6 | 14 | 0 | 37 |
Scoring Plays
Q1
14:16
14:16
W. Watson III pass to T.Y. Harding for 49 yds, for a TD (D. Morris KICK)
Passing Touchdown
0 – 7
Q1
11:44
11:44
J. O'Sullivan punt for 44 yds, T.Y. Harding returns for 82 yds for a TD (D. Morris KICK)
Punt Return Touchdown
0 – 14
Q1
1:40
1:40
D. Morris 33 yd FG GOOD
Field Goal Good
0 – 17
Q2
0:21
0:21
W. Watson III run for 8 yds, for a TD (D. Morris PAT MISSED)
Rushing Touchdown
0 – 23
Q3
11:51
11:51
R. Adkins run for 1 yd, for a TD (D. Morris KICK)
Rushing Touchdown
0 – 30
Q3
10:30
10:30
P. Snyder pass intercepted, for a TD, J. Harmon return for 34 yds (D. Morris KICK)
Pass Interception Return
0 – 37
Q3
5:29
5:29
R. Bocklet 35 yd FG GOOD
Field Goal Good
3 – 37
Q4
3:32
3:32
C. Snider run for 1 yd, for a TD (R. Bocklet KICK)
Rushing Touchdown
10 – 37
Game Leaders
Sacred HeartMassachusetts
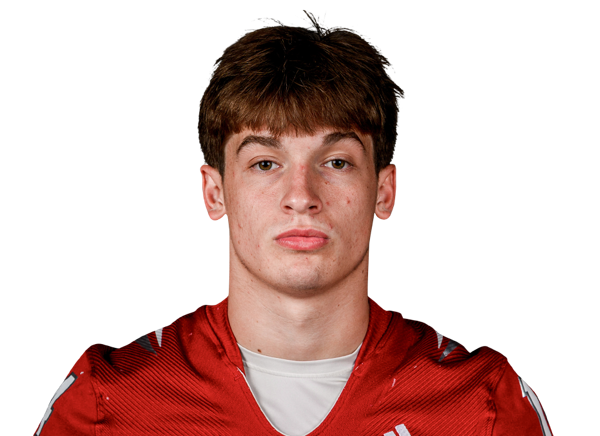 P. Snyder QB
Passing Yards
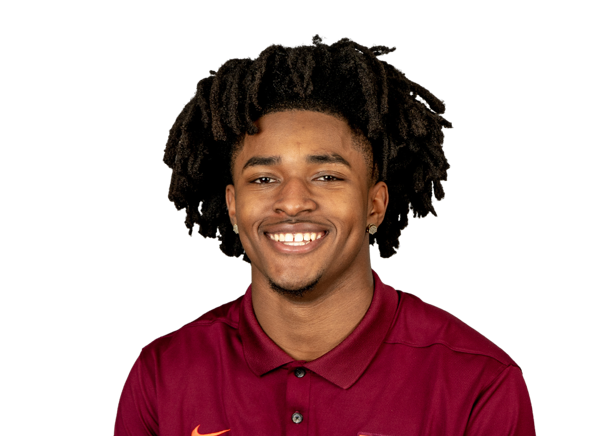 W. Watson III QB
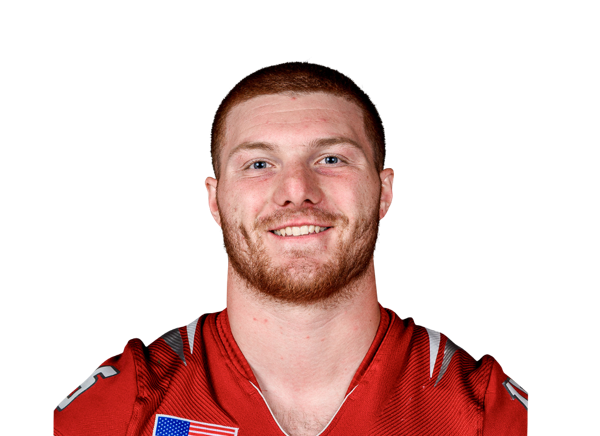 N. Yanchuk RB
Rushing Yards
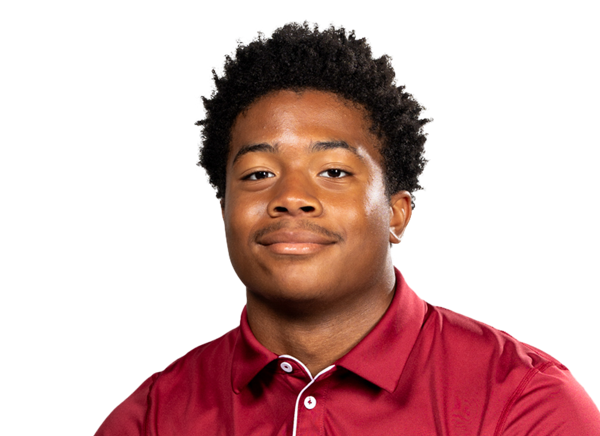 E. Faulkner RB
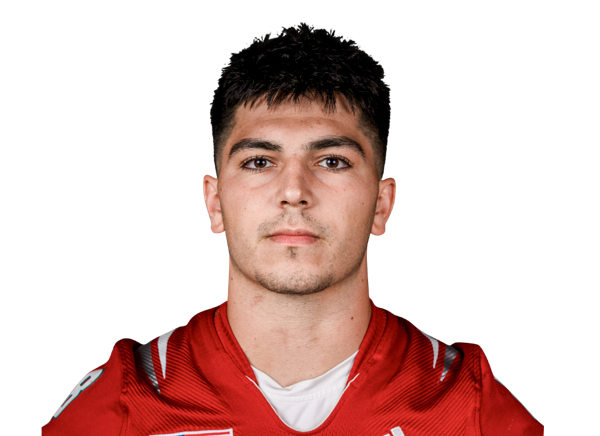 J. Palmieri WR
Receiving Yards
 J. Griffin Jr. WR
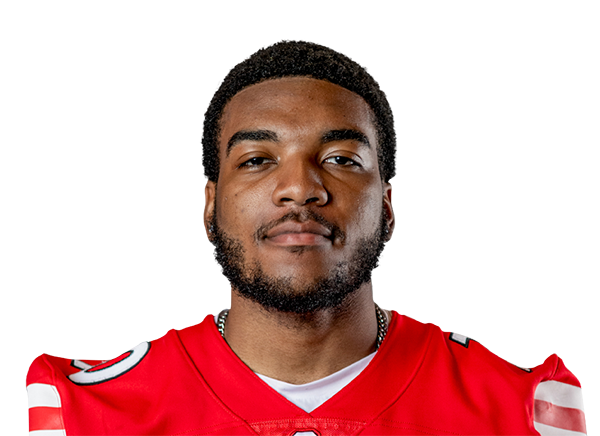 J. Lewis S
Tackles
 K. Bendolph LB
Player Box Score
Sacred Heart| Player | C/ATT | YDS | AVG | TD | INT |
|---|---|---|---|---|---|
| Poochie Snyder#14 | 11/16 | 77 | 4.8 | 0 | 1 |
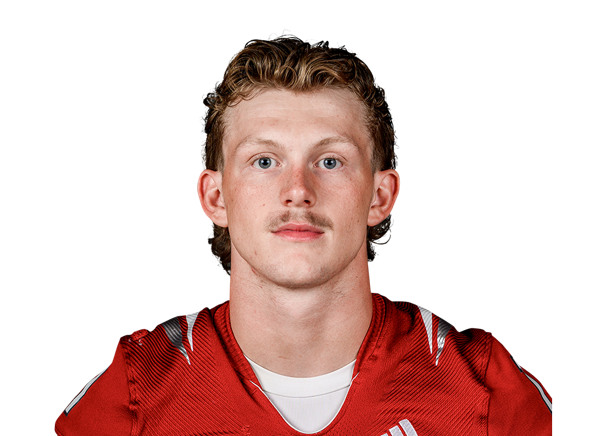 John Michalski#11 | 3/5 | 50 | 10.0 | 0 | 0 |
 Dameon Crosby#7 | 3/4 | 33 | 8.3 | 0 | 0 |
Massachusetts| Player | C/ATT | YDS | AVG | TD | INT |
|---|---|---|---|---|---|
| William Watson III#5 | 9/10 | 152 | 15.2 | 1 | 0 |
 Aedan McCarthy#13 | 2/4 | 11 | 2.8 | 0 | 0 |
Sacred Heart| Player | CAR | YDS | AVG | TD | LONG |
|---|---|---|---|---|---|
| Nicholas Yanchuk#15 | 6 | 28 | 4.7 | 0 | 6 |
| Dameon Crosby#7 | 4 | 24 | 6.0 | 0 | 9 |
| Poochie Snyder#14 | 7 | 24 | 3.4 | 0 | 9 |
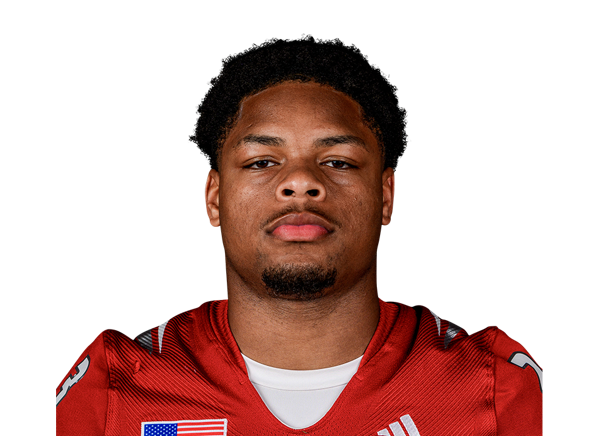 Chuck Webb#2 | 8 | 24 | 3.0 | 0 | 8 |
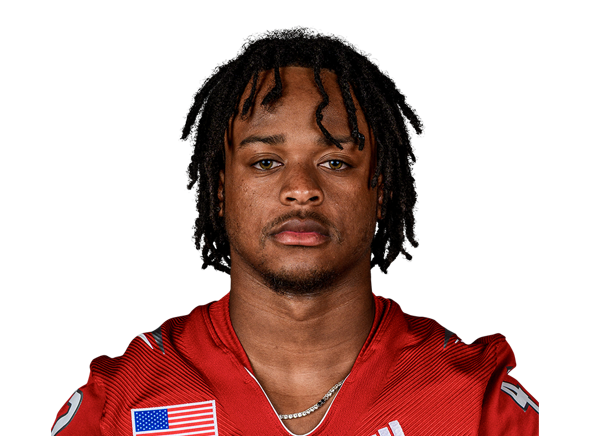 DJ Williams#42 | 5 | 23 | 4.6 | 0 | 12 |
| John Michalski#11 | 1 | 7 | 7.0 | 0 | 7 |
| Darius Chukwuemeka#30 | 4 | 6 | 1.5 | 0 | 4 |
 Steven Dowdy Jr.#5 | 3 | 5 | 1.7 | 0 | 3 |
 Tom Ligi#48 | 2 | 2 | 1.0 | 0 | 2 |
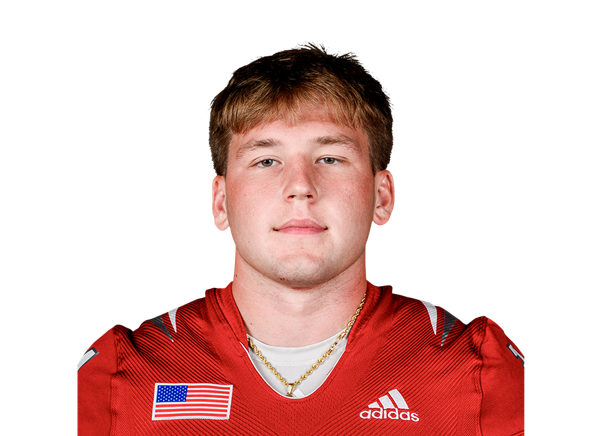 Cole Snider#34 | 1 | 1 | 1.0 | 1 | 1 |
| Team | 1 | -1 | -1.0 | 0 | 1 |
Massachusetts| Player | CAR | YDS | AVG | TD | LONG |
|---|---|---|---|---|---|
| Elijah Faulkner#23 | 11 | 72 | 6.5 | 0 | 26 |
| William Watson III#5 | 4 | 40 | 10.0 | 1 | 22 |
 Justin Williams-Thomas#6 | 4 | 15 | 3.8 | 0 | 9 |
| TK Davis#22 | 3 | 13 | 4.3 | 0 | 7 |
| Curtis Kimmons IV#14 | 3 | 11 | 3.7 | 0 | 7 |
 Reece Adkins#83 | 1 | 1 | 1.0 | 1 | 1 |
Sacred Heart| Player | REC | YDS | AVG | TD | LONG |
|---|---|---|---|---|---|
| Jason Palmieri#8 | 5 | 46 | 9.2 | 0 | 15 |
| Darius Chukwuemeka#30 | 2 | 37 | 18.5 | 0 | 35 |
| Steven Dowdy Jr.#5 | 2 | 18 | 9.0 | 0 | 12 |
| DJ Williams#42 | 2 | 15 | 7.5 | 0 | 9 |
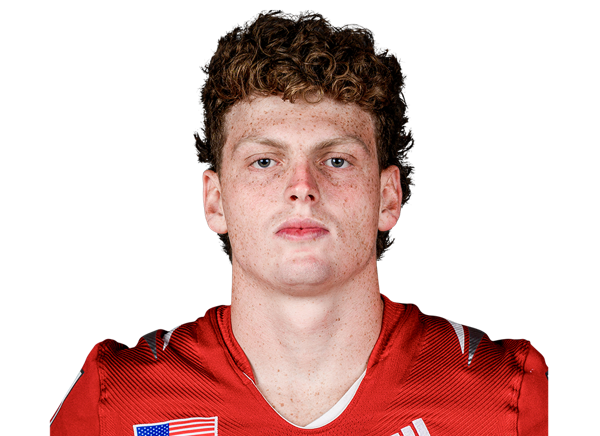 Jimmy Casey#81 | 1 | 11 | 11.0 | 0 | 11 |
| Cole Snider#34 | 1 | 11 | 11.0 | 0 | 11 |
 Justin Bloise#4 | 1 | 10 | 10.0 | 0 | 10 |
| Chuck Webb#2 | 2 | 7 | 3.5 | 0 | 6 |
 Dean Hangey#10 | 1 | 5 | 5.0 | 0 | 5 |
Massachusetts| Player | REC | YDS | AVG | TD | LONG |
|---|---|---|---|---|---|
| Joseph Griffin Jr.#1 | 3 | 59 | 19.7 | 0 | 39 |
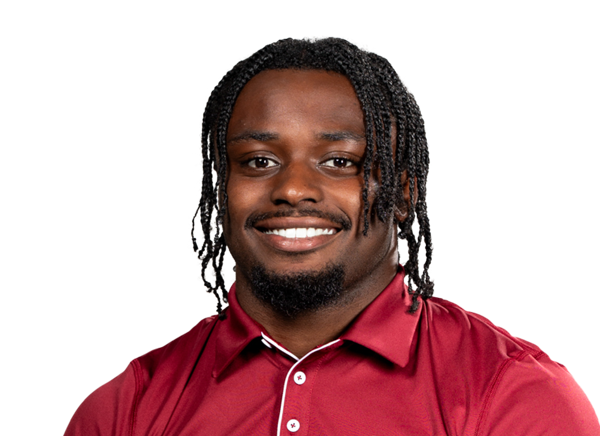 T.Y. Harding#2 | 1 | 49 | 49.0 | 1 | 49 |
 Dallas Elliott#17 | 1 | 17 | 17.0 | 0 | 17 |
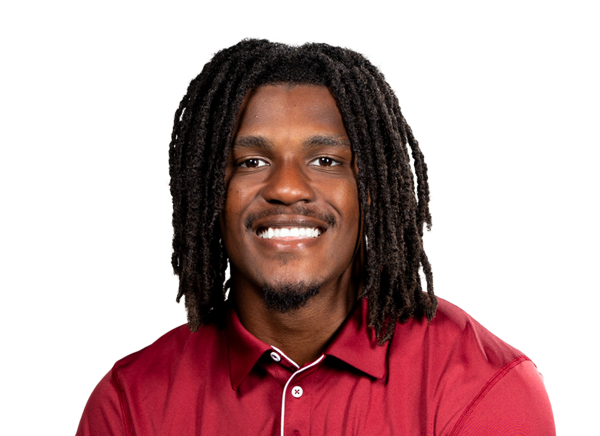 Kezion Dia-Johnson#8 | 2 | 17 | 8.5 | 0 | 11 |
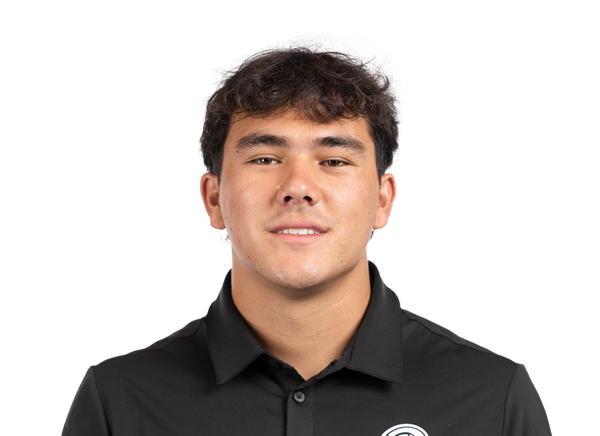 Logan Inagawa#16 | 1 | 10 | 10.0 | 0 | 10 |
| Reece Adkins#83 | 1 | 5 | 5.0 | 0 | 5 |
| Tavian Dashiell#15 | 1 | 5 | 5.0 | 0 | 5 |
| Curtis Kimmons IV#14 | 1 | 1 | 1.0 | 0 | 1 |
Sacred Heart| Player | TOT | SOLO | SACKS | TFL | PD | QB HUR | TD |
|---|---|---|---|---|---|---|---|
| Jeremiah Lewis#23 | 5 | 3 | 0 | 0 | 0 | 0 | 0 |
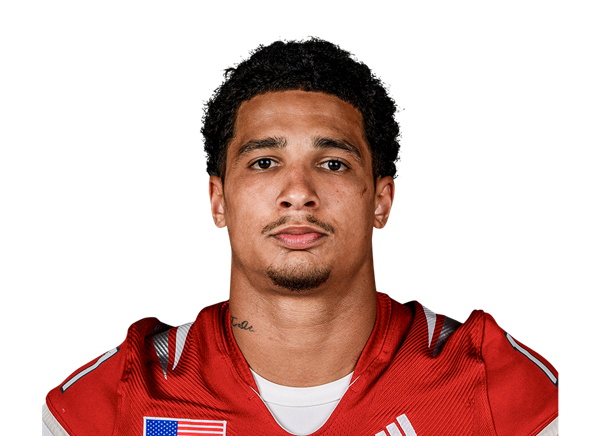 Myles Hamilton#11 | 5 | 3 | 0 | 1 | 0 | 0 | 0 |
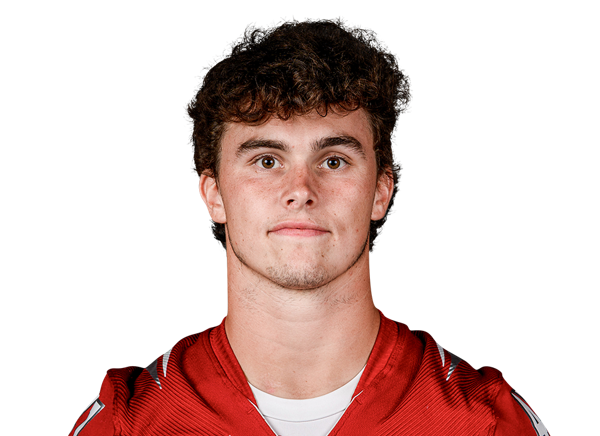 Ryan Palmieri#47 | 5 | 1 | 0 | 0 | 0 | 0 | 0 |
 Kenny Selby | 4 | 2 | 0 | 0 | 0 | 0 | 0 |
 Curtis Whiting#2 | 3 | 1 | 0 | 0 | 0 | 0 | 0 |
 Jared Hirschfeld#90 | 3 | 0 | 0 | 0 | 0 | 0 | 0 |
 Kymari Latney#9 | 3 | 0 | 0 | 0 | 0 | 0 | 0 |
 Jack Leuthe#32 | 2 | 2 | 0 | 0 | 0 | 0 | 0 |
 Eli Jordan#33 | 2 | 1 | 0 | 0.5 | 0 | 0 | 0 |
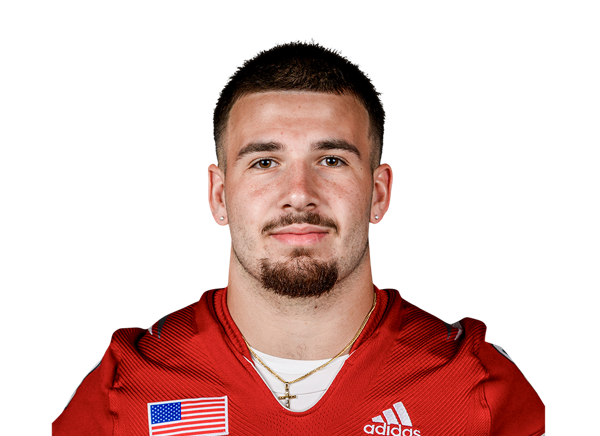 Luke Hackett#8 | 2 | 1 | 0 | 0 | 0 | 0 | 0 |
 Josiah Aidoo#45 | 2 | 1 | 0 | 0 | 0 | 0 | 0 |
 Janier Armstead#54 | 2 | 0 | 0 | 0 | 0 | 0 | 0 |
| Tristan Counter#46 | 2 | 0 | 0 | 0.5 | 0 | 0 | 0 |
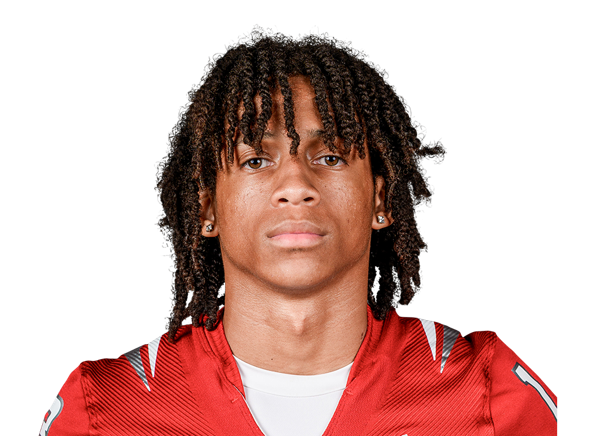 Jayden Miller#13 | 2 | 0 | 0 | 0 | 0 | 0 | 0 |
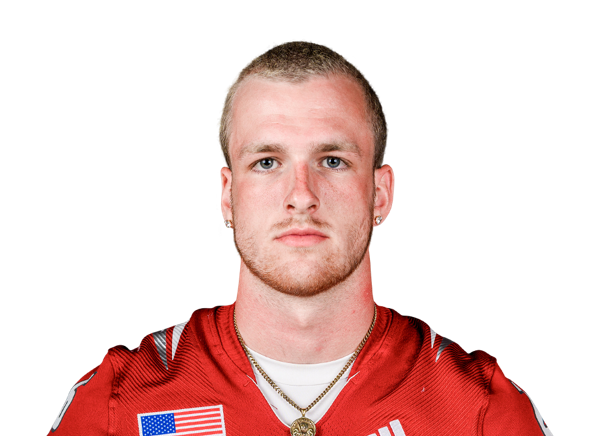 Charlie Bywalski#26 | 2 | 0 | 0 | 0 | 0 | 0 | 0 |
| Khamari Brown#99 | 2 | 0 | 0 | 0 | 0 | 1 | 0 |
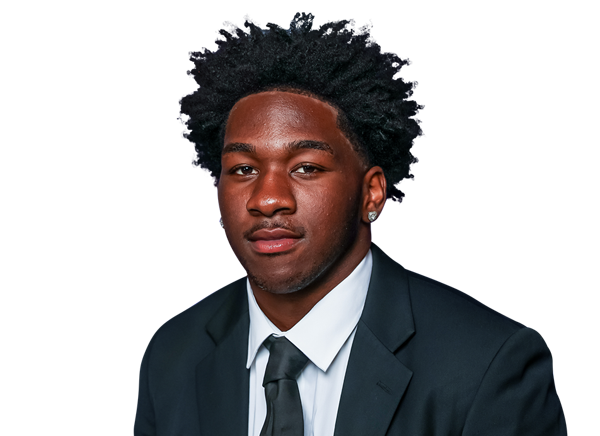 Chris Williams | 1 | 1 | 0 | 0 | 0 | 0 | 0 |
 Mitchell Donkor#97 | 1 | 0 | 0 | 0 | 0 | 0 | 0 |
| Zac Fearon#18 | 1 | 0 | 0 | 0 | 0 | 0 | 0 |
 Ryan McDonald#19 | 1 | 0 | 0 | 0 | 0 | 0 | 0 |
| Ben Hughes#56 | 1 | 0 | 0 | 0 | 0 | 0 | 0 |
 Kevin Bright#94 | 1 | 0 | 0 | 0 | 0 | 0 | 0 |
Massachusetts| Player | TOT | SOLO | SACKS | TFL | PD | QB HUR | TD |
|---|---|---|---|---|---|---|---|
| Khari Bendolph#15 | 11 | 3 | 0 | 0 | 0 | 0 | 0 |
 Tyler Martin#5 | 7 | 3 | 0 | 0 | 0 | 0 | 0 |
 Kendall Bournes#3 | 5 | 2 | 0 | 0 | 0 | 0 | 0 |
 Zeraun Daniel#38 | 5 | 0 | 0 | 0 | 0 | 0 | 0 |
 Dinos Drossos#18 | 5 | 0 | 0 | 0 | 0 | 0 | 0 |
 David Timson#36 | 5 | 0 | 0 | 0 | 0 | 0 | 0 |
 TJ Magee#7 | 4 | 2 | 0 | 0 | 0 | 0 | 0 |
 Timmy Hinspeter#44 | 4 | 1 | 0 | 0 | 0 | 0 | 0 |
 Joshua Nobles#2 | 4 | 0 | 0 | 0 | 0 | 0 | 0 |
 Michael Pangaro#27 | 3 | 2 | 0 | 0 | 0 | 0 | 0 |
| David Chiavegato#19 | 3 | 1 | 0 | 0 | 0 | 0 | 0 |
 Tim Passmore Jr.#90 | 3 | 0 | 0 | 0 | 0 | 0 | 0 |
 Aubrey Melvin#10 | 3 | 0 | 0 | 0 | 0 | 0 | 0 |
 Kamarion Thomas#99 | 3 | 0 | 0 | 0 | 0 | 0 | 0 |
| Justin Williams-Thomas#6 | 2 | 1 | 0 | 0 | 0 | 0 | 0 |
 Colin Reynolds#94 | 2 | 1 | 0 | 0 | 0 | 0 | 0 |
| Chris Stanley#4 | 2 | 1 | 0 | 0 | 0 | 0 | 0 |
 Raheim Sexil#13 | 2 | 0 | 0 | 0 | 1 | 0 | 0 |
 Joshua Iseah#6 | 2 | 0 | 0 | 0 | 1 | 0 | 0 |
| Romando Johnson#92 | 2 | 0 | 0 | 0 | 0 | 0 | 0 |
| Zakar Morris#55 | 2 | 0 | 0 | 0 | 0 | 0 | 0 |
 Jahmad Harmon#22 | 1 | 1 | 0 | 0 | 0 | 0 | 1 |
 Jerry Washington#11 | 1 | 1 | 0 | 0 | 0 | 0 | 0 |
 DD Snyder#1 | 1 | 0 | 0 | 0 | 0 | 0 | 0 |
 Andrew DePaepe#42 | 1 | 0 | 0 | 0 | 0 | 0 | 0 |
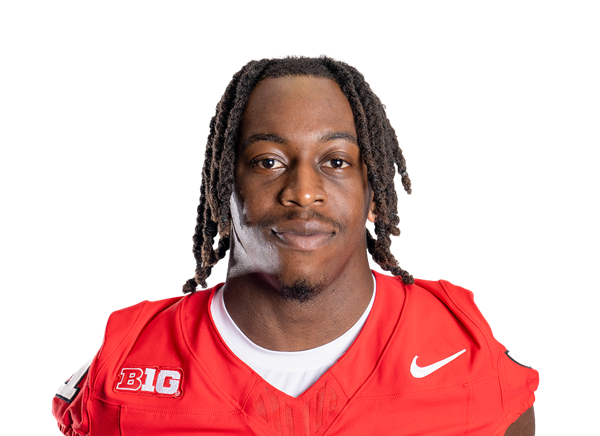 Michael Robinson#8 | 1 | 0 | 0 | 0 | 0 | 0 | 0 |
| Hollis Dirstine#95 | 1 | 0 | 0 | 0 | 0 | 0 | 0 |
 William DePaepe#98 | 1 | 0 | 0 | 0 | 0 | 0 | 0 |
| CJ Amobi#26 | 1 | 0 | 0 | 0 | 0 | 0 | 0 |
| T.Y. Harding#2 | 0 | 0 | 0 | 0 | 0 | 0 | 1 |
Sacred Heart| Player | FUM | LOST | REC |
|---|---|---|---|
| Poochie Snyder#14 | 1 | 0 | 0 |
Sacred Heart| Player | FG | PCT | LONG | XP | PTS |
|---|---|---|---|---|---|
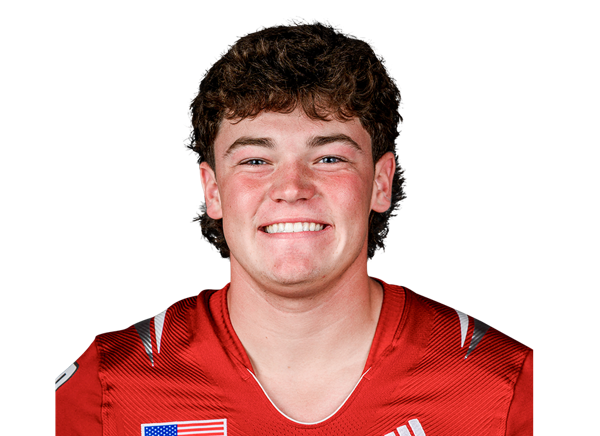 Ryan Bocklet#39 | 1/1 | 100.0 | 35 | 1/1 | 4 |
Massachusetts| Player | FG | PCT | LONG | XP | PTS |
|---|---|---|---|---|---|
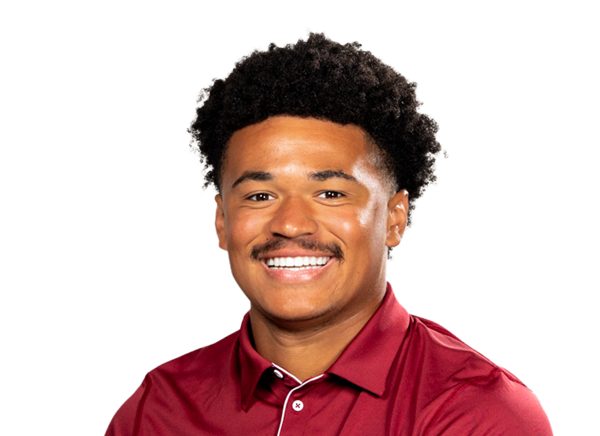 Derek Morris#99 | 1/2 | 50.0 | 33 | 4/5 | 7 |
Sacred Heart| Player | NO | YDS | AVG | TB | In 20 | LONG |
|---|---|---|---|---|---|---|
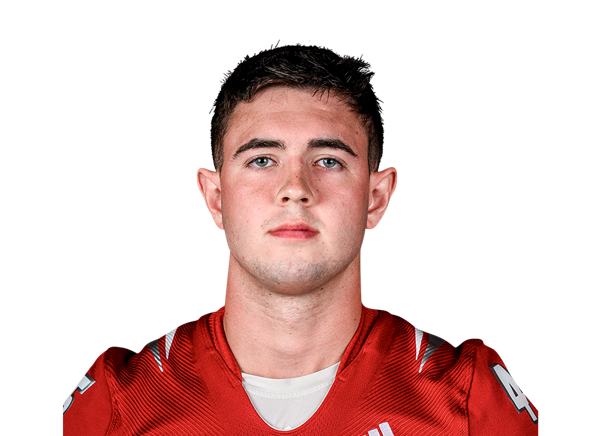 Jack O'Sullivan#46 | 4 | 129 | 32.3 | 0 | 1 | 44 |
| Ian Gopez#45 | 1 | 12 | 12.0 | 0 | 0 | 12 |
Massachusetts| Player | NO | YDS | AVG | TB | In 20 | LONG |
|---|---|---|---|---|---|---|
 Edward Phillipson#43 | 3 | 135 | 45.0 | 1 | 1 | 51 |
Massachusetts| Player | NO | YDS | AVG | LONG | TD |
|---|---|---|---|---|---|
| TJ Magee#7 | 1 | 20 | 20.0 | 20 | 0 |
Massachusetts| Player | NO | YDS | AVG | LONG | TD |
|---|---|---|---|---|---|
| T.Y. Harding#2 | 2 | 141 | 70.5 | 82 | 1 |
Massachusetts| Player | INT | YDS | TD |
|---|---|---|---|
| Jahmad Harmon#22 | 1 | 34 | 1 |
Drive Summary
MASS
Touchdown
75
SHU
Touchdown
13
SHU
Punt
30
MASS
Field Goal
83
SHU
Punt
38
MASS
Punt
21
SHU
Downs
51
MASS
Touchdown
71
SHU
End Of Half
-6
SHU
Punt
7
MASS
Touchdown
8
SHU
Interception Touchdown
6
SHU
Field Goal
58
MASS
Punt
3
SHU
Punt
13
MASS
Missed FG
15
SHU
Touchdown
75
MASS
Punt
7
SHU
End Of Quarter
8
Injury Report
No current injury report is available for this matchup.
Head-to-Head
Historical meetings are not available for this matchup.
Game Information
StageWeek 2
Season2026
KickoffSat, Sep 12, 3:30 pm
VenueWarren McGuirk Alumni Stadium
LocationAmherst, MA
SurfaceArtificial Turf
BroadcastESPN+
Division Standings
FCS — Coastal Athletic Association
| Team | W | L | T | Pct | PF | PA | Home | Away | Strk |
|---|---|---|---|---|---|---|---|---|---|
 Rhode Island | 0 | 1 | 0 | 0.000 | 14 | 38 | 0-0 | 0-1 | L1 |
 UAlbany | 0 | 1 | 0 | 0.000 | 17 | 21 | 0-0 | 0-1 | L1 |
 Maine | 0 | 2 | 0 | 0.000 | 19 | 77 | 0-0 | 0-2 | L2 |
 Monmouth | 0 | 1 | 0 | 0.000 | 14 | 49 | 0-0 | 0-1 | L1 |
 Campbell | 0 | 1 | 0 | 0.000 | 3 | 52 | 0-0 | 0-1 | L1 |
 Bryant | 0 | 1 | 0 | 0.000 | 3 | 59 | 0-0 | 0-1 | L1 |
 Hampton | 0 | 1 | 0 | 0.000 | 0 | 62 | 0-0 | 0-1 | L1 |
 Stony Brook | 0 | 1 | 0 | 0.000 | 17 | 41 | 0-0 | 0-1 | L1 |
 North Carolina A&T | 0 | 1 | 0 | 0.000 | 10 | 59 | 0-0 | 0-1 | L1 |
 Elon | 0 | 1 | 0 | 0.000 | 7 | 34 | 0-0 | 0-1 | L1 |
 New Hampshire | 0 | 1 | 0 | 0.000 | 3 | 66 | 0-0 | 0-1 | L1 |
| Sacred Heart | 0 | 1 | 0 | 0.000 | 10 | 37 | 0-0 | 0-1 | L1 |
 Towson | 0 | 2 | 0 | 0.000 | 24 | 87 | 0-0 | 0-2 | L2 |
FBS — Mid-American Conference
| Team | W | L | T | Pct | PF | PA | Home | Away | Strk |
|---|---|---|---|---|---|---|---|---|---|
 Eastern Michigan | 4 | 7 | 0 | 0.364 | 226 | 300 | 2-3 | 2-4 | L4 |
| Massachusetts | 5 | 6 | 0 | 0.455 | 276 | 257 | 3-3 | 2-3 | L2 |
 Buffalo | 8 | 3 | 0 | 0.727 | 283 | 262 | 5-1 | 3-2 | W6 |
 Ball State | 3 | 8 | 0 | 0.273 | 241 | 376 | 2-2 | 1-6 | L3 |
 Central Michigan | 5 | 6 | 0 | 0.455 | 227 | 261 | 4-2 | 1-4 | L1 |
 Kent State | 3 | 8 | 0 | 0.273 | 160 | 328 | 3-2 | 0-6 | L3 |
 Miami (OH) | 7 | 4 | 0 | 0.636 | 301 | 260 | 4-2 | 3-2 | W2 |
 Akron | 2 | 9 | 0 | 0.182 | 220 | 365 | 1-4 | 1-5 | W1 |
 Bowling Green | 3 | 7 | 0 | 0.300 | 193 | 289 | 2-3 | 1-4 | W1 |
 Ohio | 8 | 3 | 0 | 0.727 | 317 | 257 | 5-0 | 3-3 | W1 |
 Toledo | 8 | 2 | 0 | 0.800 | 343 | 220 | 5-1 | 3-1 | W4 |
 Western Michigan | 8 | 3 | 0 | 0.727 | 312 | 214 | 4-1 | 4-2 | W3 |
 Sacramento State | 2 | 9 | 0 | 0.182 | 177 | 321 | 2-4 | 0-5 | L2 |
Sacred Heart
7th in CAA
VS
Massachusetts
9th in MAC
Quarterbacks & Specialists
#7
Dameon Crosby
#11
John Michalski
#46
Jack O'Sullivan
#14
Poochie Snyder
Receivers & Backs
#4
Justin Bloise
#81
Jimmy Casey
#30
Darius Chukwuemeka
#5
Steven Dowdy Jr.
#10
Dean Hangey
#48
Tom Ligi
#8
Jason Palmieri
#34
Cole Snider
#2
Chuck Webb
#42
DJ Williams
#15
Nicholas Yanchuk
Defensive Line & Linebackers
#45
Josiah Aidoo
#54
Janier Armstead
#94
Kevin Bright
#99
Khamari Brown
#46
Tristan Counter
#97
Mitchell Donkor
#8
Luke Hackett
#11
Myles Hamilton
#90
Jared Hirschfeld
#56
Ben Hughes
#33
Eli Jordan
#32
Jack Leuthe
#7
Chris Williams
Defensive Backs
#26
Charlie Bywalski
#18
Zac Fearon
#9
Kymari Latney
#23
Jeremiah Lewis
#19
Ryan McDonald
#13
Jayden Miller
#47
Ryan Palmieri
Kenny Selby
#2
Curtis Whiting
Other
#39
Ryan Bocklet
#45
Ian Gopez
Quarterbacks & Specialists
#16
Logan Inagawa
#13
Aedan McCarthy
#43
Edward Phillipson
#5
William Watson III
Receivers & Backs
#83
Reece Adkins
#15
Tavian Dashiell
#22
TK Davis
#8
Kezion Dia-Johnson
#17
Dallas Elliott
#23
Elijah Faulkner
#1
Joseph Griffin Jr.
#2
T.Y. Harding
#14
Curtis Kimmons IV
#6
Justin Williams-Thomas
Defensive Line & Linebackers
#26
CJ Amobi
#15
Khari Bendolph
#42
Andrew DePaepe
#98
William DePaepe
#95
Hollis Dirstine
#18
Dinos Drossos
#44
Timmy Hinspeter
#6
Joshua Iseah
#92
Romando Johnson
#5
Tyler Martin
#10
Aubrey Melvin
#55
Zakar Morris
#2
Joshua Nobles
#90
Tim Passmore Jr.
#94
Colin Reynolds
#99
Kamarion Thomas
#36
David Timson
#11
Jerry Washington
Defensive Backs
#3
Kendall Bournes
#19
David Chiavegato
#38
Zeraun Daniel
#22
Jahmad Harmon
#7
TJ Magee
#27
Michael Pangaro
#8
Michael Robinson
#13
Raheim Sexil
#1
DD Snyder
#4
Chris Stanley
Other
#99
Derek Morris
Sacred Heart
7th in CAA
VS
Massachusetts
9th in MAC
Passing
70.5
Completion Percentage
62.9
191
Completions
166
1.80
Interception Percentage
1.50
5
Interceptions
4
53
Longest Pass
64
2,038
Net Passing Yards
1,926
203.8
Net Passing Yards Per Game
192.6
271
Passing Attempts
264
5.50
Passing Touchdown %
3.80
15
Passing Touchdowns
10
148.2
Passer Rating
133.7
18
Total Sacks
15
85
Sack Yards Lost
105
7.5
Yards Per Pass Attempt
7.3
2,038
Passing Yards
1,926
0
Passing Fumbles Lost
0
10
Team Games Played
10
381.8
Yards Per Game
332.0
23.6
Total Points Per Game
24.3
236
Total Points
243
29
Total Touchdowns
30
203.8
Passing Yards Per Game
192.6
191-271
Comp-Att
166-264
18-85
Sacks-Yards Lost
15-105
Rushing
422
Rushing Attempts
330
1,780
Rushing Yards
1,394
4.2
Yards Per Rush Attempt
4.2
42
Long Rushing
56
0
20+ Yard Rushing Plays
0
14
Rushing Touchdowns
17
178.0
Rushing Yards Per Game
139.4
0
Rushing Fumbles
0
0
Rushing Fumbles Lost
0
88
Rushing 1st downs
68
10
Team Games Played
10
3,818
Total Yards
3,320
711
Total Offensive Plays
609
23.6
Total Points Per Game
24.3
236
Total Points
243
29
Total Touchdowns
30
Receiving
191
Receptions
166
0
Receiving Targets
0
2,038
Receiving Yards
1,926
2,038
Receiving Yards
1,926
15
Receiving Touchdowns
10
53
Long Reception
64
0
20+ Yard Receiving Plays
0
203.8
Receiving Yards Per Game
192.6
0
Receiving Fumbles
0
0
Receiving Fumbles Lost
0
86
Receiving Yards After Catch
809
100
Receiving First Downs
78
10
Team Games Played
10
10.7
Yards Per Reception
11.6
23.6
Total Points Per Game
24.3
236
Total Points
243
29
Total Touchdowns
30
Miscellaneous
217
Total 1st downs
162
88
Rushing 1st downs
68
101
Passing 1st downs
78
28
1st downs by penalty
16
61
Third Down Conversions
38
137
Third Down Attempts
122
44.53
3rd down %
31.15
12
Fourth Down Conversions
8
22
First Downs Attempts
17
54.55
4th down %
47.06
70
Total Penalties
73
642
Total Penalty Yards
644
19960
Possession Time Seconds
17657
0.00
Red Zone Field Goal Percentage
0.00
0.00
Red Zone Scoring Percentage
0.00
0.00
Red Zone Efficiency Percentage
0.00
0.00
Red Zone Touchdown Percentage
0.00
10
Total Takeaways
11
7
Total Giveaways
9
3
Turnover Ratio
2
0
Fumbles Lost
0
61-137
3rd down efficiency
38-122
12-22
4th down efficiency
8-17
70-642
Total-Yards
73-644
Defense
286
Solo Tackles
286
324
Assist Tackles
416
610
Total Tackles
702
12
Sacks
25
84
Sack Yards
145
75
Stuffs
79
22
Passes Defended
37
18.0
Average Interception Yards
15.7
18
Long Interception
49
0
Miscellaneous Touchdowns
0
0
Kicks Blocked
1
27
Tackles For Loss
34
10
Team Games Played
10
Defensive Interceptions
1
Interceptions
7
18
Interception Yards
110
0
Interception Touchdowns
2
1-18
INT: Total
7-110
General
7
Fumbles
13
6
Forced Fumbles
4
5
Fumbles Recovered
7
0
Fumbles Touchdowns
0
10
Games Played
10
7-0
Fumbles-Lost
13-0
Returning
35
Kick Returns
14
655
Kick Return Yards
251
18.7
Yards Per Kick Return
17.9
35
Long Kick Return
28
0
Kick Return Touchdowns
0
3
Punt Returns
9
22
Punt Return Yards
156
7.3
Yards Per Punt Return
17.3
8
Long Punt Return
82
0
Punt Return Touchdowns
1
0
Punt Return Fair Catches
0
0
Kick Return Fumbles Lost
0
0
Punt Return Fumbles Lost
0
10
Team Games Played
10
3-22
Punt: Total
9-156
Kicking
12
Field Goal Made
12
13
Field Goal Attempts
18
92.3
Field Goal Percentage
66.7
42
Long Field Goal Made
56
1
Field Goal Attempts 1-19
0
4
Field Goal Attempts 20-29
2
6
Field Goal Attempts 30-39
7
2
Field Goal Attempts 40-49
3
0
Field Goal Attempts 50+
6
26
Extra Points Made
25
27
Extra Point Attempts
26
96.3
Extra Point Percentage
96.2
1
Field Goals Made 1-19
0
4
Field Goals Made 20-29
2
5
Field Goals Made 30-39
6
2
Field Goals Made 40-49
0
0
Field Goals Made 50+
4
62
Total Kicking Points
61
10
Team Games Played
10
36
Touchback Percentage
78
0.0
Average Kickoff Return Yards
0.0
0
Kickoff Return Yards
0
0
Kickoff Returns
0
0-0
Kickoffs: Total
0-0
12-13
FG: Good-Attempts
12-18
Punting
32
Punts
47
1,207
Punt Yards
2,053
64
Long Punt
67
37.7
Gross Average Punt Yards
43.7
37.7
Net Average Punt Yards
43.7
0
Punts Blocked
0
7
Punts Inside 20
16
3
Touchbacks
4
2
Fair Catches
22
14
Punt Returns
13
0
Punt Return Yards
0
0.0
Average Punt Return Yards
0.0
10
Team Games Played
10
32-1,207
Punt: Total Yards
47-2,053
Scoring
14
Rushing Touchdowns
17
15
Receiving Touchdowns
10
0
Return Touchdowns
1
29
Total Touchdowns
28
12
Field Goals
12
26
Kick Extra Points
25
0
Total Two Point Conversions
1
236
Total Points
243
23.6
Total Points Per Game
24.3