

San Diego State vs UCLA Live Score (12 Sep, 2026)
Score by Quarter
| Team | Q1 | Q2 | Q3 | Q4 | Final |
|---|---|---|---|---|---|
 San Diego State |
0 | 0 | 0 | 10 | 10 |
 UCLA |
0 | 0 | 7 | 21 | 28 |
Scoring Plays
Q3
11:17
11:17
W. Knight run for 8 yds, for a TD (M. Bhaghani KICK)
Rushing Touchdown
0 – 7
Q4
13:11
13:11
C. DiLeva 46 yd FG GOOD
Field Goal Good
3 – 7
Q4
7:17
7:17
W. Knight run for 7 yds, for a TD (M. Bhaghani KICK)
Rushing Touchdown
3 – 14
Q4
4:31
4:31
J. Thomas run for 1 yd, for a TD (M. Bhaghani KICK)
Rushing Touchdown
3 – 21
Q4
2:28
2:28
J. Denegal pass to J. Ford for 19 yds, for a TD (C. DiLeva KICK)
Passing Touchdown
10 – 21
Q4
2:16
2:16
W. Knight run for 36 yds, for a TD (M. Bhaghani KICK)
Rushing Touchdown
10 – 28
Game Leaders
San Diego StateUCLA
 J. Denegal QB
Passing Yards
 N. Iamaleava QB
 L. Sutton RB
Rushing Yards
 W. Knight RB
 J. Ford TE
Receiving Yards
 S. Morgan WR
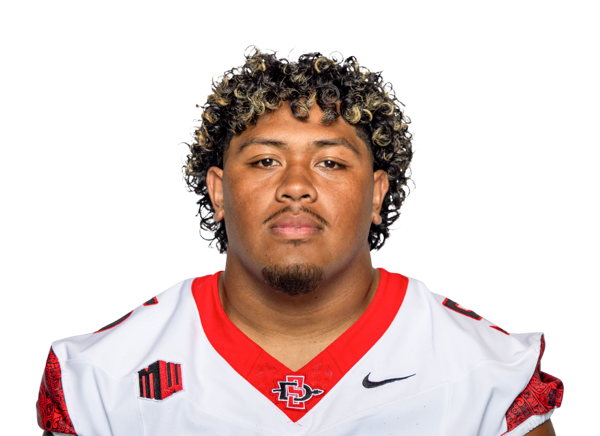 M. Finau DL
Sacks
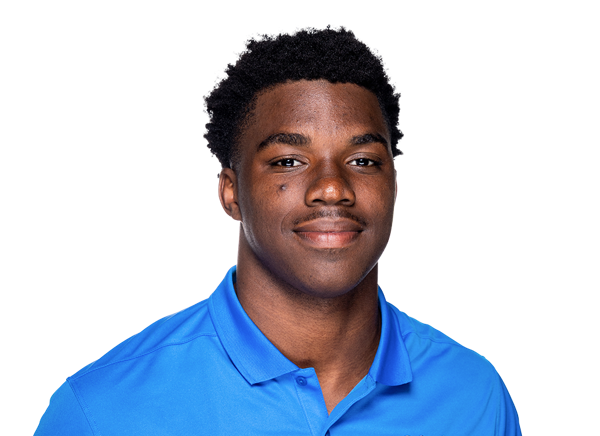 J. Woods LB
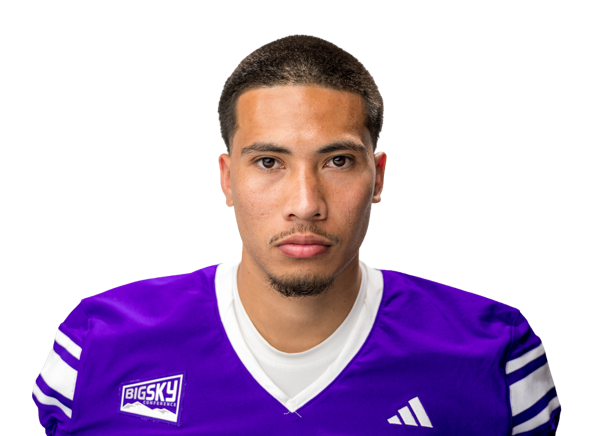 S. Hala LB
Tackles
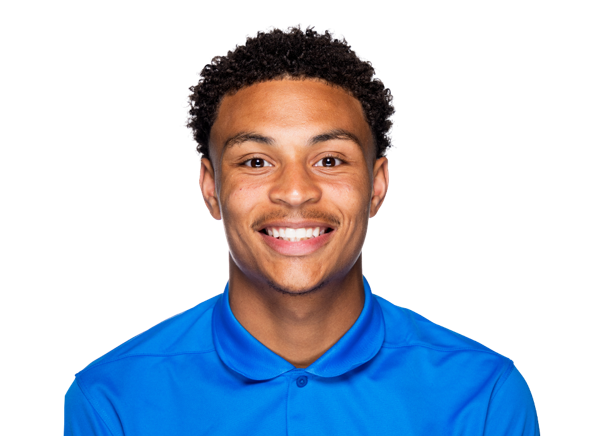 M. Hartford DB
Player Box Score
San Diego State| Player | C/ATT | YDS | AVG | TD | INT |
|---|---|---|---|---|---|
| Jayden Denegal#4 | 6/17 | 45 | 2.6 | 1 | 1 |
 Draiden Trudeau#13 | 0/1 | 0 | 0.0 | 0 | 0 |
UCLA| Player | C/ATT | YDS | AVG | TD | INT |
|---|---|---|---|---|---|
| Nico Iamaleava#9 | 14/22 | 151 | 6.9 | 0 | 1 |
 Team | 0/1 | 0 | 0.0 | 0 | 0 |
San Diego State| Player | CAR | YDS | AVG | TD | LONG |
|---|---|---|---|---|---|
| Lucky Sutton#7 | 19 | 81 | 4.3 | 0 | 14 |
 Javion Kinnard#21 | 12 | 48 | 4.0 | 0 | 10 |
 Bert Emanuel Jr.#5 | 1 | 14 | 14.0 | 0 | 14 |
 Jordin Thomas#29 | 3 | 7 | 2.3 | 0 | 5 |
| Jayden Denegal#4 | 3 | -6 | -2.0 | 0 | 6 |
UCLA| Player | CAR | YDS | AVG | TD | LONG |
|---|---|---|---|---|---|
| Wayne Knight#3 | 13 | 97 | 7.5 | 3 | 36 |
| Nico Iamaleava#9 | 13 | 57 | 4.4 | 0 | 25 |
 Jaivian Thomas#21 | 7 | 32 | 4.6 | 1 | 9 |
 Anthony Woods#6 | 8 | 30 | 3.8 | 0 | 6 |
| Team | 2 | -2 | -1.0 | 0 | 2 |
San Diego State| Player | REC | YDS | AVG | TD | LONG |
|---|---|---|---|---|---|
| Jackson Ford#15 | 1 | 19 | 19.0 | 1 | 19 |
| Javion Kinnard#21 | 1 | 10 | 10.0 | 0 | 10 |
| Bert Emanuel Jr.#5 | 2 | 10 | 5.0 | 0 | 7 |
 Nathan Acevedo#3 | 1 | 6 | 6.0 | 0 | 6 |
 Donovan Brown#14 | 1 | 0 | 0.0 | 0 | 0 |
UCLA| Player | REC | YDS | AVG | TD | LONG |
|---|---|---|---|---|---|
| Semaj Morgan#4 | 6 | 73 | 12.2 | 0 | 31 |
 Brian Rowe Jr.#2 | 5 | 63 | 12.6 | 0 | 45 |
 Jalen Saint Paul#86 | 2 | 11 | 5.5 | 0 | 8 |
| Jaivian Thomas#21 | 1 | 4 | 4.0 | 0 | 4 |
San Diego State| Player | TOT | SOLO | SACKS | TFL | PD | QB HUR | TD |
|---|---|---|---|---|---|---|---|
 Jelani McLaughlin#20 | 8 | 8 | 0 | 0 | 0 | 0 | 0 |
 Josh Hunter#29 | 8 | 7 | 0 | 0 | 0 | 0 | 0 |
| Sione Hala | 8 | 6 | 0 | 0 | 0 | 0 | 0 |
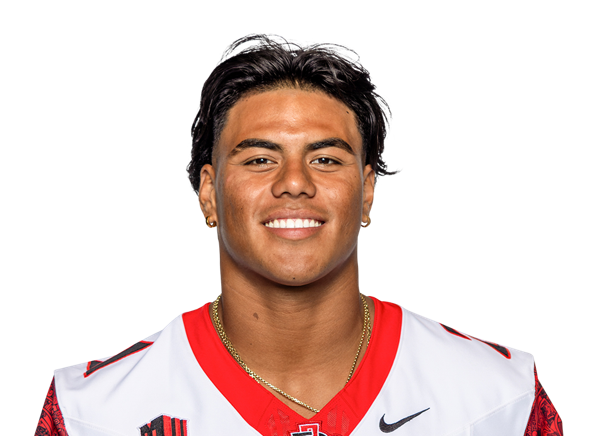 Tano Letuli#21 | 8 | 5 | 0 | 0 | 0 | 0 | 0 |
| Cameron Cooper#42 | 4 | 2 | 1 | 1 | 0 | 0 | 0 |
 Kai Wallin#18 | 4 | 2 | 0 | 0 | 0 | 0 | 0 |
 Isaiah Green#14 | 3 | 3 | 0 | 0 | 0 | 0 | 0 |
| Mike Lindsay#27 | 3 | 3 | 0 | 1 | 1 | 0 | 0 |
 Gavriel Lightfoot#95 | 3 | 1 | 0 | 0 | 0 | 1 | 0 |
 Josiah Cox#24 | 3 | 1 | 0 | 0 | 0 | 0 | 0 |
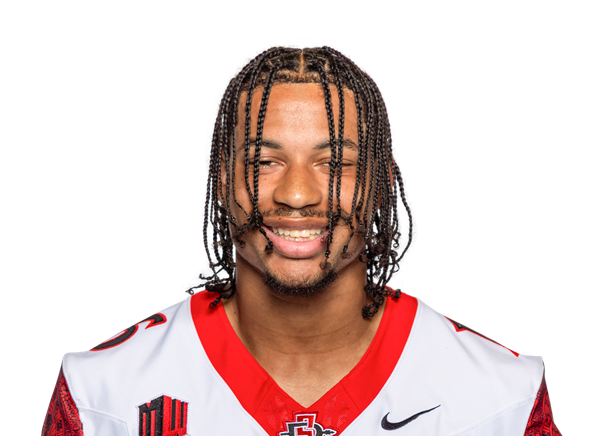 Jelani Whitmore#16 | 2 | 2 | 0 | 0 | 0 | 0 | 0 |
| Djibril Rahman#45 | 2 | 2 | 0 | 0 | 0 | 0 | 0 |
 Amari Comier#91 | 2 | 2 | 0 | 0 | 1 | 0 | 0 |
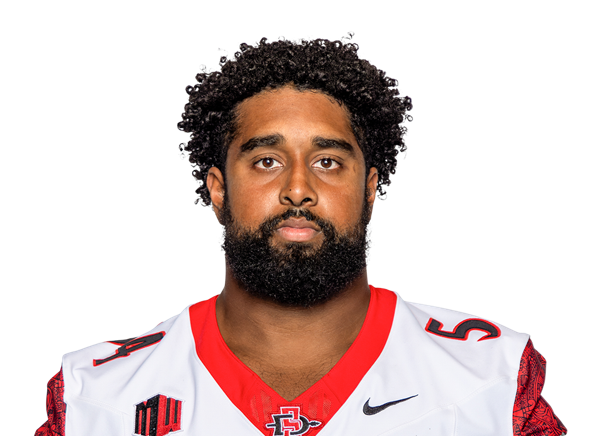 Krishna Clay#11 | 2 | 1 | 0 | 0 | 0 | 0 | 0 |
| Malachi Finau#6 | 1 | 1 | 1 | 1 | 0 | 0 | 0 |
| Javion Kinnard#21 | 1 | 1 | 0 | 0 | 0 | 0 | 0 |
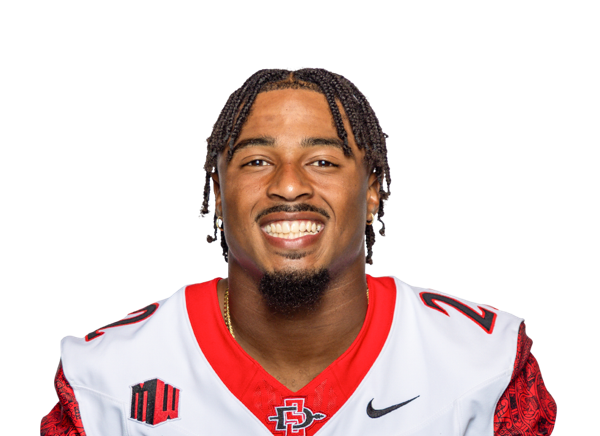 Max Garrison#22 | 1 | 0 | 0 | 0 | 0 | 0 | 0 |
| Tainoa Lave#35 | 1 | 0 | 0 | 0 | 0 | 0 | 0 |
 Oberhiri Eyafe#15 | 1 | 0 | 0 | 0 | 0 | 0 | 0 |
 Brady Nassar#33 | 0 | 0 | 0 | 0 | 1 | 1 | 0 |
UCLA| Player | TOT | SOLO | SACKS | TFL | PD | QB HUR | TD |
|---|---|---|---|---|---|---|---|
| Malik Hartford#12 | 10 | 3 | 0 | 0 | 1 | 0 | 0 |
| Jalen Woods#9 | 9 | 4 | 1 | 1 | 0 | 0 | 0 |
 Aiden Gobaira#97 | 6 | 2 | 0 | 0.5 | 0 | 0 | 0 |
 Sammy Omosigho#10 | 5 | 3 | 0 | 2 | 0 | 1 | 0 |
 Ta'Shawn James#27 | 5 | 1 | 0.5 | 0.5 | 1 | 0 | 0 |
 Sahir West#15 | 5 | 1 | 0 | 1 | 0 | 0 | 0 |
 Cole Cogshell#24 | 3 | 3 | 0 | 0 | 0 | 0 | 0 |
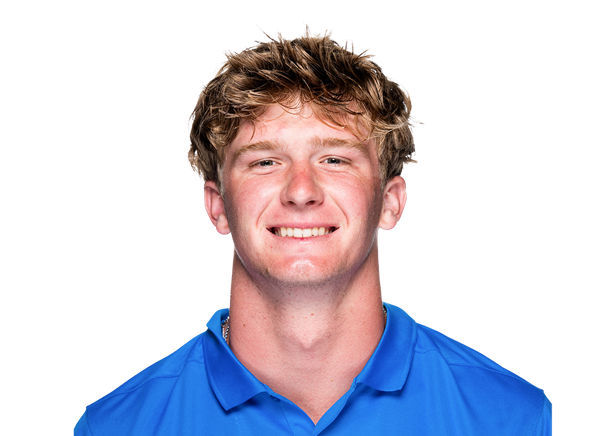 Scott Taylor#20 | 3 | 2 | 0.5 | 0.5 | 0 | 0 | 0 |
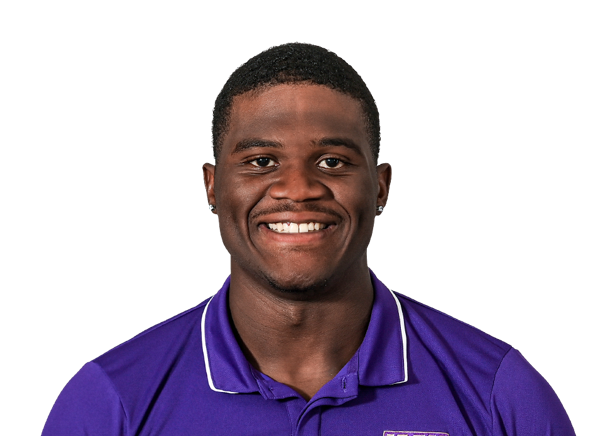 Trent Hendrick#25 | 3 | 0 | 0 | 0 | 0 | 0 | 0 |
 Darold DeNgohe#92 | 3 | 0 | 0 | 0 | 0 | 0 | 0 |
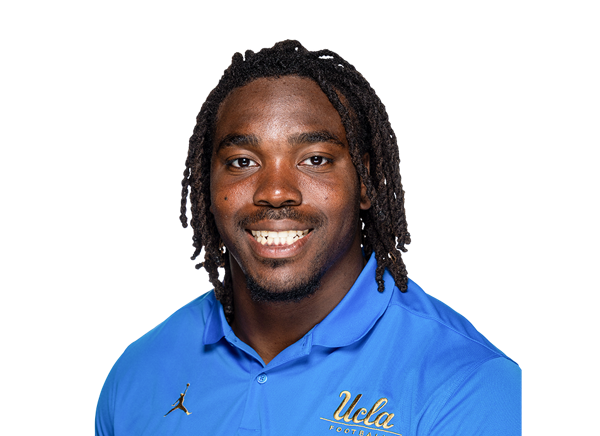 Amier Washington#90 | 3 | 0 | 0 | 0.5 | 0 | 0 | 0 |
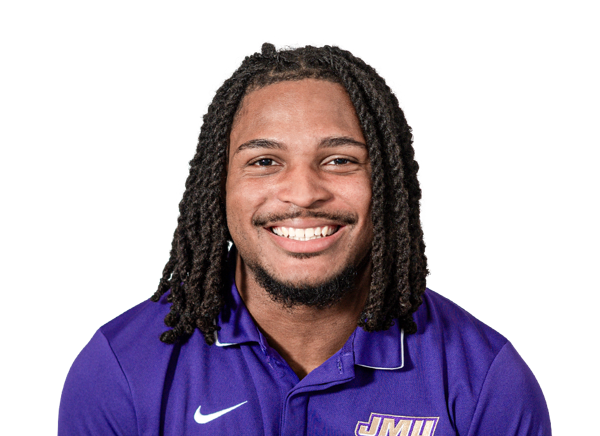 Derrick Barksdale#32 | 3 | 0 | 0 | 0 | 1 | 0 | 0 |
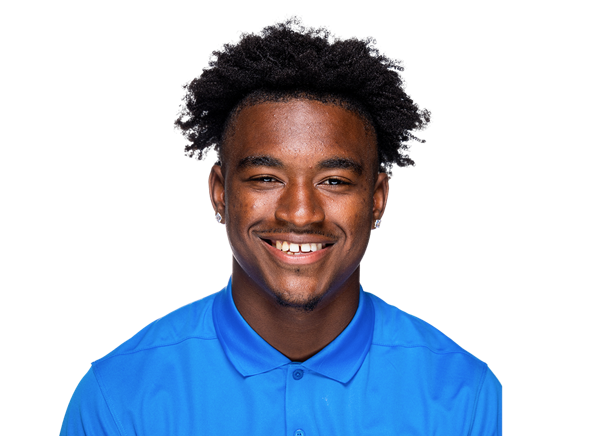 Rodrick Pleasant#2 | 2 | 1 | 0 | 0 | 0 | 0 | 0 |
 Dante Lovett#21 | 2 | 1 | 0 | 0 | 0 | 0 | 0 |
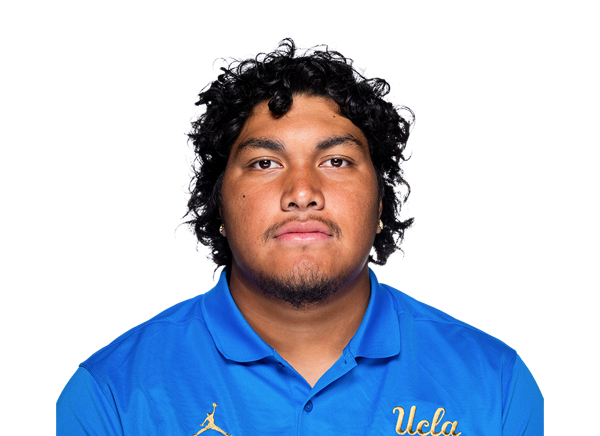 A.J. Fuimaono#55 | 2 | 0 | 0 | 0 | 0 | 0 | 0 |
 Anthony Sacca#39 | 2 | 0 | 0 | 0 | 0 | 0 | 0 |
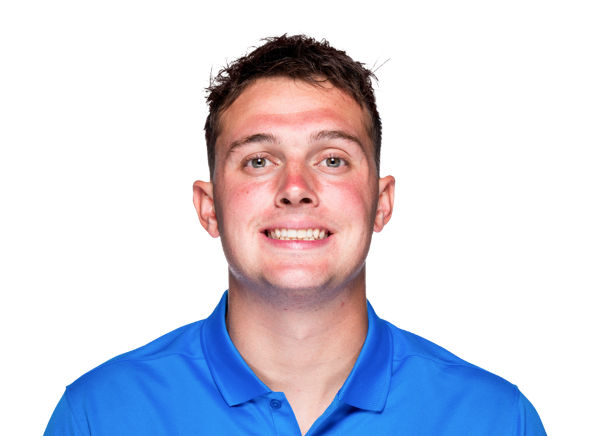 Brayden Loftin#85 | 1 | 1 | 0 | 0 | 0 | 0 | 0 |
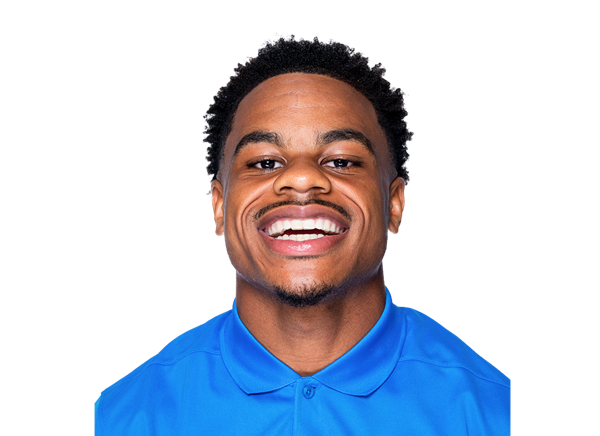 Cole Martin#4 | 1 | 1 | 0 | 0 | 0 | 0 | 0 |
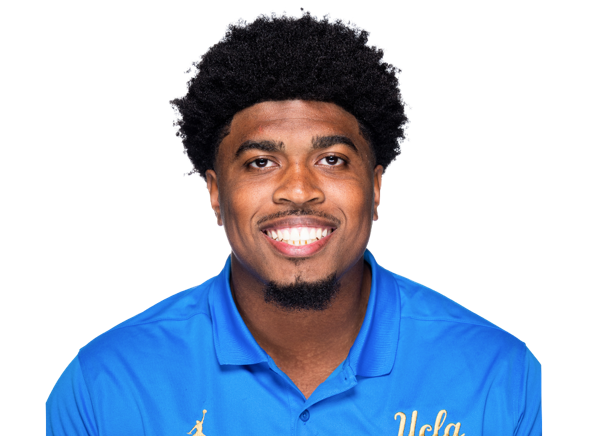 Tyson Ford#95 | 1 | 0 | 0 | 0 | 0 | 0 | 0 |
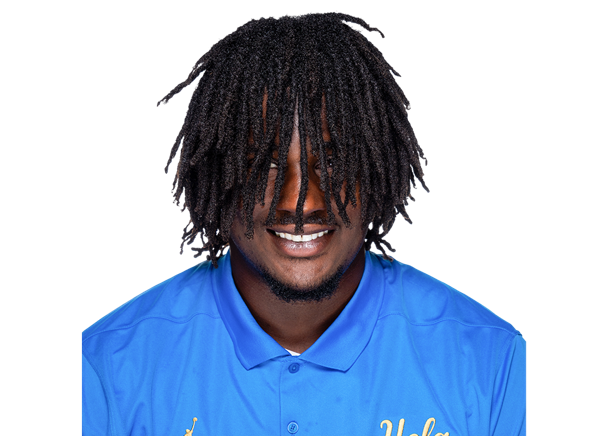 Ashton Sanders#44 | 1 | 0 | 0 | 0 | 0 | 0 | 0 |
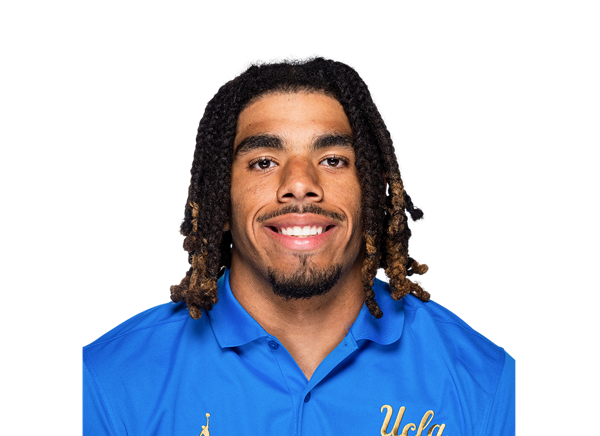 Donavyn Pellot | 1 | 0 | 0 | 0 | 0 | 0 | 0 |
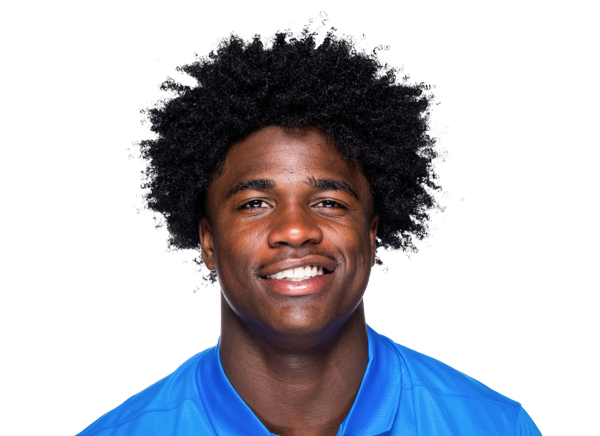 Scooter Jackson#1 | 1 | 0 | 0 | 0 | 0 | 0 | 0 |
 Ryan McCulloch#19 | 1 | 0 | 0 | 0 | 0 | 0 | 0 |
San Diego State| Player | FUM | LOST | REC |
|---|---|---|---|
| Nathan Acevedo#3 | 1 | 0 | 0 |
San Diego State| Player | FG | PCT | LONG | XP | PTS |
|---|---|---|---|---|---|
| Cooper DiLeva#96 | 1/1 | 100.0 | 46 | 1/1 | 4 |
UCLA| Player | FG | PCT | LONG | XP | PTS |
|---|---|---|---|---|---|
 Mateen Bhaghani#15 | 0/0 | 0.0 | 0 | 4/4 | 4 |
San Diego State| Player | NO | YDS | AVG | TB | In 20 | LONG |
|---|---|---|---|---|---|---|
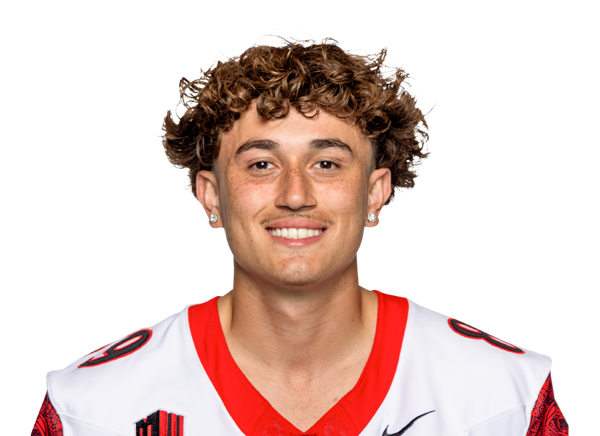 Tashi Dorje#89 | 7 | 350 | 50.0 | 1 | 1 | 77 |
UCLA| Player | NO | YDS | AVG | TB | In 20 | LONG |
|---|---|---|---|---|---|---|
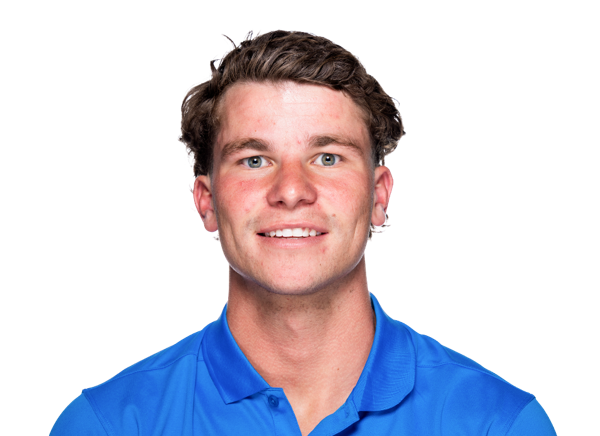 Curtis Gerrand#35 | 4 | 199 | 49.8 | 0 | 2 | 55 |
San Diego State| Player | NO | YDS | AVG | LONG | TD |
|---|---|---|---|---|---|
| Nathan Acevedo#3 | 4 | 30 | 7.5 | 16 | 0 |
UCLA| Player | NO | YDS | AVG | LONG | TD |
|---|---|---|---|---|---|
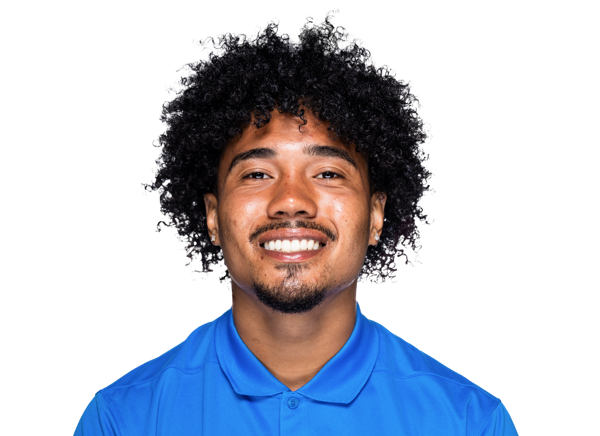 Mikey Matthews#7 | 3 | 41 | 13.7 | 22 | 0 |
| Semaj Morgan#4 | 1 | 25 | 25.0 | 25 | 0 |
San Diego State| Player | INT | YDS | TD |
|---|---|---|---|
| Mike Lindsay#27 | 1 | 2 | 0 |
UCLA| Player | INT | YDS | TD |
|---|---|---|---|
| Jalen Woods#9 | 1 | 0 | 0 |
Drive Summary
UCLA
Punt
65
SDSU
Punt
27
UCLA
Punt
23
SDSU
Punt
30
UCLA
Interception
78
SDSU
Punt
2
UCLA
Downs
23
SDSU
Punt
2
UCLA
End Of Half
10
SDSU
Punt
-3
UCLA
Touchdown
43
SDSU
Punt
0
UCLA
Punt
13
SDSU
Punt
28
UCLA
Punt
16
SDSU
Field Goal
48
UCLA
Touchdown
75
SDSU
Interception
-2
UCLA
Touchdown
19
SDSU
Touchdown
65
UCLA
Touchdown
6
SDSU
Downs
7
UCLA
End Of Quarter
-1
Injury Report
No current injury report is available for this matchup.
Head-to-Head
Historical meetings are not available for this matchup.
Game Information
StageWeek 2
Season2026
KickoffSat, Sep 12, 7:15 pm
VenueRose Bowl
LocationPasadena, CA
SurfaceGrass
BroadcastBTN
Division Standings
FBS — Pac-12 Conference
| Team | W | L | T | Pct | PF | PA | Home | Away | Strk |
|---|---|---|---|---|---|---|---|---|---|
 Colorado State | 3 | 6 | 0 | 0.333 | 322 | 403 | 3-3 | 0-3 | L2 |
 Boise State | 9 | 1 | 0 | 0.900 | 397 | 268 | 5-0 | 4-1 | W9 |
| San Diego State | 4 | 5 | 0 | 0.444 | 238 | 309 | 4-1 | 0-4 | W1 |
 Fresno State | 5 | 5 | 0 | 0.500 | 276 | 222 | 3-1 | 2-4 | L2 |
 Oregon State | 5 | 5 | 0 | 0.500 | 383 | 288 | 3-2 | 2-3 | L3 |
 Texas State | 6 | 4 | 0 | 0.600 | 384 | 312 | 5-1 | 1-3 | W2 |
 Utah State | 4 | 5 | 0 | 0.444 | 152 | 185 | 4-1 | 0-4 | W2 |
 Washington State | 1 | 8 | 0 | 0.111 | 171 | 247 | 1-3 | 0-5 | L6 |
FBS — Big Ten Conference
| Team | W | L | T | Pct | PF | PA | Home | Away | Strk |
|---|---|---|---|---|---|---|---|---|---|
 Indiana | 9 | 1 | 0 | 0.900 | 319 | 125 | 6-1 | 3-0 | W3 |
 Maryland | 4 | 6 | 0 | 0.400 | 273 | 303 | 2-4 | 2-2 | W2 |
 Michigan | 5 | 5 | 0 | 0.500 | 183 | 177 | 4-3 | 1-2 | L2 |
 Michigan State | 3 | 7 | 0 | 0.300 | 188 | 233 | 2-4 | 1-3 | L1 |
 Nebraska | 6 | 4 | 0 | 0.600 | 303 | 149 | 4-2 | 2-2 | W1 |
 Penn State | 6 | 4 | 0 | 0.600 | 302 | 188 | 4-2 | 2-2 | W3 |
| UCLA | 10 | 0 | 0 | 1.000 | 324 | 141 | 6-0 | 4-0 | W10 |
 USC | 7 | 3 | 0 | 0.700 | 305 | 245 | 5-1 | 2-2 | L1 |
 Washington | 6 | 4 | 0 | 0.600 | 258 | 211 | 3-3 | 3-1 | W1 |
 Iowa | 8 | 2 | 0 | 0.800 | 278 | 117 | 5-1 | 3-1 | W3 |
 Northwestern | 6 | 4 | 0 | 0.600 | 298 | 202 | 5-1 | 1-3 | L3 |
 Ohio State | 7 | 3 | 0 | 0.700 | 349 | 184 | 5-1 | 2-2 | W1 |
 Illinois | 6 | 4 | 0 | 0.600 | 270 | 229 | 4-2 | 2-2 | L1 |
 Minnesota | 5 | 5 | 0 | 0.500 | 236 | 240 | 4-2 | 1-3 | L3 |
 Oregon | 7 | 3 | 0 | 0.700 | 338 | 206 | 5-1 | 2-2 | W3 |
 Purdue | 3 | 7 | 0 | 0.300 | 272 | 319 | 2-4 | 1-3 | L4 |
 Wisconsin | 6 | 4 | 0 | 0.600 | 241 | 171 | 5-0 | 1-4 | L1 |
 Rutgers | 2 | 8 | 0 | 0.200 | 232 | 323 | 1-5 | 1-3 | L4 |
San Diego State
2nd in Pac-12
VS
UCLA
1st in Big Ten
Quarterbacks & Specialists
#4
Jayden Denegal
#89
Tashi Dorje
#13
Draiden Trudeau
Receivers & Backs
#3
Nathan Acevedo
#14
Donovan Brown
#5
Bert Emanuel Jr.
#15
Jackson Ford
#21
Javion Kinnard
#7
Lucky Sutton
#29
Jordin Thomas
Defensive Line & Linebackers
#11
Krishna Clay
#91
Amari Comier
#42
Cameron Cooper
#15
Oberhiri Eyafe
#6
Malachi Finau
Sione Hala
#21
Tano Letuli
#95
Gavriel Lightfoot
#33
Brady Nassar
#45
Djibril Rahman
#18
Kai Wallin
Defensive Backs
#24
Josiah Cox
#22
Max Garrison
#14
Isaiah Green
#29
Josh Hunter
#35
Tainoa Lave
#27
Mike Lindsay
#20
Jelani McLaughlin
#16
Jelani Whitmore
Other
#96
Cooper DiLeva
Quarterbacks & Specialists
#35
Curtis Gerrand
#9
Nico Iamaleava
Receivers & Backs
#3
Wayne Knight
#85
Brayden Loftin
#7
Mikey Matthews
#4
Semaj Morgan
#2
Brian Rowe Jr.
#86
Jalen Saint Paul
#21
Jaivian Thomas
#6
Anthony Woods
Defensive Line & Linebackers
#24
Cole Cogshell
#92
Darold DeNgohe
#95
Tyson Ford
#55
A.J. Fuimaono
#97
Aiden Gobaira
#25
Trent Hendrick
#19
Ryan McCulloch
#10
Sammy Omosigho
Donavyn Pellot
#39
Anthony Sacca
#44
Ashton Sanders
#20
Scott Taylor
#90
Amier Washington
#15
Sahir West
#9
Jalen Woods
Defensive Backs
#32
Derrick Barksdale
#12
Malik Hartford
#1
Scooter Jackson
#27
Ta'Shawn James
#21
Dante Lovett
#4
Cole Martin
#2
Rodrick Pleasant
Other
#15
Mateen Bhaghani
San Diego State
2nd in Pac-12
VS
UCLA
1st in Big Ten
Passing
56.6
Completion Percentage
59.2
154
Completions
155
3.70
Interception Percentage
3.10
10
Interceptions
8
52
Longest Pass
83
1,715
Net Passing Yards
2,221
171.5
Net Passing Yards Per Game
222.1
272
Passing Attempts
262
4.80
Passing Touchdown %
4.60
13
Passing Touchdowns
12
117.9
Passer Rating
139.5
10
Total Sacks
13
66
Sack Yards Lost
104
6.3
Yards Per Pass Attempt
8.5
1,715
Passing Yards
2,221
0
Passing Fumbles Lost
0
10
Team Games Played
10
333.1
Yards Per Game
424.8
26.8
Total Points Per Game
32.4
268
Total Points
324
32
Total Touchdowns
41
171.5
Passing Yards Per Game
222.1
154-272
Comp-Att
155-262
10-66
Sacks-Yards Lost
13-104
Rushing
361
Rushing Attempts
396
1,616
Rushing Yards
2,027
4.5
Yards Per Rush Attempt
5.1
67
Long Rushing
63
0
20+ Yard Rushing Plays
0
15
Rushing Touchdowns
26
161.6
Rushing Yards Per Game
202.7
0
Rushing Fumbles
0
0
Rushing Fumbles Lost
0
86
Rushing 1st downs
97
10
Team Games Played
10
3,331
Total Yards
4,248
643
Total Offensive Plays
671
26.8
Total Points Per Game
32.4
268
Total Points
324
32
Total Touchdowns
41
Receiving
154
Receptions
155
0
Receiving Targets
0
1,715
Receiving Yards
2,221
1,715
Receiving Yards
2,221
13
Receiving Touchdowns
12
52
Long Reception
83
0
20+ Yard Receiving Plays
0
171.5
Receiving Yards Per Game
222.1
0
Receiving Fumbles
0
0
Receiving Fumbles Lost
0
817
Receiving Yards After Catch
1104
69
Receiving First Downs
80
10
Team Games Played
10
11.1
Yards Per Reception
14.3
26.8
Total Points Per Game
32.4
268
Total Points
324
32
Total Touchdowns
41
Miscellaneous
173
Total 1st downs
201
86
Rushing 1st downs
97
69
Passing 1st downs
80
18
1st downs by penalty
24
48
Third Down Conversions
62
132
Third Down Attempts
138
36.36
3rd down %
44.93
7
Fourth Down Conversions
2
16
First Downs Attempts
10
43.75
4th down %
20.00
54
Total Penalties
78
470
Total Penalty Yards
707
15554
Possession Time Seconds
19347
0.00
Red Zone Field Goal Percentage
0.00
0.00
Red Zone Scoring Percentage
0.00
0.00
Red Zone Efficiency Percentage
0.00
0.00
Red Zone Touchdown Percentage
0.00
14
Total Takeaways
18
14
Total Giveaways
14
0
Turnover Ratio
4
0
Fumbles Lost
0
48-132
3rd down efficiency
62-138
7-16
4th down efficiency
2-10
54-470
Total-Yards
78-707
Defense
411
Solo Tackles
324
358
Assist Tackles
264
769
Total Tackles
588
22
Sacks
22
146
Sack Yards
151
62
Stuffs
85
38
Passes Defended
37
10.4
Average Interception Yards
17.7
32
Long Interception
67
0
Miscellaneous Touchdowns
0
3
Kicks Blocked
3
40
Tackles For Loss
42
10
Team Games Played
10
Defensive Interceptions
7
Interceptions
20
73
Interception Yards
353
1
Interception Touchdowns
3
7-73
INT: Total
20-353
General
6
Fumbles
11
6
Forced Fumbles
10
4
Fumbles Recovered
10
0
Fumbles Touchdowns
0
10
Games Played
10
6-0
Fumbles-Lost
11-0
Returning
31
Kick Returns
12
854
Kick Return Yards
227
27.5
Yards Per Kick Return
18.9
100
Long Kick Return
29
3
Kick Return Touchdowns
0
18
Punt Returns
18
137
Punt Return Yards
159
7.6
Yards Per Punt Return
8.8
24
Long Punt Return
25
0
Punt Return Touchdowns
0
0
Punt Return Fair Catches
0
0
Kick Return Fumbles Lost
0
0
Punt Return Fumbles Lost
0
10
Team Games Played
10
18-137
Punt: Total
18-159
Kicking
15
Field Goal Made
12
16
Field Goal Attempts
16
93.8
Field Goal Percentage
75.0
53
Long Field Goal Made
40
0
Field Goal Attempts 1-19
0
1
Field Goal Attempts 20-29
5
7
Field Goal Attempts 30-39
7
7
Field Goal Attempts 40-49
2
1
Field Goal Attempts 50+
2
27
Extra Points Made
40
27
Extra Point Attempts
40
100.0
Extra Point Percentage
100.0
0
Field Goals Made 1-19
0
1
Field Goals Made 20-29
4
7
Field Goals Made 30-39
7
6
Field Goals Made 40-49
1
1
Field Goals Made 50+
0
72
Total Kicking Points
76
10
Team Games Played
10
58
Touchback Percentage
68
0.0
Average Kickoff Return Yards
0.0
0
Kickoff Return Yards
0
0
Kickoff Returns
0
0-0
Kickoffs: Total
0-0
15-16
FG: Good-Attempts
12-16
Punting
44
Punts
42
2,016
Punt Yards
1,839
77
Long Punt
58
45.8
Gross Average Punt Yards
43.8
45.8
Net Average Punt Yards
43.8
0
Punts Blocked
0
13
Punts Inside 20
19
3
Touchbacks
2
9
Fair Catches
14
21
Punt Returns
18
0
Punt Return Yards
0
0.0
Average Punt Return Yards
0.0
10
Team Games Played
10
44-2,016
Punt: Total Yards
42-1,839
Scoring
15
Rushing Touchdowns
26
13
Receiving Touchdowns
12
3
Return Touchdowns
0
31
Total Touchdowns
38
15
Field Goals
12
27
Kick Extra Points
40
2
Total Two Point Conversions
0
268
Total Points
324
26.8
Total Points Per Game
32.4