

SE Louisiana vs South Alabama Live Score (5 Sep, 2026)
Score by Quarter
| Team | Q1 | Q2 | Q3 | Q4 | Final |
|---|---|---|---|---|---|
 SE Louisiana | 7 | 0 | 7 | 0 | 14 |
 South Alabama | 19 | 3 | 10 | 7 | 39 |
Scoring Plays
Q1
13:19
13:19
B. Davenport pass to B. Jenkins for 26 yds, for a TD (D. Little KICK)
Passing Touchdown
0 – 7
Q1
6:07
6:07
D. Little 35 yd FG GOOD
Field Goal Good
0 – 10
Q1
2:38
2:38
T. Dunbar run for 1 yd, for a TD (D. Little KICK)
Rushing Touchdown
0 – 19
Q1
2:32
2:32
K. Lowe pass to L. Shinn for 12 yds, for a TD (D. Talley KICK)
Passing Touchdown
7 – 19
Q2
0:03
0:03
D. Little 30 yd FG GOOD
Field Goal Good
7 – 22
Q3
12:46
12:46
K. Lowe pass to L. Shinn for 7 yds, for a TD (D. Talley KICK)
Passing Touchdown
14 – 22
Q3
7:04
7:04
D. Little 26 yd FG GOOD
Field Goal Good
14 – 25
Q3
4:06
4:06
B. Davenport run for 2 yds, for a TD (D. Little KICK)
Rushing Touchdown
14 – 32
Q4
9:02
9:02
PJ Martin run for 3 yds, for a TD (D. Little KICK)
Rushing Touchdown
14 – 39
Game Leaders
SE LouisianaSouth Alabama
 K. Lowe QB
Passing Yards
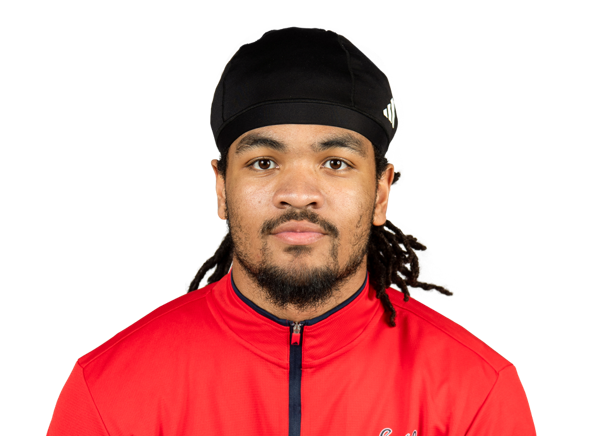 B. Davenport QB
 C. Smith Jr. RB
Rushing Yards
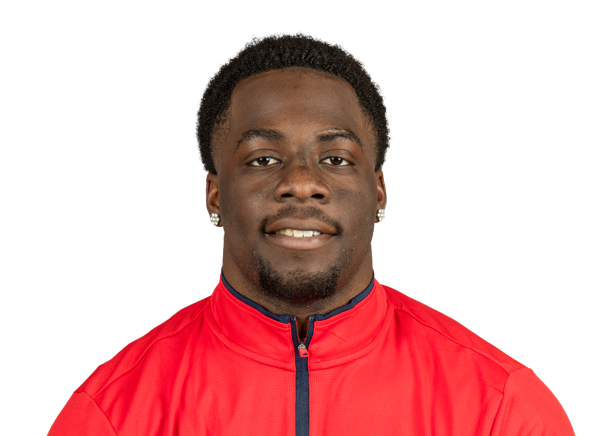 P. Martin RBC. Elzy Jr. RB
Receiving Yards
 B. Jenkins WR
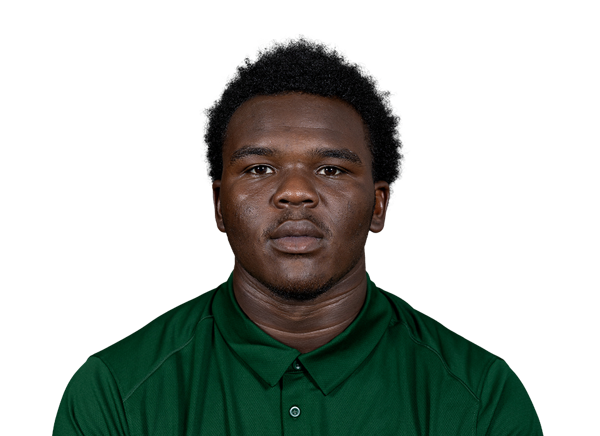 A. Alexander DL
Sacks
 J. Williams LB
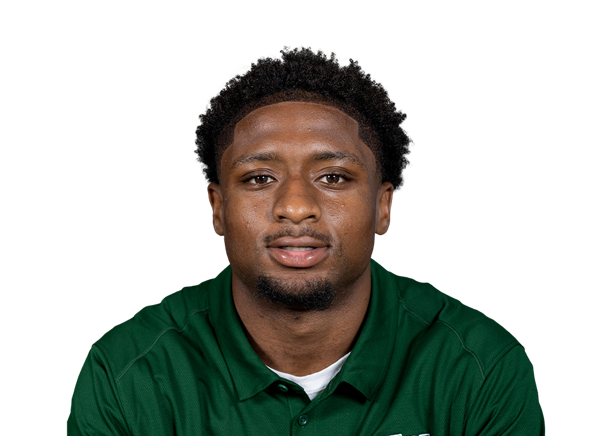 J. Okoye LB
Tackles
 C. Blaylock S
Player Box Score
SE Louisiana| Player | C/ATT | YDS | AVG | TD | INT |
|---|---|---|---|---|---|
| Kyle Lowe#6 | 12/20 | 186 | 9.3 | 2 | 2 |
South Alabama| Player | C/ATT | YDS | AVG | TD | INT |
|---|---|---|---|---|---|
| Bishop Davenport#4 | 18/27 | 154 | 5.7 | 1 | 0 |
SE Louisiana| Player | CAR | YDS | AVG | TD | LONG |
|---|---|---|---|---|---|
| Calvin Smith Jr.#5 | 8 | 38 | 4.8 | 0 | 20 |
 Kyree Paul#2 | 3 | 10 | 3.3 | 0 | 15 |
| Chad Elzy Jr.#33 | 5 | 7 | 1.4 | 0 | 5 |
| Kyle Lowe#6 | 1 | -10 | -10.0 | 0 | 0 |
South Alabama| Player | CAR | YDS | AVG | TD | LONG |
|---|---|---|---|---|---|
| PJ Martin | 18 | 69 | 3.8 | 1 | 12 |
 Keenan Phillips#3 | 13 | 66 | 5.1 | 0 | 16 |
 Trae'von Dunbar#21 | 13 | 60 | 4.6 | 1 | 11 |
| Bishop Davenport#4 | 11 | 23 | 2.1 | 1 | 15 |
 Caleb Wynn#22 | 3 | 22 | 7.3 | 0 | 12 |
 Jared Hollins#7 | 1 | 1 | 1.0 | 0 | 1 |
SE Louisiana| Player | REC | YDS | AVG | TD | LONG |
|---|---|---|---|---|---|
| Chad Elzy Jr.#33 | 2 | 70 | 35.0 | 0 | 54 |
 Lonnie Shinn#88 | 4 | 54 | 13.5 | 2 | 24 |
 Desmen Jefferson#82 | 1 | 23 | 23.0 | 0 | 23 |
 Adyn Wilkinson#85 | 1 | 17 | 17.0 | 0 | 17 |
 Tristan Goodly#4 | 2 | 11 | 5.5 | 0 | 8 |
 Dkhai Joseph#9 | 2 | 11 | 5.5 | 0 | 9 |
South Alabama| Player | REC | YDS | AVG | TD | LONG |
|---|---|---|---|---|---|
| Brendan Jenkins#12 | 5 | 78 | 15.6 | 1 | 26 |
 Jeremiah Jones-Thomas#2 | 5 | 38 | 7.6 | 0 | 13 |
 Micah Woods#6 | 3 | 20 | 6.7 | 0 | 12 |
 Rod Gibbs#9 | 2 | 18 | 9.0 | 0 | 12 |
| PJ Martin | 1 | 2 | 2.0 | 0 | 2 |
| Keenan Phillips#3 | 2 | -2 | -1.0 | 0 | 0 |
SE Louisiana| Player | TOT | SOLO | SACKS | TFL | PD | QB HUR | TD |
|---|---|---|---|---|---|---|---|
 Carter Hanberry#22 | 9 | 4 | 0 | 0 | 0 | 0 | 0 |
| Jordan Okoye#10 | 9 | 3 | 0 | 0.5 | 0 | 0 | 0 |
 Richard McKneely#25 | 7 | 3 | 0 | 1 | 0 | 0 | 0 |
 Carter Byrd#24 | 6 | 3 | 0 | 0.5 | 1 | 0 | 0 |
 Trace Carter#34 | 6 | 1 | 0 | 0 | 0 | 0 | 0 |
 Khalid Moore#45 | 5 | 4 | 0 | 1 | 1 | 0 | 0 |
 Gabe Copeland#44 | 5 | 2 | 0 | 1 | 0 | 0 | 0 |
| Amiree Alexander#54 | 5 | 1 | 1 | 1.5 | 0 | 0 | 0 |
 Gabe Whittington#91 | 5 | 0 | 0 | 0 | 0 | 0 | 0 |
 CJ Fraser#11 | 4 | 3 | 0 | 0 | 2 | 0 | 0 |
 Dayshawn McGee#16 | 4 | 3 | 0 | 0.5 | 0 | 0 | 0 |
 James Harris#48 | 4 | 1 | 0 | 0 | 0 | 0 | 0 |
 Gage Brown#98 | 4 | 1 | 0 | 0 | 0 | 0 | 0 |
 Carlando Crump#12 | 3 | 3 | 0 | 0 | 0 | 0 | 0 |
 Mike Mitchell#20 | 3 | 2 | 0 | 0 | 0 | 0 | 0 |
| Kenneth Ford#21 | 3 | 2 | 0 | 0 | 0 | 0 | 0 |
 Evan Aubrey#40 | 3 | 1 | 0 | 0 | 0 | 0 | 0 |
 Jake Dalmado#7 | 3 | 0 | 0 | 0 | 0 | 0 | 0 |
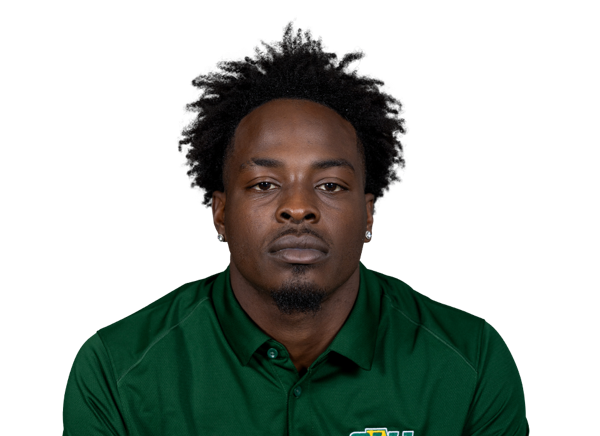 Zay Franks#1 | 2 | 2 | 0 | 0 | 0 | 0 | 0 |
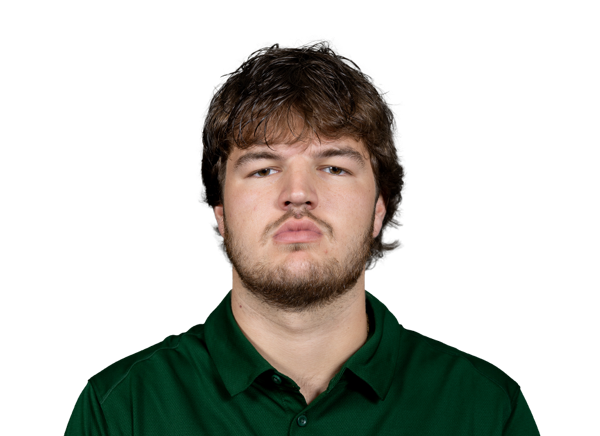 Max Elkman#32 | 2 | 1 | 0 | 0 | 1 | 0 | 0 |
 Jackson Casanova#43 | 2 | 0 | 0 | 0 | 0 | 0 | 0 |
 Colton Shaw#49 | 2 | 0 | 0 | 0 | 0 | 0 | 0 |
| Calvin Smith Jr.#5 | 1 | 1 | 0 | 0 | 0 | 0 | 0 |
 Owen Wiley#27 | 1 | 0 | 0 | 0 | 0 | 0 | 0 |
 Peyton Anderson#90 | 1 | 0 | 0 | 0 | 0 | 0 | 0 |
 Zane Hooper#30 | 1 | 0 | 0 | 0 | 0 | 0 | 0 |
 Otto Brewer III#99 | 1 | 0 | 0 | 0 | 0 | 0 | 0 |
South Alabama| Player | TOT | SOLO | SACKS | TFL | PD | QB HUR | TD |
|---|---|---|---|---|---|---|---|
| Cole Blaylock#14 | 5 | 1 | 0 | 0.5 | 0 | 0 | 0 |
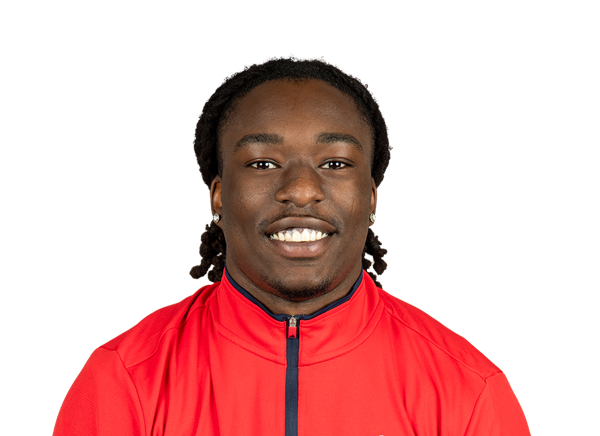 Jayvon Henderson#2 | 4 | 1 | 0 | 0.5 | 0 | 0 | 0 |
 Parker Shattuck#11 | 4 | 1 | 0 | 0 | 0 | 1 | 0 |
| Jordan Williams#48 | 3 | 1 | 1 | 1 | 0 | 0 | 0 |
 E'Mauri Smiley#90 | 3 | 1 | 0 | 1 | 0 | 0 | 0 |
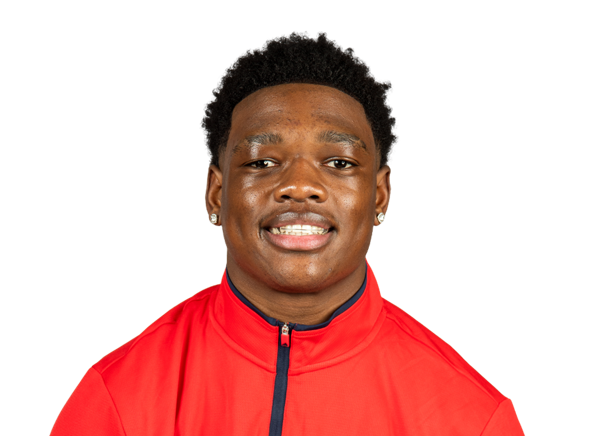 Xavious Anderson Jr.#26 | 3 | 1 | 0 | 0 | 0 | 0 | 0 |
 Jaylen Moson#12 | 2 | 2 | 0 | 0 | 0 | 0 | 0 |
 D.J. Moore#1 | 2 | 1 | 0 | 0 | 0 | 0 | 0 |
 Mase Lewis#18 | 2 | 1 | 0 | 0 | 0 | 0 | 0 |
 Teryn Green#36 | 2 | 1 | 0 | 0 | 0 | 0 | 0 |
 Kam Robinson#13 | 2 | 1 | 0 | 0 | 1 | 0 | 0 |
 Tre'Mon Henry#25 | 2 | 0 | 0 | 0 | 1 | 0 | 0 |
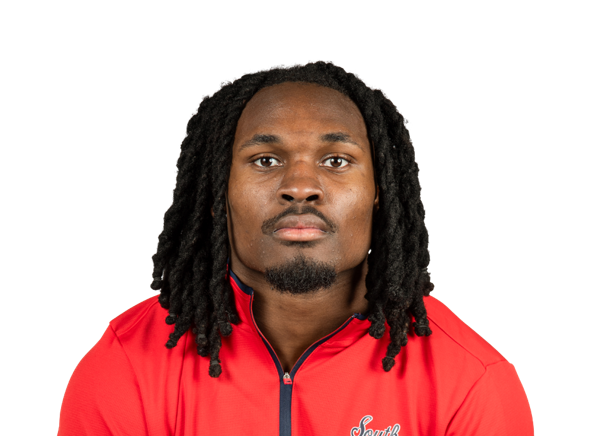 Dallas Young#8 | 2 | 0 | 0 | 0.5 | 1 | 0 | 0 |
 Tyler Carter#41 | 2 | 0 | 0 | 0 | 0 | 0 | 0 |
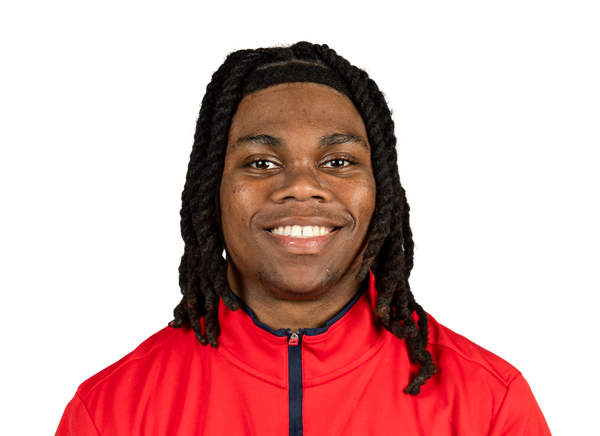 Bradley Thomas#34 | 2 | 0 | 0 | 0 | 0 | 0 | 0 |
 Anthony Eager#1 | 1 | 1 | 0 | 0 | 0 | 0 | 0 |
 Kaleb Jackson#29 | 1 | 1 | 0 | 0 | 0 | 0 | 0 |
 Deuce Vance#7 | 1 | 1 | 0 | 0 | 0 | 0 | 0 |
 Perry Hand#30 | 1 | 1 | 0 | 0 | 0 | 0 | 0 |
 Stephen Johnson#56 | 1 | 0 | 0 | 0 | 0 | 0 | 0 |
 Camen Upshaw#32 | 1 | 0 | 0 | 0 | 0 | 0 | 0 |
 Andrew Hines#94 | 1 | 0 | 0 | 0.5 | 0 | 0 | 0 |
SE Louisiana| Player | FUM | LOST | REC |
|---|---|---|---|
| Team | 1 | 0 | 0 |
| Kyree Paul#2 | 1 | 0 | 0 |
South Alabama| Player | FUM | LOST | REC |
|---|---|---|---|
| Team | 1 | 0 | 0 |
| Bishop Davenport#4 | 1 | 0 | 0 |
SE Louisiana| Player | FG | PCT | LONG | XP | PTS |
|---|---|---|---|---|---|
 Drew Talley#29 | 0/1 | 0.0 | 0 | 2/2 | 2 |
South Alabama| Player | FG | PCT | LONG | XP | PTS |
|---|---|---|---|---|---|
 Davis Little#35 | 3/3 | 100.0 | 35 | 4/4 | 13 |
SE Louisiana| Player | NO | YDS | AVG | TB | In 20 | LONG |
|---|---|---|---|---|---|---|
 Jack Hunter#46 | 3 | 115 | 38.3 | 0 | 2 | 44 |
South Alabama| Player | NO | YDS | AVG | TB | In 20 | LONG |
|---|---|---|---|---|---|---|
 Aleksi Pulkkinen#40 | 1 | 50 | 50.0 | 0 | 0 | 50 |
SE Louisiana| Player | NO | YDS | AVG | LONG | TD |
|---|---|---|---|---|---|
| Kyree Paul#2 | 6 | 93 | 15.5 | 20 | 0 |
South Alabama| Player | NO | YDS | AVG | LONG | TD |
|---|---|---|---|---|---|
| Keenan Phillips#3 | 3 | 91 | 30.3 | 42 | 0 |
SE Louisiana| Player | NO | YDS | AVG | LONG | TD |
|---|---|---|---|---|---|
| Dkhai Joseph#9 | 1 | -1 | -1.0 | 0 | 0 |
South Alabama| Player | INT | YDS | TD |
|---|---|---|---|
| Jaylen Moson#12 | 1 | 12 | 0 |
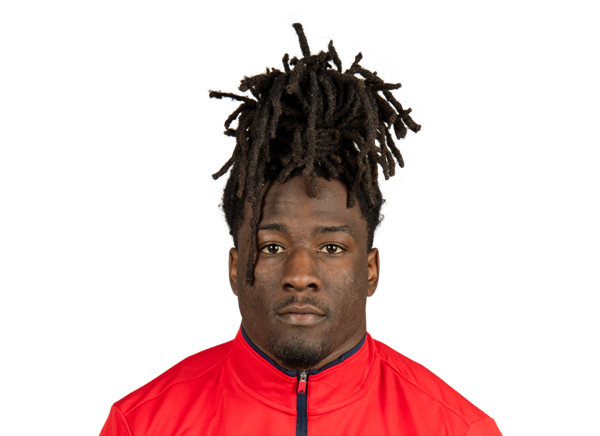 Damyrion Darby#24 | 1 | 0 | 0 |
Drive Summary
USA
Touchdown
55
SELA
Downs
15
USA
Field Goal
45
SELA
Downs
3
USA
Touchdown
50
SELA
Touchdown
76
USA
Downs
26
SELA
Missed FG
19
USA
Downs
19
SELA
7
USA
Punt
-1
SELA
Downs
9
USA
Field Goal
30
SELA
Touchdown
65
USA
Field Goal
45
SELA
Interception
5
USA
Touchdown
12
SELA
Punt
-10
USA
Touchdown
57
SELA
Punt
34
USA
End Of Quarter
70
Injury Report
No current injury report is available for this matchup.
Head-to-Head
Historical meetings are not available for this matchup.
Game Information
StageWeek 1
Season2026
KickoffSat, Sep 5, 7:00 pm
VenueHancock Whitney Stadium
LocationMobile, AL
SurfaceGrass
BroadcastESPN+
Division Standings
FCS — Southland Conference
| Team | W | L | T | Pct | PF | PA | Home | Away | Strk |
|---|---|---|---|---|---|---|---|---|---|
 Houston Christian | 0 | 2 | 0 | 0.000 | 17 | 94 | 0-0 | 0-2 | L2 |
 Stephen F. Austin | 0 | 0 | 0 | .000 | 0 | 0 | — | — | — |
 Incarnate Word | 0 | 1 | 0 | 0.000 | 10 | 63 | 0-0 | 0-1 | L1 |
 Lamar | 0 | 1 | 0 | 0.000 | 7 | 38 | 0-0 | 0-1 | L1 |
 Nicholls | 0 | 2 | 0 | 0.000 | 3 | 130 | 0-0 | 0-2 | L2 |
 UT Rio Grande Valley | 0 | 1 | 0 | 0.000 | 16 | 45 | 0-0 | 0-1 | L1 |
 East Texas A&M | 0 | 1 | 0 | 0.000 | 0 | 42 | 0-0 | 0-1 | L1 |
 Northwestern State | 0 | 1 | 0 | 0.000 | 6 | 80 | 0-0 | 0-1 | L1 |
 McNeese | 0 | 1 | 0 | 0.000 | 14 | 63 | 0-0 | 0-1 | L1 |
| SE Louisiana | 1 | 1 | 0 | 0.500 | 52 | 74 | 0-0 | 1-1 | W1 |
SE Louisiana
9th in Southland
VS
South Alabama
4th in Sun Belt
Quarterbacks & Specialists
#46
Jack Hunter
#6
Kyle Lowe
Receivers & Backs
#33
Chad Elzy Jr.
#4
Tristan Goodly
#30
Zane Hooper
#82
Desmen Jefferson
#9
Dkhai Joseph
#2
Kyree Paul
#88
Lonnie Shinn
#5
Calvin Smith Jr.
#85
Adyn Wilkinson
Defensive Line & Linebackers
#54
Amiree Alexander
#90
Peyton Anderson
#40
Evan Aubrey
#99
Otto Brewer III
#98
Gage Brown
#34
Trace Carter
#43
Jackson Casanova
#44
Gabe Copeland
#7
Jake Dalmado
#32
Max Elkman
#22
Carter Hanberry
#48
James Harris
#45
Khalid Moore
#10
Jordan Okoye
#49
Colton Shaw
#91
Gabe Whittington
Defensive Backs
#24
Carter Byrd
#12
Carlando Crump
#21
Kenneth Ford
#1
Zay Franks
#11
CJ Fraser
#16
Dayshawn McGee
#25
Richard McKneely
#20
Mike Mitchell
Other
#29
Drew Talley
#27
Owen Wiley
Quarterbacks & Specialists
#4
Bishop Davenport
#7
Jared Hollins
#40
Aleksi Pulkkinen
Receivers & Backs
#21
Trae'von Dunbar
#1
Anthony Eager
#9
Rod Gibbs
#12
Brendan Jenkins
#2
Jeremiah Jones-Thomas
PJ Martin
#3
Keenan Phillips
#6
Micah Woods
#22
Caleb Wynn
Defensive Line & Linebackers
#26
Xavious Anderson Jr.
#41
Tyler Carter
#30
Perry Hand
#25
Tre'Mon Henry
#94
Andrew Hines
#56
Stephen Johnson
#18
Masey Lewis
#11
Parker Shattuck
#90
E'Mauri Smiley
#48
Jordan Williams
Defensive Backs
#14
Cole Blaylock
#24
Damyrion Darby
#36
Teryn Green
#2
Jayvon Henderson
#29
Kaleb Jackson
#1
D.J. Moore
#12
Jaylen Moson
#13
Kam Robinson
#34
Bradley Thomas
#32
Camen Upshaw
#7
Deuce Vance
#8
Dallas Young
Other
#35
Davis Little
SE Louisiana
5th in Southland
VS
South Alabama
2nd in Sun Belt - West
Passing
62.8
Completion Percentage
58.7
130
Completions
108
3.90
Interception Percentage
1.60
8
Interceptions
3
73
Longest Pass
72
1,387
Net Passing Yards
1,453
173.4
Net Passing Yards Per Game
207.6
207
Passing Attempts
184
5.80
Passing Touchdown %
5.40
12
Passing Touchdowns
10
130.4
Passer Rating
139.8
10
Total Sacks
8
61
Sack Yards Lost
44
6.7
Yards Per Pass Attempt
7.9
1,387
Passing Yards
1,453
0
Passing Fumbles Lost
0
8
Team Games Played
7
339.0
Yards Per Game
421.9
27.9
Total Points Per Game
35.1
223
Total Points
246
29
Total Touchdowns
31
173.4
Passing Yards Per Game
207.6
130-207
Comp-Att
108-184
10-61
Sacks-Yards Lost
8-44
Rushing
278
Rushing Attempts
318
1,325
Rushing Yards
1,500
4.8
Yards Per Rush Attempt
4.7
65
Long Rushing
42
0
20+ Yard Rushing Plays
0
14
Rushing Touchdowns
19
165.6
Rushing Yards Per Game
214.3
0
Rushing Fumbles
0
0
Rushing Fumbles Lost
0
63
Rushing 1st downs
81
8
Team Games Played
7
2,712
Total Yards
2,953
495
Total Offensive Plays
510
27.9
Total Points Per Game
35.1
223
Total Points
246
29
Total Touchdowns
31
Receiving
130
Receptions
108
0
Receiving Targets
0
1,387
Receiving Yards
1,453
1,387
Receiving Yards
1,453
12
Receiving Touchdowns
10
73
Long Reception
72
0
20+ Yard Receiving Plays
0
173.4
Receiving Yards Per Game
207.6
0
Receiving Fumbles
0
0
Receiving Fumbles Lost
0
230
Receiving Yards After Catch
656
60
Receiving First Downs
58
8
Team Games Played
7
10.7
Yards Per Reception
13.5
27.9
Total Points Per Game
35.1
223
Total Points
246
29
Total Touchdowns
31
Miscellaneous
136
Total 1st downs
152
63
Rushing 1st downs
81
60
Passing 1st downs
58
13
1st downs by penalty
12
38
Third Down Conversions
42
102
Third Down Attempts
104
37.25
3rd down %
40.38
9
Fourth Down Conversions
17
18
First Downs Attempts
26
50.00
4th down %
65.38
37
Total Penalties
43
384
Total Penalty Yards
379
13884
Possession Time Seconds
13707
0.00
Red Zone Field Goal Percentage
0.00
0.00
Red Zone Scoring Percentage
0.00
0.00
Red Zone Efficiency Percentage
0.00
0.00
Red Zone Touchdown Percentage
0.00
16
Total Takeaways
9
13
Total Giveaways
4
3
Turnover Ratio
5
0
Fumbles Lost
0
38-102
3rd down efficiency
42-104
9-18
4th down efficiency
17-26
37-384
Total-Yards
43-379
Defense
252
Solo Tackles
204
338
Assist Tackles
226
590
Total Tackles
430
12
Sacks
12
70
Sack Yards
79
51
Stuffs
44
33
Passes Defended
19
9.2
Average Interception Yards
14.5
20
Long Interception
58
0
Miscellaneous Touchdowns
0
0
Kicks Blocked
0
25
Tackles For Loss
19
8
Team Games Played
7
Defensive Interceptions
6
Interceptions
6
55
Interception Yards
87
1
Interception Touchdowns
0
6-55
INT: Total
6-87
General
12
Fumbles
7
4
Forced Fumbles
4
8
Fumbles Recovered
6
0
Fumbles Touchdowns
1
8
Games Played
7
12-0
Fumbles-Lost
7-0
Returning
24
Kick Returns
12
445
Kick Return Yards
307
18.5
Yards Per Kick Return
25.6
54
Long Kick Return
100
0
Kick Return Touchdowns
1
14
Punt Returns
3
308
Punt Return Yards
22
22.0
Yards Per Punt Return
7.3
78
Long Punt Return
14
2
Punt Return Touchdowns
0
0
Punt Return Fair Catches
0
0
Kick Return Fumbles Lost
0
0
Punt Return Fumbles Lost
0
8
Team Games Played
7
14-308
Punt: Total
3-22
Kicking
7
Field Goal Made
9
13
Field Goal Attempts
12
53.8
Field Goal Percentage
75.0
43
Long Field Goal Made
42
0
Field Goal Attempts 1-19
0
2
Field Goal Attempts 20-29
3
3
Field Goal Attempts 30-39
5
6
Field Goal Attempts 40-49
3
2
Field Goal Attempts 50+
1
28
Extra Points Made
29
28
Extra Point Attempts
30
100.0
Extra Point Percentage
96.7
0
Field Goals Made 1-19
0
2
Field Goals Made 20-29
3
3
Field Goals Made 30-39
4
2
Field Goals Made 40-49
2
0
Field Goals Made 50+
0
49
Total Kicking Points
56
8
Team Games Played
7
19
Touchback Percentage
13
0.0
Average Kickoff Return Yards
0.0
0
Kickoff Return Yards
0
0
Kickoff Returns
0
0-0
Kickoffs: Total
0-0
7-13
FG: Good-Attempts
9-12
Punting
27
Punts
21
1,210
Punt Yards
796
70
Long Punt
53
44.8
Gross Average Punt Yards
37.9
44.8
Net Average Punt Yards
37.9
0
Punts Blocked
0
13
Punts Inside 20
9
1
Touchbacks
0
11
Fair Catches
6
8
Punt Returns
4
0
Punt Return Yards
0
0.0
Average Punt Return Yards
0.0
8
Team Games Played
7
27-1,210
Punt: Total Yards
21-796
Scoring
14
Rushing Touchdowns
19
12
Receiving Touchdowns
10
2
Return Touchdowns
1
28
Total Touchdowns
31
7
Field Goals
9
28
Kick Extra Points
29
0
Total Two Point Conversions
1
223
Total Points
246
27.9
Total Points Per Game
35.1