

South Alabama vs Tulane Live Score (12 Sep, 2026)
Score by Quarter
| Team | Q1 | Q2 | Q3 | Q4 | Final |
|---|---|---|---|---|---|
 South Alabama | 10 | 0 | 7 | 7 | 24 |
 Tulane | 0 | 14 | 7 | 7 | 28 |
Scoring Plays
Q1
8:03
8:03
D. Little 40 yd FG GOOD
Field Goal Good
3 – 0
Q1
1:31
1:31
PJ Martin run for 16 yds, for a TD (D. Little KICK)
Rushing Touchdown
10 – 0
Q2
14:57
14:57
J. Daniels run for 2 yds, for a TD (J. Courville KICK)
Rushing Touchdown
10 – 7
Q2
1:55
1:55
J. Daniels run for 3 yds, for a TD (J. Courville KICK)
Rushing Touchdown
10 – 14
Q3
12:17
12:17
B. Davenport pass to A. Eager for 43 yds, for a TD (D. Little KICK)
Passing Touchdown
17 – 14
Q3
4:53
4:53
J. Lucas run for 80 yds, for a TD (J. Courville KICK)
Rushing Touchdown
17 – 21
Q4
11:49
11:49
B. Davenport pass to B. Jenkins for 17 yds, for a TD (D. Little KICK)
Passing Touchdown
24 – 21
Q4
1:17
1:17
K. Semonza pass to D. Hill for 14 yds, for a TD (J. Courville KICK)
Passing Touchdown
24 – 28
Game Leaders
South AlabamaTulane
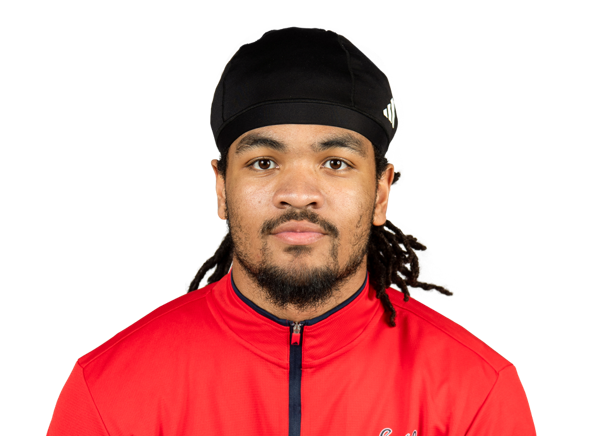 B. Davenport QB
Passing Yards
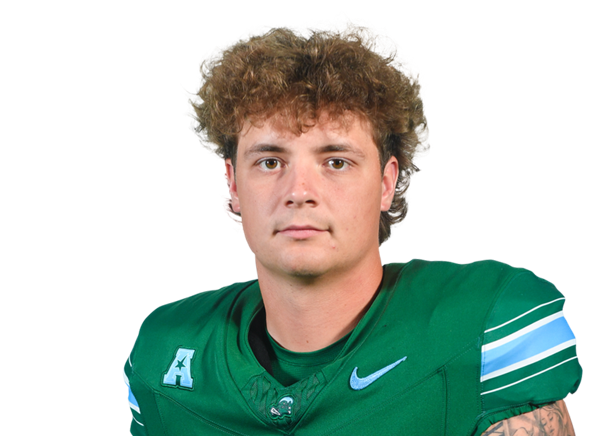 K. Semonza QB
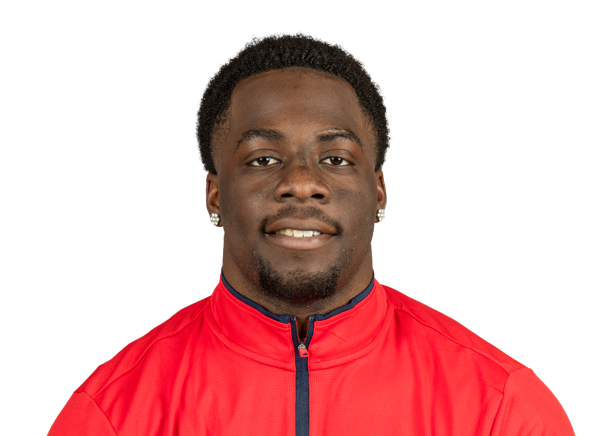 P. Martin RB
Rushing Yards
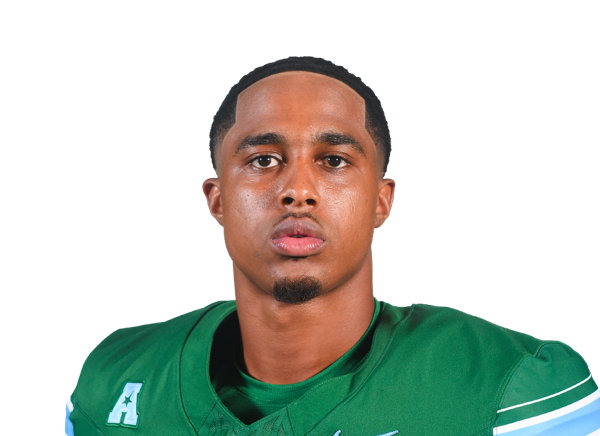 J. Lucas RB
 B. Jenkins WR
Receiving Yards
 D. Hill WR
 S. Johnson DL
Sacks
 K. Hamilton DL
 C. Blaylock S
Tackles
 D. Agu LB
Player Box Score
South Alabama| Player | C/ATT | YDS | AVG | TD | INT |
|---|---|---|---|---|---|
| Bishop Davenport#4 | 22/32 | 296 | 9.3 | 2 | 0 |
Tulane| Player | C/ATT | YDS | AVG | TD | INT |
|---|---|---|---|---|---|
| Kadin Semonza#3 | 14/22 | 212 | 9.6 | 1 | 0 |
South Alabama| Player | CAR | YDS | AVG | TD | LONG |
|---|---|---|---|---|---|
| PJ Martin | 15 | 73 | 4.9 | 1 | 18 |
| Bishop Davenport#4 | 9 | 50 | 5.6 | 0 | 27 |
 Keenan Phillips#3 | 12 | 44 | 3.7 | 0 | 9 |
 Trae'von Dunbar#21 | 4 | 15 | 3.8 | 0 | 7 |
Tulane| Player | CAR | YDS | AVG | TD | LONG |
|---|---|---|---|---|---|
| Jaylin Lucas#12 | 11 | 214 | 19.5 | 1 | 80 |
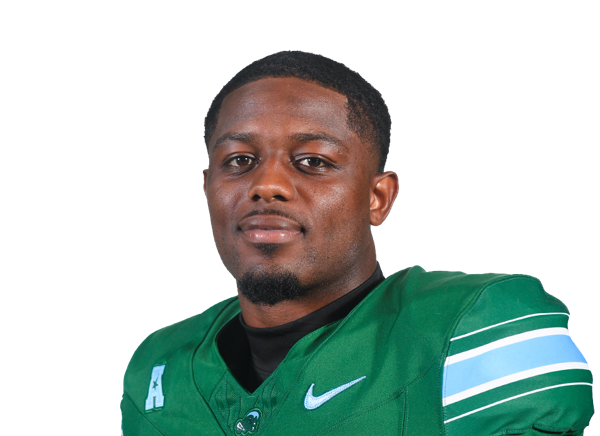 Johnnie Daniels#6 | 6 | 8 | 1.3 | 2 | 3 |
| Kadin Semonza#3 | 5 | 3 | 0.6 | 0 | 4 |
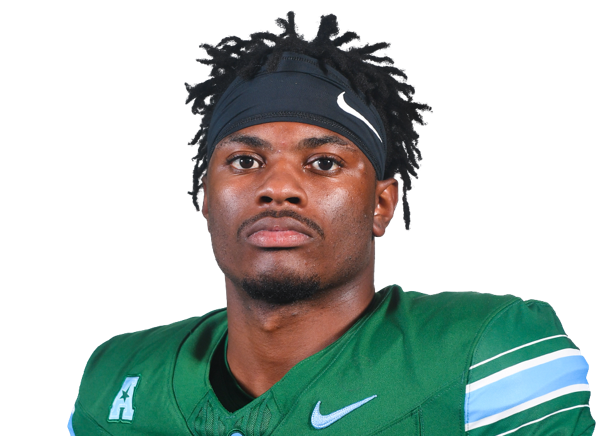 DJ Dugar#21 | 1 | 0 | 0.0 | 0 | 0 |
 Maurice Turner | 3 | -2 | -0.7 | 0 | 1 |
 Team | 3 | -11 | -3.7 | 0 | 11 |
South Alabama| Player | REC | YDS | AVG | TD | LONG |
|---|---|---|---|---|---|
| Brendan Jenkins#12 | 9 | 119 | 13.2 | 1 | 20 |
 Anthony Eager#1 | 2 | 64 | 32.0 | 1 | 43 |
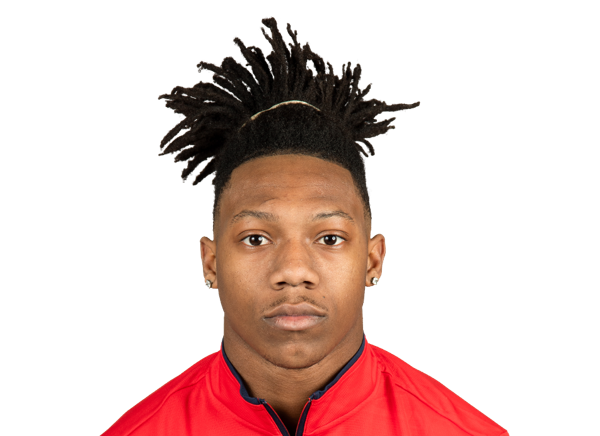 Jeremiah Jones-Thomas#2 | 2 | 33 | 16.5 | 0 | 24 |
| PJ Martin | 4 | 32 | 8.0 | 0 | 27 |
 Micah Woods#6 | 2 | 25 | 12.5 | 0 | 13 |
| Trae'von Dunbar#21 | 1 | 17 | 17.0 | 0 | 17 |
 Rod Gibbs#9 | 1 | 6 | 6.0 | 0 | 6 |
| Keenan Phillips#3 | 1 | 0 | 0.0 | 0 | 0 |
Tulane| Player | REC | YDS | AVG | TD | LONG |
|---|---|---|---|---|---|
| Destyn Hill#2 | 4 | 91 | 22.8 | 1 | 61 |
 Garrett Mmahat#16 | 3 | 40 | 13.3 | 0 | 19 |
 Cash Semonza#84 | 1 | 36 | 36.0 | 0 | 36 |
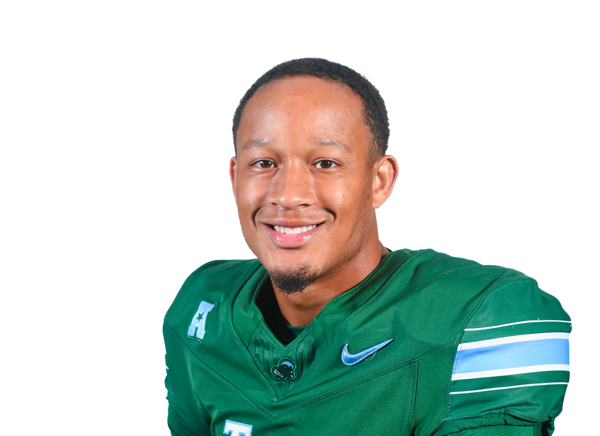 Anthony Brown-Stephens#5 | 1 | 21 | 21.0 | 0 | 21 |
 Bredell Richardson#8 | 1 | 14 | 14.0 | 0 | 14 |
 Ty Thompson#13 | 2 | 8 | 4.0 | 0 | 5 |
 Dawson Johnson#19 | 2 | 2 | 1.0 | 0 | 1 |
South Alabama| Player | TOT | SOLO | SACKS | TFL | PD | QB HUR | TD |
|---|---|---|---|---|---|---|---|
| Cole Blaylock#14 | 7 | 6 | 0 | 2 | 0 | 0 | 0 |
 Dallas Young#8 | 6 | 5 | 0 | 0 | 1 | 0 | 0 |
 Mase Lewis#18 | 5 | 3 | 0 | 0.5 | 0 | 0 | 0 |
 Parker Shattuck#11 | 4 | 4 | 0 | 0 | 0 | 0 | 0 |
 D.J. Moore#1 | 3 | 3 | 0 | 0 | 0 | 0 | 0 |
 Tre'Mon Henry#25 | 3 | 3 | 0 | 0 | 1 | 0 | 0 |
 Jaylen Moson#12 | 3 | 3 | 0 | 0 | 0 | 0 | 0 |
| Stephen Johnson#56 | 3 | 2 | 1 | 1 | 0 | 0 | 0 |
 Jordan Williams#48 | 3 | 2 | 0 | 0 | 0 | 0 | 0 |
 Tyler Carter#41 | 2 | 0 | 0 | 0.5 | 0 | 0 | 0 |
 Jayvon Henderson#2 | 1 | 1 | 0 | 0 | 2 | 0 | 0 |
 Xavious Anderson Jr.#26 | 1 | 1 | 0 | 0 | 0 | 0 | 0 |
| Keenan Phillips#3 | 1 | 1 | 0 | 0 | 0 | 0 | 0 |
Tulane| Player | TOT | SOLO | SACKS | TFL | PD | QB HUR | TD |
|---|---|---|---|---|---|---|---|
| Dickson Agu#2 | 14 | 4 | 0 | 0 | 0 | 0 | 0 |
 Kevin Adams III#7 | 10 | 6 | 0 | 0 | 0 | 0 | 0 |
 Jack Tchienchou#1 | 8 | 4 | 0 | 0 | 1 | 0 | 0 |
 Makai Williams#42 | 8 | 4 | 0 | 2 | 0 | 0 | 0 |
 Anthony Rogers#12 | 5 | 2 | 0 | 0 | 0 | 0 | 0 |
 Reshad Sterling#51 | 4 | 1 | 0.5 | 1.5 | 0 | 0 | 0 |
| Kameron Hamilton#70 | 4 | 0 | 0.5 | 0.5 | 0 | 0 | 0 |
 E'zaiah Shine#5 | 3 | 2 | 0 | 0 | 1 | 0 | 0 |
 Warren Roberts Jr.#40 | 3 | 2 | 0 | 0 | 0 | 0 | 0 |
 Geordan Guidry#96 | 3 | 0 | 0 | 0 | 0 | 0 | 0 |
 Macho Stevenson#21 | 2 | 2 | 0 | 0 | 0 | 0 | 0 |
 Chase Green#27 | 2 | 2 | 0 | 1 | 0 | 0 | 0 |
 Ed Smith IV#45 | 2 | 1 | 0 | 0 | 0 | 0 | 0 |
 Jah'rie Garner#48 | 2 | 1 | 0 | 0 | 0 | 0 | 0 |
 Josh Sims#6 | 2 | 1 | 0 | 0 | 0 | 0 | 0 |
 Dalton Hughes#11 | 1 | 1 | 0 | 0 | 0 | 0 | 0 |
 Kajuan Banks#13 | 1 | 1 | 0 | 0 | 1 | 0 | 0 |
 Chris Rodgers#4 | 1 | 1 | 0 | 0 | 0 | 0 | 0 |
 Armani Cargo#14 | 1 | 1 | 0 | 0 | 0 | 0 | 0 |
 Josh Lewis#99 | 1 | 1 | 0 | 0 | 0 | 0 | 0 |
 Dorion Jackson#26 | 1 | 0 | 0 | 0 | 0 | 0 | 0 |
 TJ Smith#3 | 1 | 0 | 0 | 0 | 0 | 0 | 0 |
South Alabama| Player | FUM | LOST | REC |
|---|---|---|---|
| Keenan Phillips#3 | 1 | 0 | 0 |
Tulane| Player | FUM | LOST | REC |
|---|---|---|---|
| Kadin Semonza#3 | 1 | 0 | 0 |
South Alabama| Player | FG | PCT | LONG | XP | PTS |
|---|---|---|---|---|---|
 Davis Little#35 | 1/2 | 50.0 | 40 | 3/3 | 6 |
Tulane| Player | FG | PCT | LONG | XP | PTS |
|---|---|---|---|---|---|
 Jackson Courville#96 | 0/1 | 0.0 | 0 | 4/4 | 4 |
South Alabama| Player | NO | YDS | AVG | TB | In 20 | LONG |
|---|---|---|---|---|---|---|
 Aleksi Pulkkinen#40 | 2 | 98 | 49.0 | 0 | 1 | 53 |
Tulane| Player | NO | YDS | AVG | TB | In 20 | LONG |
|---|---|---|---|---|---|---|
 William Hudlow#34 | 4 | 184 | 46.0 | 1 | 2 | 57 |
South Alabama| Player | NO | YDS | AVG | LONG | TD |
|---|---|---|---|---|---|
| Keenan Phillips#3 | 2 | 26 | 13.0 | 27 | 0 |
Tulane| Player | NO | YDS | AVG | LONG | TD |
|---|---|---|---|---|---|
| TJ Smith#3 | 2 | 26 | 13.0 | 13 | 0 |
Drive Summary
TULN
Punt
34
USA
Field Goal
63
TULN
Missed FG
57
USA
Touchdown
73
TULN
Touchdown
65
USA
Downs
40
TULN
Punt
19
USA
Punt
30
TULN
Touchdown
95
USA
End Of Half
13
USA
Touchdown
92
TULN
Punt
-8
USA
Missed FG
56
TULN
Touchdown
80
USA
Touchdown
70
TULN
Punt
5
USA
Punt
7
TULN
Touchdown
78
USA
Downs
3
TULN
End Of Quarter
-16
Injury Report
No current injury report is available for this matchup.
Head-to-Head
Historical meetings are not available for this matchup.
Game Information
StageWeek 2
Season2026
KickoffSat, Sep 12, 7:00 pm
VenueYulman Stadium
LocationNew Orleans, LA
SurfaceArtificial Turf
BroadcastESPN+
Division Standings
FBS — American Conference
| Team | W | L | T | Pct | PF | PA | Home | Away | Strk |
|---|---|---|---|---|---|---|---|---|---|
 South Florida | 6 | 3 | 0 | 0.667 | 233 | 136 | 4-1 | 2-2 | L1 |
 Tulsa | 5 | 4 | 0 | 0.556 | 298 | 205 | 2-2 | 3-2 | W1 |
 UTSA | 7 | 2 | 0 | 0.778 | 297 | 268 | 4-0 | 3-2 | L1 |
 Memphis | 7 | 2 | 0 | 0.778 | 338 | 212 | 5-0 | 2-2 | W2 |
 Navy | 3 | 6 | 0 | 0.333 | 263 | 274 | 3-2 | 0-4 | W1 |
 North Texas | 7 | 2 | 0 | 0.778 | 402 | 278 | 5-0 | 2-2 | W6 |
 Rice | 1 | 8 | 0 | 0.111 | 191 | 306 | 1-3 | 0-5 | L8 |
 Temple | 2 | 7 | 0 | 0.222 | 224 | 255 | 1-4 | 1-3 | L4 |
| Tulane | 4 | 5 | 0 | 0.444 | 190 | 263 | 3-2 | 1-3 | L1 |
 UAB | 5 | 4 | 0 | 0.556 | 196 | 214 | 5-0 | 0-4 | W1 |
 Charlotte | 1 | 8 | 0 | 0.111 | 177 | 345 | 0-4 | 1-4 | L2 |
 Florida Atlantic | 6 | 3 | 0 | 0.667 | 362 | 315 | 5-0 | 1-3 | W1 |
 East Carolina | 5 | 4 | 0 | 0.556 | 212 | 210 | 4-1 | 1-3 | W2 |
 Army | 5 | 4 | 0 | 0.556 | 290 | 228 | 3-2 | 2-2 | L2 |
South Alabama
5th in Sun Belt
VS
Tulane
14th in FBS
Quarterbacks & Specialists
#4
Bishop Davenport
#40
Aleksi Pulkkinen
Receivers & Backs
#21
Trae'von Dunbar
#1
Anthony Eager
#9
Rod Gibbs
#12
Brendan Jenkins
#2
Jeremiah Jones-Thomas
PJ Martin
#3
Keenan Phillips
#6
Micah Woods
Defensive Line & Linebackers
#26
Xavious Anderson Jr.
#41
Tyler Carter
#25
Tre'Mon Henry
#56
Stephen Johnson
#18
Masey Lewis
#11
Parker Shattuck
#48
Jordan Williams
Defensive Backs
#14
Cole Blaylock
#2
Jayvon Henderson
#1
D.J. Moore
#12
Jaylen Moson
#8
Dallas Young
Other
#35
Davis Little
Quarterbacks & Specialists
#34
William Hudlow
#3
Kadin Semonza
Receivers & Backs
#5
Anthony Brown-Stephens
#6
Johnnie Daniels
#21
DJ Dugar
#2
Destyn Hill
#19
Dawson Johnson
#12
Jaylin Lucas
#16
Garrett Mmahat
#8
Bredell Richardson
#84
Cash Semonza
#13
Ty Thompson
Maurice Turner
Defensive Line & Linebackers
#2
Dickson Agu
#48
Jah'rie Garner
#96
Geordan Guidry
#70
Kameron Hamilton
#11
Dalton Hughes
#99
Josh Lewis
#40
Warren Roberts Jr.
#4
Chris Rodgers
#45
Ed Smith IV
#51
Reshad Sterling
#42
Makai Williams
Defensive Backs
#7
Kevin Adams III
#13
Kajuan Banks
#14
Armani Cargo
#27
Chase Green
#26
Dorion Jackson
#12
Anthony Rogers
#5
E'zaiah Shine
#6
Josh Sims
#3
TJ Smith
#21
Macho Stevenson
#1
Jack Tchienchou
Other
#96
Jackson Courville
South Alabama
3rd in Sun Belt - West
VS
Tulane
8th in American
Passing
58.2
Completion Percentage
58.1
138
Completions
151
2.10
Interception Percentage
3.10
5
Interceptions
8
72
Longest Pass
61
1,855
Net Passing Yards
1,739
206.1
Net Passing Yards Per Game
193.2
237
Passing Attempts
260
5.10
Passing Touchdown %
2.70
12
Passing Touchdowns
7
136.2
Passer Rating
117.1
13
Total Sacks
24
78
Sack Yards Lost
179
7.8
Yards Per Pass Attempt
6.7
1,855
Passing Yards
1,739
0
Passing Fumbles Lost
0
9
Team Games Played
9
413.2
Yards Per Game
332.4
32.4
Total Points Per Game
21.1
292
Total Points
190
37
Total Touchdowns
22
206.1
Passing Yards Per Game
193.2
138-237
Comp-Att
151-260
13-78
Sacks-Yards Lost
24-179
Rushing
397
Rushing Attempts
296
1,864
Rushing Yards
1,253
4.7
Yards Per Rush Attempt
4.2
45
Long Rushing
81
0
20+ Yard Rushing Plays
0
22
Rushing Touchdowns
12
207.1
Rushing Yards Per Game
139.2
0
Rushing Fumbles
0
0
Rushing Fumbles Lost
0
100
Rushing 1st downs
59
9
Team Games Played
9
3,719
Total Yards
2,992
647
Total Offensive Plays
580
32.4
Total Points Per Game
21.1
292
Total Points
190
37
Total Touchdowns
22
Receiving
138
Receptions
151
0
Receiving Targets
0
1,855
Receiving Yards
1,739
1,855
Receiving Yards
1,739
12
Receiving Touchdowns
7
72
Long Reception
61
0
20+ Yard Receiving Plays
0
206.1
Receiving Yards Per Game
193.2
0
Receiving Fumbles
0
0
Receiving Fumbles Lost
0
821
Receiving Yards After Catch
782
79
Receiving First Downs
74
9
Team Games Played
9
13.4
Yards Per Reception
11.5
32.4
Total Points Per Game
21.1
292
Total Points
190
37
Total Touchdowns
22
Miscellaneous
193
Total 1st downs
144
100
Rushing 1st downs
59
79
Passing 1st downs
74
13
1st downs by penalty
11
52
Third Down Conversions
47
130
Third Down Attempts
123
40.00
3rd down %
38.21
20
Fourth Down Conversions
5
32
First Downs Attempts
14
62.50
4th down %
35.71
64
Total Penalties
58
544
Total Penalty Yards
460
17410
Possession Time Seconds
14995
0.00
Red Zone Field Goal Percentage
0.00
0.00
Red Zone Scoring Percentage
0.00
0.00
Red Zone Efficiency Percentage
0.00
0.00
Red Zone Touchdown Percentage
0.00
13
Total Takeaways
16
7
Total Giveaways
15
6
Turnover Ratio
1
0
Fumbles Lost
0
52-130
3rd down efficiency
47-123
20-32
4th down efficiency
5-14
64-544
Total-Yards
58-460
Defense
277
Solo Tackles
368
272
Assist Tackles
282
549
Total Tackles
650
17
Sacks
17
102
Sack Yards
100
56
Stuffs
63
23
Passes Defended
25
22.7
Average Interception Yards
23.6
72
Long Interception
76
0
Miscellaneous Touchdowns
0
0
Kicks Blocked
3
25
Tackles For Loss
37
9
Team Games Played
9
Defensive Interceptions
7
Interceptions
5
159
Interception Yards
118
1
Interception Touchdowns
2
7-159
INT: Total
5-118
General
11
Fumbles
13
4
Forced Fumbles
9
8
Fumbles Recovered
8
1
Fumbles Touchdowns
0
9
Games Played
9
11-0
Fumbles-Lost
13-0
Returning
19
Kick Returns
20
495
Kick Return Yards
476
26.1
Yards Per Kick Return
23.8
100
Long Kick Return
95
1
Kick Return Touchdowns
1
4
Punt Returns
13
34
Punt Return Yards
44
8.5
Yards Per Punt Return
3.4
14
Long Punt Return
25
0
Punt Return Touchdowns
0
0
Punt Return Fair Catches
0
0
Kick Return Fumbles Lost
0
0
Punt Return Fumbles Lost
0
9
Team Games Played
9
4-34
Punt: Total
13-44
Kicking
11
Field Goal Made
12
14
Field Goal Attempts
16
78.6
Field Goal Percentage
75.0
50
Long Field Goal Made
58
0
Field Goal Attempts 1-19
0
3
Field Goal Attempts 20-29
4
5
Field Goal Attempts 30-39
4
4
Field Goal Attempts 40-49
5
2
Field Goal Attempts 50+
3
33
Extra Points Made
20
35
Extra Point Attempts
20
94.3
Extra Point Percentage
100.0
0
Field Goals Made 1-19
0
3
Field Goals Made 20-29
4
4
Field Goals Made 30-39
4
3
Field Goals Made 40-49
1
1
Field Goals Made 50+
3
66
Total Kicking Points
56
9
Team Games Played
9
11
Touchback Percentage
74
0.0
Average Kickoff Return Yards
0.0
0
Kickoff Return Yards
0
0
Kickoff Returns
0
0-0
Kickoffs: Total
0-0
11-14
FG: Good-Attempts
12-16
Punting
29
Punts
43
1,093
Punt Yards
1,994
53
Long Punt
72
37.7
Gross Average Punt Yards
46.4
37.7
Net Average Punt Yards
46.4
0
Punts Blocked
0
15
Punts Inside 20
12
0
Touchbacks
5
11
Fair Catches
15
6
Punt Returns
13
0
Punt Return Yards
0
0.0
Average Punt Return Yards
0.0
9
Team Games Played
9
29-1,093
Punt: Total Yards
43-1,994
Scoring
22
Rushing Touchdowns
12
12
Receiving Touchdowns
7
1
Return Touchdowns
1
36
Total Touchdowns
20
11
Field Goals
12
33
Kick Extra Points
20
1
Total Two Point Conversions
1
292
Total Points
190
32.4
Total Points Per Game
21.1