

South Dakota vs Boise State Live Score (20 Sep, 2026)
Score by Quarter
| Team | Q1 | Q2 | Q3 | Q4 | Final |
|---|---|---|---|---|---|
 South Dakota | 7 | 7 | 7 | 3 | 24 |
 Boise State | 7 | 14 | 3 | 14 | 38 |
Scoring Plays
Q1
8:29
8:29
Bryce Cohoon 16 Yd pass from Austyn Modrzewski (Bohdie Ing Kick)
Passing Touchdown
7 – 0
Q1
0:04
0:04
Rasean Jones 9 Yd pass from Maddux Madsen (Canaan Moore Kick)
Passing Touchdown
7 – 7
Q2
13:39
13:39
Tysen Boze 5 Yd pass from Austyn Modrzewski (Bohdie Ing Kick)
Passing Touchdown
14 – 7
Q2
7:41
7:41
Sire Gaines 3 Yd Run (Canaan Moore Kick)
Rush
14 – 14
Q2
2:04
2:04
Cam Bates 4 Yd pass from Maddux Madsen (Canaan Moore Kick)
Passing Touchdown
14 – 21
Q3
8:33
8:33
Canaan Moore 38 Yd Field Goal
Field Goal Good
14 – 24
Q3
2:49
2:49
Tysen Boze 59 Yd pass from Austyn Modrzewski (Bohdie Ing Kick)
Passing Touchdown
21 – 24
Q4
10:33
10:33
Bohdie Ing 43 Yd Field Goal
Field Goal Good
24 – 24
Q4
6:25
6:25
Dylan Riley 2 Yd Run (Canaan Moore Kick)
Rushing Touchdown
24 – 31
Q4
1:33
1:33
Dylan Riley 83 Yd Run (Canaan Moore Kick)
Rushing Touchdown
24 – 38
Game Leaders
South DakotaBoise State
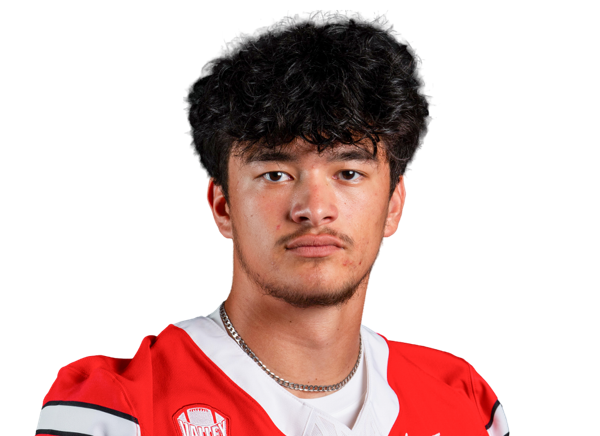 A. Modrzewski QB
Passing Yards
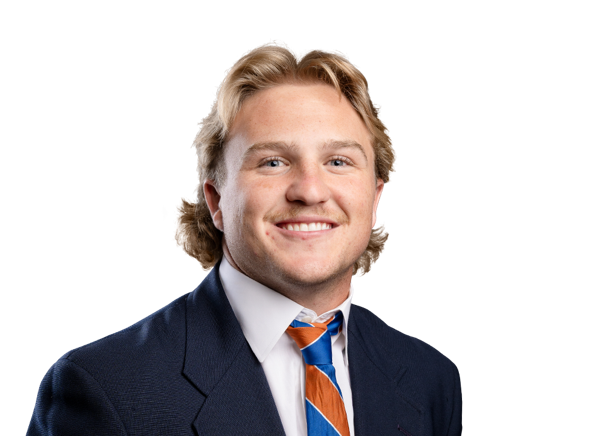 M. Madsen QB
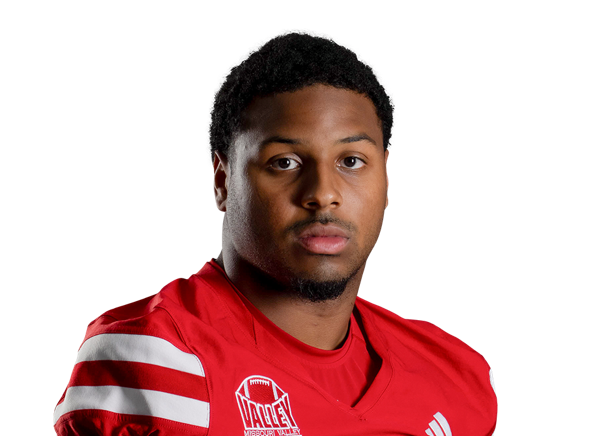 C. Pierre Jr. RB
Rushing Yards
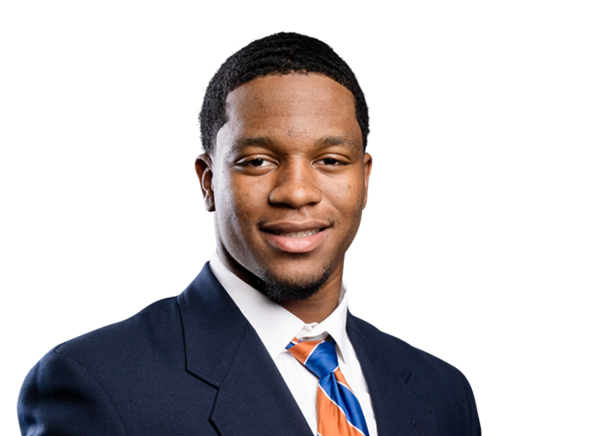 D. Riley RB
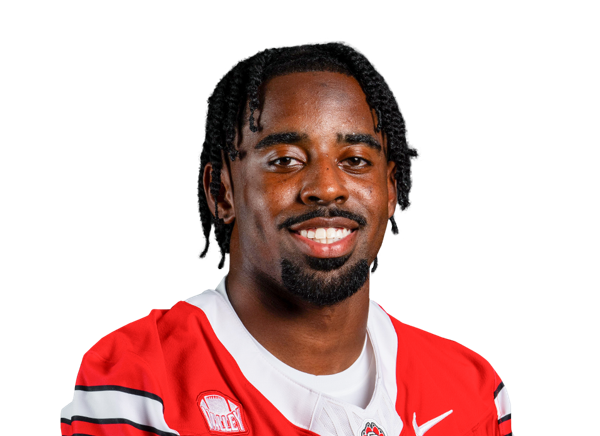 T. Bryant WR
Receiving Yards
 R. Jones WR
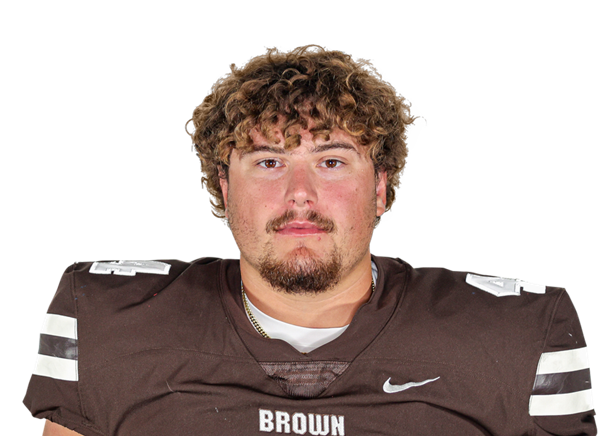 J. Starman DL
Sacks
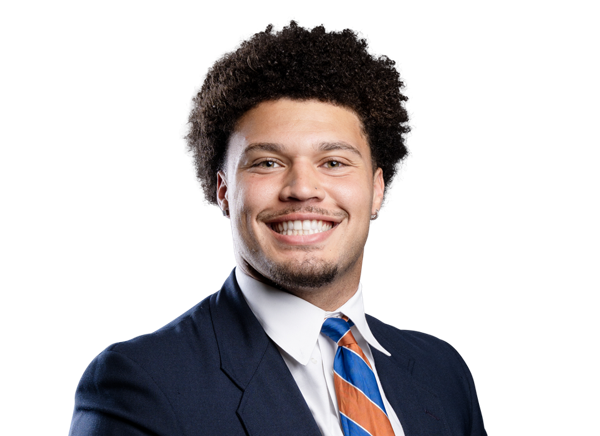 J. Virgin-Morgan LB
 W. Abrams LB
Tackles
 B. Phelps LB
Player Box Score
South Dakota| Player | C/ATT | YDS | AVG | TD | INT |
|---|---|---|---|---|---|
| Austyn Modrzewski#1 | 12/27 | 243 | 9.0 | 3 | 2 |
 Jackson Proctor#12 | 0/1 | 0 | 0.0 | 0 | 0 |
Boise State| Player | C/ATT | YDS | AVG | TD | INT |
|---|---|---|---|---|---|
| Maddux Madsen#4 | 22/31 | 208 | 6.7 | 2 | 0 |
South Dakota| Player | CAR | YDS | AVG | TD | LONG |
|---|---|---|---|---|---|
| Charles Pierre Jr.#3 | 14 | 47 | 3.4 | 0 | 15 |
 Carson Fletcher#33 | 2 | 12 | 6.0 | 0 | 6 |
 Keyondray Jones-Logan#7 | 3 | -4 | -1.3 | 0 | 5 |
| Austyn Modrzewski#1 | 3 | -19 | -6.3 | 0 | 0 |
Boise State| Player | CAR | YDS | AVG | TD | LONG |
|---|---|---|---|---|---|
| Dylan Riley | 26 | 198 | 7.6 | 2 | 83 |
 Sire Gaines#26 | 17 | 102 | 6.0 | 1 | 25 |
| Maddux Madsen#4 | 3 | 19 | 6.3 | 0 | 12 |
| Rasean Jones#19 | 1 | 8 | 8.0 | 0 | 8 |
| Team | 1 | -2 | -2.0 | 0 | 0 |
South Dakota| Player | REC | YDS | AVG | TD | LONG |
|---|---|---|---|---|---|
| Tennel Bryant#9 | 3 | 104 | 34.7 | 0 | 46 |
 Tysen Boze#6 | 3 | 73 | 24.3 | 2 | 59 |
| Charles Pierre Jr.#3 | 2 | 33 | 16.5 | 0 | 29 |
 Bryce Cohoon#4 | 1 | 16 | 16.0 | 1 | 16 |
 Brayden White#2 | 1 | 15 | 15.0 | 0 | 15 |
 Jesse Miller#83 | 1 | 5 | 5.0 | 0 | 5 |
| Keyondray Jones-Logan#7 | 1 | -3 | -3.0 | 0 | 0 |
Boise State| Player | REC | YDS | AVG | TD | LONG |
|---|---|---|---|---|---|
| Rasean Jones#19 | 8 | 95 | 11.9 | 1 | 31 |
 Ben Ford#82 | 3 | 29 | 9.7 | 0 | 17 |
 Akeem Wright#5 | 2 | 23 | 11.5 | 0 | 21 |
| Dylan Riley | 2 | 18 | 9.0 | 0 | 12 |
 Cam Bates#3 | 2 | 14 | 7.0 | 1 | 10 |
 Matt Wagner#88 | 1 | 14 | 14.0 | 0 | 14 |
| Sire Gaines#26 | 3 | 10 | 3.3 | 0 | 7 |
 Darren Morris#13 | 1 | 5 | 5.0 | 0 | 5 |
South Dakota| Player | TOT | SOLO | SACKS | TFL | PD | QB HUR | TD |
|---|---|---|---|---|---|---|---|
| Wade Abrams#49 | 14 | 5 | 0 | 1 | 1 | 1 | 0 |
 RJ Stewart#25 | 9 | 3 | 0 | 0 | 0 | 0 | 0 |
 Harrison Brun#24 | 8 | 3 | 0 | 0 | 0 | 0 | 0 |
 Tim White#9 | 8 | 2 | 0 | 0 | 0 | 0 | 0 |
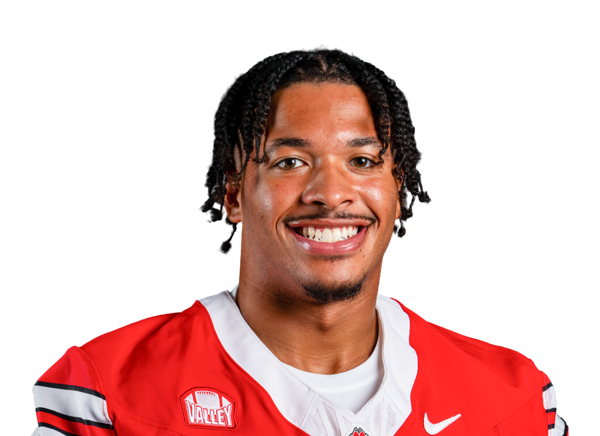 Isaiah Wray#57 | 7 | 1 | 0 | 1 | 0 | 0 | 0 |
 Jaylen Boehm-Peterson#4 | 6 | 4 | 0 | 0 | 0 | 0 | 0 |
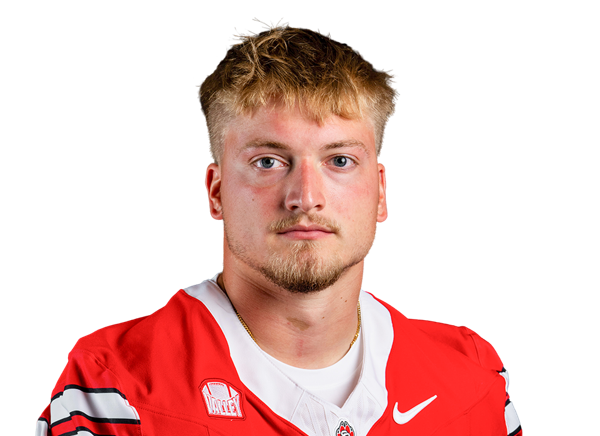 Cain Wallner#11 | 5 | 3 | 0 | 0 | 0 | 0 | 0 |
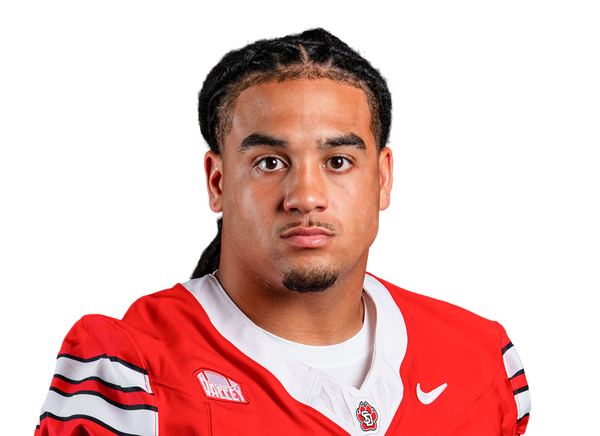 Gabriel Hardman#3 | 5 | 1 | 0 | 1 | 0 | 0 | 0 |
 Chris Dixon#50 | 5 | 0 | 0 | 0 | 0 | 1 | 0 |
| John Starman#44 | 4 | 2 | 1 | 1 | 0 | 0 | 0 |
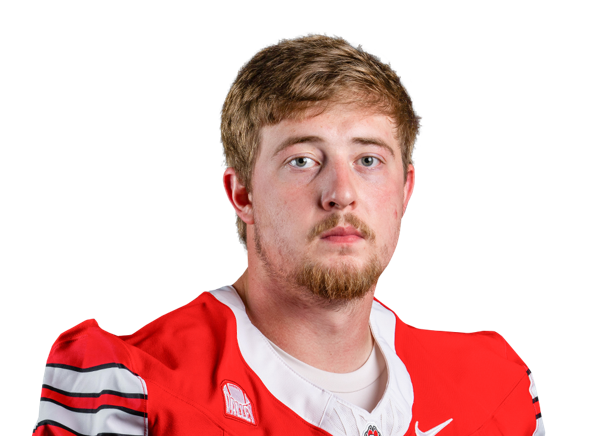 Jeff Bowie#93 | 4 | 2 | 0 | 0 | 0 | 0 | 0 |
 Kael Kolarik#2 | 4 | 2 | 0 | 0 | 0 | 0 | 0 |
 Nathan Laperi#46 | 3 | 1 | 0 | 0 | 0 | 2 | 0 |
 Crew Heier#37 | 2 | 0 | 0 | 0 | 0 | 0 | 0 |
 Dawson Sechser#14 | 1 | 1 | 0 | 0 | 0 | 0 | 0 |
 Asher Tomaszewski#99 | 1 | 0 | 0 | 0 | 0 | 0 | 0 |
 DJ Kennard#31 | 1 | 0 | 0 | 0 | 0 | 0 | 0 |
 Dylan Hudgens#18 | 1 | 0 | 0 | 0 | 0 | 0 | 0 |
Boise State| Player | TOT | SOLO | SACKS | TFL | PD | QB HUR | TD |
|---|---|---|---|---|---|---|---|
| Boen Phelps#1 | 5 | 3 | 0 | 1 | 0 | 1 | 0 |
 Sherrod Smith#8 | 4 | 2 | 0 | 1.5 | 0 | 0 | 0 |
| Kyle Hall#20 | 3 | 3 | 0 | 1 | 1 | 0 | 0 |
| Mikaio Edward#97 | 3 | 0 | 0.5 | 0.5 | 0 | 1 | 0 |
 Max Stege#95 | 2 | 2 | 0 | 0 | 0 | 0 | 0 |
 Lopez Sanusi#96 | 2 | 2 | 0 | 1 | 0 | 0 | 0 |
| Jayden Virgin-Morgan#5 | 2 | 1 | 1 | 1 | 0 | 1 | 0 |
 Michael Madrie#99 | 2 | 1 | 0 | 0.5 | 0 | 0 | 0 |
 JeRico Washington Jr.#6 | 2 | 1 | 0 | 0 | 0 | 0 | 0 |
 Logan Brantley#17 | 2 | 0 | 0 | 0 | 0 | 0 | 0 |
 Travis Anderson#4 | 2 | 0 | 0 | 0 | 1 | 0 | 0 |
 Colton Boomer#35 | 1 | 1 | 0 | 0 | 0 | 0 | 0 |
 Roman Tillmon#22 | 1 | 1 | 0 | 0 | 0 | 0 | 0 |
 Josiah Alanis#33 | 1 | 1 | 0 | 0 | 0 | 0 | 0 |
 Syncere Brackett-Lambey#44 | 1 | 1 | 0 | 0 | 0 | 0 | 0 |
| Madden Soliai#10 | 1 | 1 | 0 | 0 | 0 | 0 | 0 |
 Jake Ripp#43 | 1 | 0 | 0.5 | 0.5 | 1 | 0 | 0 |
 David Latu#92 | 1 | 0 | 0 | 0 | 0 | 1 | 0 |
 Bol Bol#91 | 1 | 0 | 0 | 0 | 0 | 0 | 0 |
| Romeo Carter#80 | 1 | 0 | 0 | 0 | 0 | 0 | 0 |
South Dakota| Player | FUM | LOST | REC |
|---|---|---|---|
| Bryce Cohoon#4 | 0 | 0 | 1 |
| Kael Kolarik#2 | 0 | 0 | 1 |
Boise State| Player | FUM | LOST | REC |
|---|---|---|---|
| Dylan Riley | 1 | 1 | 0 |
| Cam Bates#3 | 1 | 1 | 0 |
South Dakota| Player | FG | PCT | LONG | XP | PTS |
|---|---|---|---|---|---|
| Bohdie Ing#19 | 1/1 | 100.0 | 43 | 3/3 | 6 |
Boise State| Player | FG | PCT | LONG | XP | PTS |
|---|---|---|---|---|---|
| Canaan Moore#48 | 1/1 | 100.0 | 38 | 5/5 | 8 |
South Dakota| Player | NO | YDS | AVG | TB | In 20 | LONG |
|---|---|---|---|---|---|---|
 Brook Honore Jr.#16 | 6 | 260 | 43.3 | 0 | 3 | 58 |
Boise State| Player | NO | YDS | AVG | TB | In 20 | LONG |
|---|---|---|---|---|---|---|
 Oscar Doyle#37 | 2 | 90 | 45.0 | 0 | 0 | 55 |
South Dakota| Player | NO | YDS | AVG | LONG | TD |
|---|---|---|---|---|---|
| Brayden White#2 | 3 | 68 | 22.7 | 29 | 0 |
| Keyondray Jones-Logan#7 | 1 | 17 | 17.0 | 17 | 0 |
Boise State| Player | NO | YDS | AVG | LONG | TD |
|---|---|---|---|---|---|
| Dylan Riley | 1 | 30 | 30.0 | 30 | 0 |
Boise State| Player | NO | YDS | AVG | LONG | TD |
|---|---|---|---|---|---|
| Cam Bates#3 | 1 | -3 | -3.0 | 0 | 0 |
Boise State| Player | INT | YDS | TD |
|---|---|---|---|
| Travis Anderson#4 | 2 | 2 | 0 |
Drive Summary
SDAK
Punt
11
BOIS
Punt
0
SDAK
Punt
5
BOIS
Fumble
-4
SDAK
Touchdown
16
BOIS
Downs
51
SDAK
Punt
4
BOIS
Touchdown
65
SDAK
Touchdown
75
BOIS
Touchdown
70
SDAK
Interception
-1
BOIS
Touchdown
70
SDAK
Punt
29
BOIS
End of Half
8
BOIS
Field Goal
54
SDAK
Punt
19
BOIS
Punt
10
SDAK
Touchdown
55
BOIS
Downs
51
SDAK
Field Goal
51
BOIS
Touchdown
75
SDAK
Punt
-4
SDAK
Downs
18
BOIS
Touchdown
83
SDAK
Interception
-9
BOIS
End of Half
1
Injury Report
No current injury report is available for this matchup.
Head-to-Head
Historical meetings are not available for this matchup.
Game Information
StageWeek 3
Season2026
KickoffSat, Sep 19, 10:00 pm
VenueAlbertsons Stadium
LocationBoise, ID
SurfaceArtificial Turf
BroadcastCBSSN
Attendance34,428
Division Standings
FCS — Missouri Valley Football Conference
| Team | W | L | T | Pct | PF | PA | Home | Away | Strk |
|---|---|---|---|---|---|---|---|---|---|
 South Dakota State | 0 | 1 | 0 | 0.000 | 18 | 34 | 0-0 | 0-1 | L1 |
 Illinois State | 1 | 0 | 0 | 1.000 | 28 | 24 | 0-0 | 1-0 | W1 |
 North Dakota | 0 | 1 | 0 | 0.000 | 7 | 34 | 0-0 | 0-1 | L1 |
| South Dakota | 0 | 1 | 0 | 0.000 | 24 | 38 | 0-0 | 0-1 | L1 |
 Indiana State | 0 | 1 | 0 | 0.000 | 19 | 44 | 0-0 | 0-1 | L1 |
 Southern Illinois | 0 | 1 | 0 | 0.000 | 10 | 48 | 0-0 | 0-1 | L1 |
 Northern Iowa | 0 | 1 | 0 | 0.000 | 0 | 55 | 0-0 | 0-1 | L1 |
 Murray State | 0 | 2 | 0 | 0.000 | 14 | 97 | 0-0 | 0-2 | L2 |
 Youngstown State | 0 | 1 | 0 | 0.000 | 13 | 45 | 0-0 | 0-1 | L1 |
FBS — Pac-12 Conference
| Team | W | L | T | Pct | PF | PA | Home | Away | Strk |
|---|---|---|---|---|---|---|---|---|---|
| Boise State | 8 | 1 | 0 | 0.889 | 351 | 227 | 4-0 | 4-1 | W8 |
 Colorado State | 3 | 6 | 0 | 0.333 | 322 | 403 | 3-3 | 0-3 | L2 |
 Fresno State | 5 | 4 | 0 | 0.556 | 241 | 185 | 3-1 | 2-3 | L1 |
 San Diego State | 4 | 5 | 0 | 0.444 | 238 | 309 | 4-1 | 0-4 | W1 |
 Texas State | 5 | 4 | 0 | 0.556 | 347 | 277 | 4-1 | 1-3 | W1 |
 Washington State | 1 | 8 | 0 | 0.111 | 171 | 247 | 1-3 | 0-5 | L6 |
 Oregon State | 5 | 4 | 0 | 0.556 | 342 | 242 | 3-2 | 2-2 | L2 |
 Utah State | 4 | 5 | 0 | 0.444 | 152 | 185 | 4-1 | 0-4 | W2 |
South Dakota
3rd in MVFC
VS
Boise State
1st in Pac-12
Quarterbacks & Specialists
#16
Brook Honore Jr.
#1
Austyn Modrzewski
#12
Jackson Proctor
Receivers & Backs
#6
Tysen Boze
#9
Tennel Bryant
#4
Bryce Cohoon
#33
Carson Fletcher
#7
Keyondray Jones-Logan
#83
Jesse Miller
#3
Charles Pierre Jr.
#2
Brayden White
Defensive Line & Linebackers
#49
Wade Abrams
#93
Jeff Bowie
#50
Chris Dixon
#3
Gabriel Hardman
#37
Crew Heier
#18
Dylan Hudgens
#46
Nathan Laperi
#44
John Starman
#99
Asher Tomaszewski
#11
Cain Wallner
#57
Isaiah Wray
Defensive Backs
#4
Jaylen Boehm-Peterson
#24
Harrison Brun
#31
DJ Kennard
#2
Kael Kolarik
#14
Dawson Sechser
#25
RJ Stewart
#9
Tim White
Other
#19
Bohdie Ing
Quarterbacks & Specialists
#37
Oscar Doyle
#4
Maddux Madsen
Receivers & Backs
#3
Cam Bates
#80
Romeo Carter
#82
Ben Ford
#26
Sire Gaines
#19
Rasean Jones
#13
Darren Morris
Dylan Riley
#88
Matt Wagner
#5
Akeem Wright
Defensive Line & Linebackers
#91
Bol Bol
#44
Syncere Brackett-Lambey
#17
Logan Brantley
#97
Mikaio Edward
#92
David Latu
#99
Michael Madrie
#1
Boen Phelps
#43
Jake Ripp
#96
Lopez Sanusi
#95
Max Stege
#5
Jayden Virgin-Morgan
Defensive Backs
#33
Josiah Alanis
#4
Travis Anderson
#20
Kyle Hall
#8
Sherrod Smith
#10
Madden Soliai
#22
Roman Tillmon
#6
JeRico Washington Jr.
Other
#35
Colton Boomer
#48
Canaan Moore
South Dakota
3rd in MVFC
VS
Boise State
1st in Pac-12
Passing
67.3
Completion Percentage
67.5
165
Completions
172
2.40
Interception Percentage
0.40
6
Interceptions
1
66
Longest Pass
73
2,187
Net Passing Yards
2,129
218.7
Net Passing Yards Per Game
236.6
245
Passing Attempts
255
11.40
Passing Touchdown %
8.60
28
Passing Touchdowns
22
175.0
Passer Rating
164.9
19
Total Sacks
7
131
Sack Yards Lost
40
8.9
Yards Per Pass Attempt
8.3
2,187
Passing Yards
2,129
0
Passing Fumbles Lost
0
10
Team Games Played
9
394.0
Yards Per Game
473.7
36.0
Total Points Per Game
39.0
360
Total Points
351
48
Total Touchdowns
46
218.7
Passing Yards Per Game
236.6
165-245
Comp-Att
172-255
19-131
Sacks-Yards Lost
7-40
Rushing
363
Rushing Attempts
380
1,753
Rushing Yards
2,134
4.8
Yards Per Rush Attempt
5.6
72
Long Rushing
83
0
20+ Yard Rushing Plays
0
20
Rushing Touchdowns
22
175.3
Rushing Yards Per Game
237.1
0
Rushing Fumbles
0
0
Rushing Fumbles Lost
0
90
Rushing 1st downs
113
10
Team Games Played
9
3,940
Total Yards
4,263
627
Total Offensive Plays
642
36.0
Total Points Per Game
39.0
360
Total Points
351
48
Total Touchdowns
46
Receiving
165
Receptions
172
0
Receiving Targets
0
2,187
Receiving Yards
2,129
2,187
Receiving Yards
2,129
28
Receiving Touchdowns
22
66
Long Reception
73
0
20+ Yard Receiving Plays
0
218.7
Receiving Yards Per Game
236.6
0
Receiving Fumbles
0
0
Receiving Fumbles Lost
0
71
Receiving Yards After Catch
1004
90
Receiving First Downs
95
10
Team Games Played
9
13.3
Yards Per Reception
12.4
36.0
Total Points Per Game
39.0
360
Total Points
351
48
Total Touchdowns
46
Miscellaneous
200
Total 1st downs
223
90
Rushing 1st downs
113
92
Passing 1st downs
95
17
1st downs by penalty
15
50
Third Down Conversions
62
117
Third Down Attempts
116
42.74
3rd down %
53.45
6
Fourth Down Conversions
14
7
First Downs Attempts
19
85.71
4th down %
73.68
55
Total Penalties
49
492
Total Penalty Yards
479
17834
Possession Time Seconds
18990
0.00
Red Zone Field Goal Percentage
0.00
0.00
Red Zone Scoring Percentage
0.00
0.00
Red Zone Efficiency Percentage
0.00
0.00
Red Zone Touchdown Percentage
0.00
17
Total Takeaways
5
10
Total Giveaways
5
7
Turnover Ratio
0
0
Fumbles Lost
0
50-117
3rd down efficiency
62-116
6-7
4th down efficiency
14-19
55-492
Total-Yards
49-479
Defense
370
Solo Tackles
258
280
Assist Tackles
218
650
Total Tackles
476
16
Sacks
20
111
Sack Yards
131
60
Stuffs
68
48
Passes Defended
33
18.3
Average Interception Yards
10.3
44
Long Interception
22
0
Miscellaneous Touchdowns
0
1
Kicks Blocked
1
31
Tackles For Loss
39
10
Team Games Played
9
Defensive Interceptions
4
Interceptions
7
73
Interception Yards
72
0
Interception Touchdowns
1
4-73
INT: Total
7-72
General
11
Fumbles
8
10
Forced Fumbles
0
11
Fumbles Recovered
4
0
Fumbles Touchdowns
0
10
Games Played
9
11-0
Fumbles-Lost
8-0
Returning
20
Kick Returns
8
329
Kick Return Yards
146
16.5
Yards Per Kick Return
18.3
31
Long Kick Return
30
0
Kick Return Touchdowns
0
9
Punt Returns
10
43
Punt Return Yards
73
4.8
Yards Per Punt Return
7.3
17
Long Punt Return
72
0
Punt Return Touchdowns
1
0
Punt Return Fair Catches
0
0
Kick Return Fumbles Lost
0
0
Punt Return Fumbles Lost
0
10
Team Games Played
9
9-43
Punt: Total
10-73
Kicking
9
Field Goal Made
10
10
Field Goal Attempts
11
90.0
Field Goal Percentage
90.9
49
Long Field Goal Made
49
0
Field Goal Attempts 1-19
0
1
Field Goal Attempts 20-29
4
4
Field Goal Attempts 30-39
5
4
Field Goal Attempts 40-49
2
1
Field Goal Attempts 50+
0
45
Extra Points Made
39
47
Extra Point Attempts
39
95.7
Extra Point Percentage
100.0
0
Field Goals Made 1-19
0
1
Field Goals Made 20-29
3
4
Field Goals Made 30-39
5
4
Field Goals Made 40-49
2
0
Field Goals Made 50+
0
72
Total Kicking Points
69
10
Team Games Played
9
52
Touchback Percentage
67
0.0
Average Kickoff Return Yards
0.0
0
Kickoff Return Yards
0
0
Kickoff Returns
0
0-0
Kickoffs: Total
0-0
9-10
FG: Good-Attempts
10-11
Punting
43
Punts
25
2,050
Punt Yards
1,087
72
Long Punt
58
47.7
Gross Average Punt Yards
43.5
47.7
Net Average Punt Yards
43.5
0
Punts Blocked
0
21
Punts Inside 20
9
4
Touchbacks
1
16
Fair Catches
14
10
Punt Returns
4
0
Punt Return Yards
0
0.0
Average Punt Return Yards
0.0
10
Team Games Played
9
43-2,050
Punt: Total Yards
25-1,087
Scoring
20
Rushing Touchdowns
22
28
Receiving Touchdowns
22
0
Return Touchdowns
1
48
Total Touchdowns
45
9
Field Goals
10
45
Kick Extra Points
39
0
Total Two Point Conversions
3
360
Total Points
351
36.0
Total Points Per Game
39.0