

Southern Illinois vs Illinois Live Score (19 Sep, 2026)
Score by Quarter
| Team | Q1 | Q2 | Q3 | Q4 | Final |
|---|---|---|---|---|---|
 Southern Illinois | 7 | 3 | 0 | 0 | 10 |
 Illinois | 14 | 17 | 0 | 17 | 48 |
Scoring Plays
Q1
9:25
9:25
J. Anderson run for 1 yd, for a TD (E. Moczulski KICK)
Rushing Touchdown
0 – 7
Q1
3:46
3:46
DJ Williams pass to A. Middleton for 8 yds, for a TD (W. Schofield KICK)
Passing Touchdown
7 – 7
Q1
2:57
2:57
A. Laughery run for 77 yds, for a TD (E. Moczulski KICK)
Rushing Touchdown
7 – 14
Q2
14:22
14:22
K. Houser pass to C. Dixon for 45 yds, for a TD (E. Moczulski KICK)
Passing Touchdown
7 – 21
Q2
9:44
9:44
K. Houser pass to C. Dixon for 27 yds, for a TD (E. Moczulski KICK)
Passing Touchdown
7 – 28
Q2
2:18
2:18
W. Schofield 27 yd FG GOOD
Field Goal Good
10 – 28
Q2
0:06
0:06
E. Moczulski 36 yd FG GOOD
Field Goal Good
10 – 31
Q4
14:56
14:56
E. Moczulski 42 yd FG GOOD
Field Goal Good
10 – 34
Q4
13:03
13:03
DJ Williams pass intercepted, M. Bailey return for 88 yds, for a TD (E. Moczulski KICK)
Pass Interception Return
10 – 41
Q4
8:38
8:38
J. Barnett run for 5 yds, for a TD (E. Moczulski KICK)
Rushing Touchdown
10 – 48
Game Leaders
Southern IllinoisIllinois
 D. Williams QB
Passing Yards
 K. Houser QBJ. Curry QB
Rushing Yards
 A. Laughery RB
 K. Thomas WR
Receiving Yards
 C. Dixon WR
 L. Bassett DL
Sacks
 J. Barna DLT. Jackson DB
Tackles
 J. Clarke DB
Player Box Score
Southern Illinois| Player | C/ATT | YDS | AVG | TD | INT |
|---|---|---|---|---|---|
| DJ Williams#1 | 20/38 | 182 | 4.8 | 1 | 1 |
| Kyle Thomas#6 | 1/1 | 37 | 37.0 | 0 | 0 |
| Jake Curry#7 | 1/3 | 9 | 3.0 | 0 | 0 |
Illinois| Player | C/ATT | YDS | AVG | TD | INT |
|---|---|---|---|---|---|
| Katin Houser#4 | 23/29 | 305 | 10.5 | 2 | 1 |
Southern Illinois| Player | CAR | YDS | AVG | TD | LONG |
|---|---|---|---|---|---|
| Jake Curry#7 | 4 | 22 | 5.5 | 0 | 7 |
 Markell Quick#11 | 1 | 9 | 9.0 | 0 | 9 |
| DJ Williams#1 | 7 | 7 | 1.0 | 0 | 10 |
| Chandler Chapman#8 | 6 | 6 | 1.0 | 0 | 3 |
| Quade Chatmon#26 | 2 | 4 | 2.0 | 0 | 3 |
| ET Harris#16 | 1 | 1 | 1.0 | 0 | 1 |
| Edward Robinson#4 | 2 | 0 | 0.0 | 0 | 2 |
| Lem Wash#24 | 2 | -2 | -1.0 | 0 | 0 |
| Jayden McCaster#25 | 1 | -2 | -2.0 | 0 | 0 |
| Team | 1 | -16 | -16.0 | 0 | -16 |
Illinois| Player | CAR | YDS | AVG | TD | LONG |
|---|---|---|---|---|---|
| Aidan Laughery#21 | 4 | 93 | 23.3 | 1 | 77 |
 Javari Barnett#24 | 8 | 50 | 6.3 | 1 | 18 |
 Ca'Lil Valentine#5 | 9 | 33 | 3.7 | 0 | 8 |
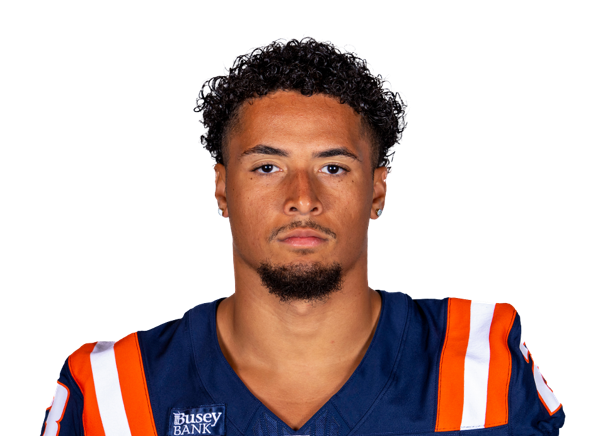 Jordan Anderson#23 | 3 | 11 | 3.7 | 1 | 9 |
 Carson Boyd#2 | 1 | 8 | 8.0 | 0 | 8 |
| Katin Houser#4 | 3 | 3 | 1.0 | 0 | 9 |
Southern Illinois| Player | REC | YDS | AVG | TD | LONG |
|---|---|---|---|---|---|
| Kyle Thomas#6 | 6 | 77 | 12.8 | 0 | 41 |
| Edward Robinson#4 | 1 | 37 | 37.0 | 0 | 37 |
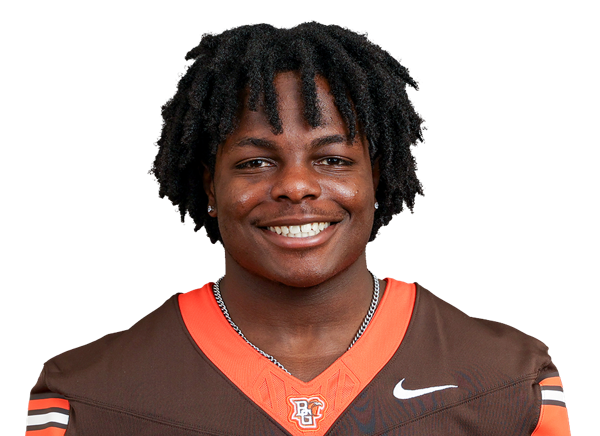 Allen Middleton#5 | 5 | 33 | 6.6 | 1 | 9 |
| Karsen Konkel#87 | 2 | 28 | 14.0 | 0 | 21 |
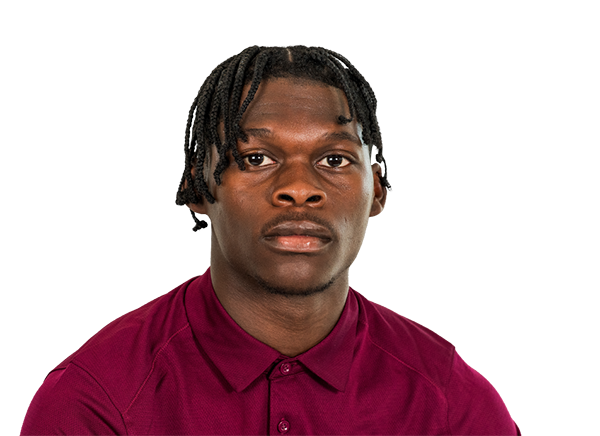 Kam White#88 | 2 | 21 | 10.5 | 0 | 12 |
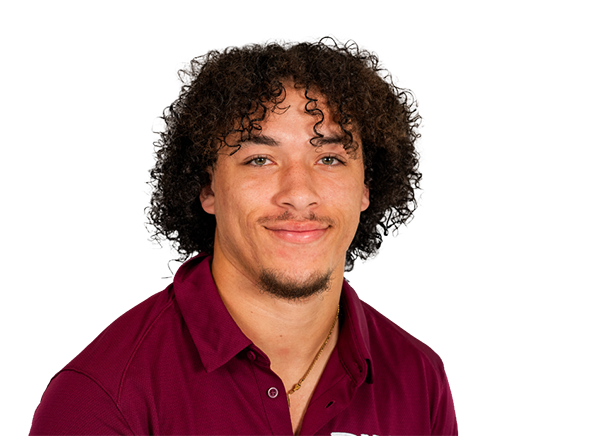 Miles Marshall#47 | 3 | 19 | 6.3 | 0 | 12 |
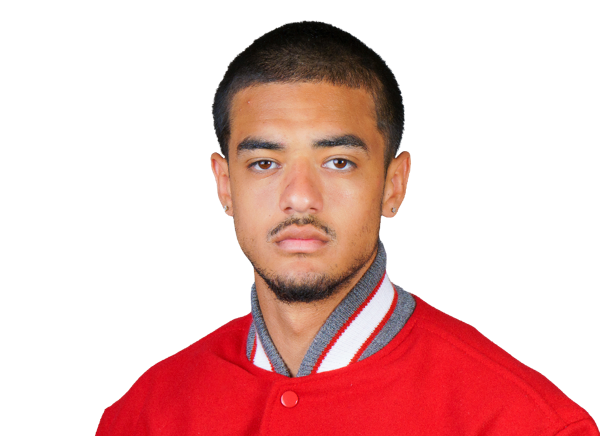 Traivon Dyson#14 | 1 | 7 | 7.0 | 0 | 7 |
| Markell Quick#11 | 1 | 6 | 6.0 | 0 | 6 |
| Quade Chatmon#26 | 1 | 0 | 0.0 | 0 | 0 |
Illinois| Player | REC | YDS | AVG | TD | LONG |
|---|---|---|---|---|---|
| Collin Dixon#17 | 8 | 131 | 16.4 | 2 | 45 |
 Hudson Clement#13 | 5 | 69 | 13.8 | 0 | 23 |
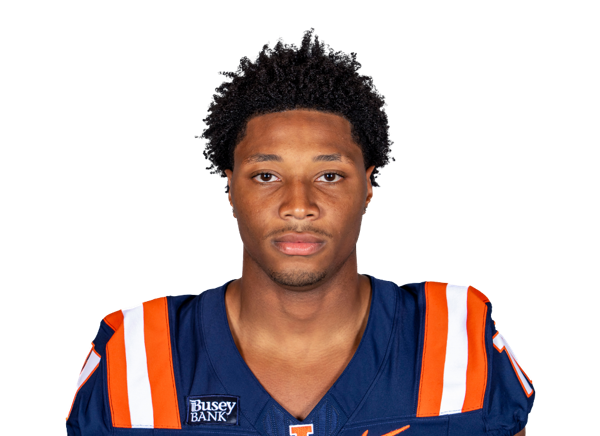 Brayden Trimble#11 | 5 | 57 | 11.4 | 0 | 15 |
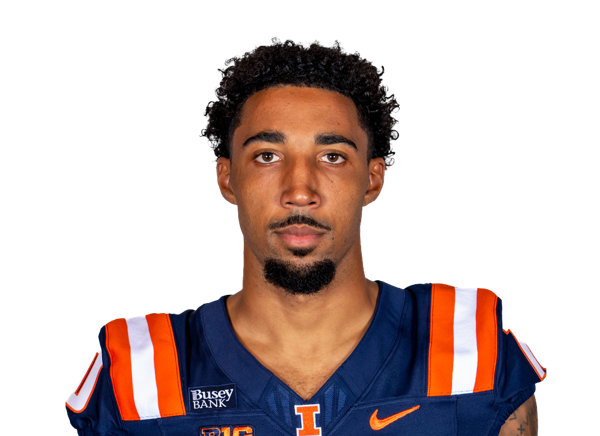 Ty Robinson#10 | 1 | 21 | 21.0 | 0 | 21 |
 Davin Stoffel#88 | 1 | 12 | 12.0 | 0 | 12 |
 Kaden Feagin#83 | 2 | 9 | 4.5 | 0 | 5 |
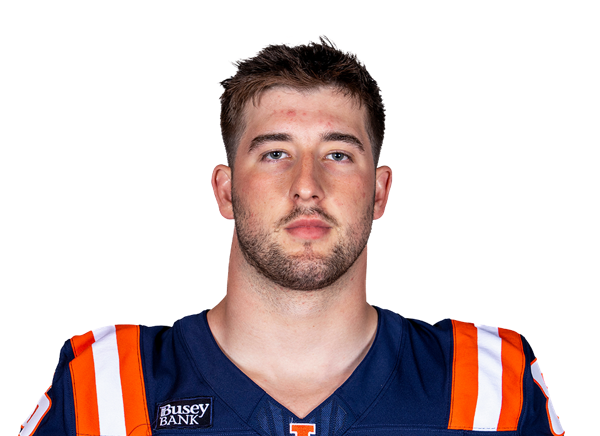 Christian Abney#86 | 1 | 6 | 6.0 | 0 | 6 |
Southern Illinois| Player | TOT | SOLO | SACKS | TFL | PD | QB HUR | TD |
|---|---|---|---|---|---|---|---|
| Te'Nerrean Jackson#12 | 8 | 6 | 0 | 0 | 0 | 0 | 0 |
 Andrew Behm#46 | 6 | 4 | 0 | 0 | 0 | 0 | 0 |
 Chris Presto#6 | 6 | 3 | 0 | 0 | 0 | 0 | 0 |
| Ben Fiegel#45 | 6 | 2 | 0 | 0 | 0 | 0 | 0 |
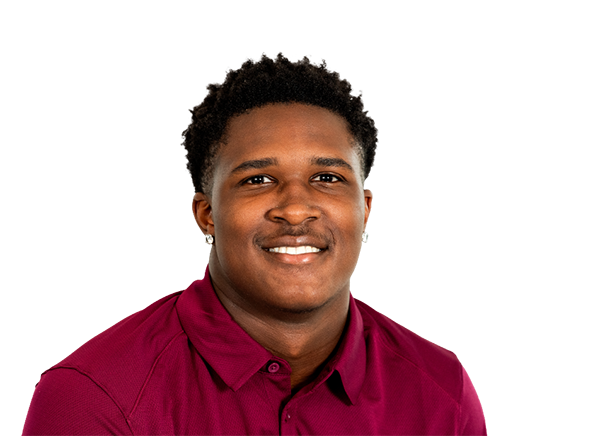 Vinny Pierre Jr.#4 | 5 | 3 | 0 | 0 | 0 | 0 | 0 |
| Cameron Cason#8 | 4 | 4 | 0 | 0 | 0 | 0 | 0 |
| Gavin Shepard | 4 | 2 | 0 | 0 | 0 | 0 | 0 |
| Matthew McClelland#21 | 3 | 0 | 0 | 0 | 0 | 0 | 0 |
| Kaden Lewis#88 | 2 | 1 | 0 | 0 | 0 | 0 | 0 |
| Sam Farmer#19 | 2 | 1 | 0 | 0 | 0 | 0 | 0 |
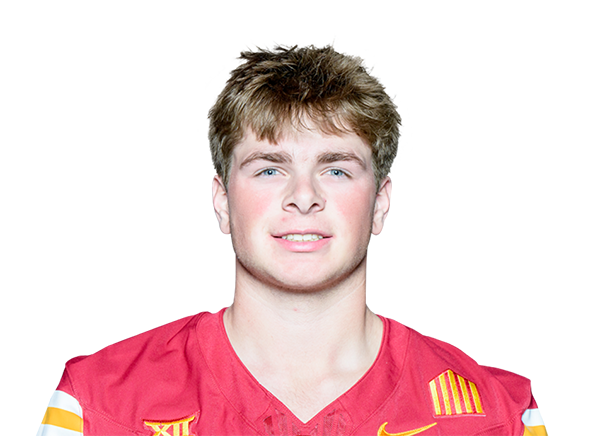 Charles Whelpley#15 | 2 | 0 | 0 | 0 | 0 | 0 | 0 |
| Lance Bassett#98 | 1 | 1 | 1 | 1 | 0 | 0 | 0 |
| Ibrahim Sanogo#9 | 1 | 1 | 1 | 1 | 0 | 0 | 0 |
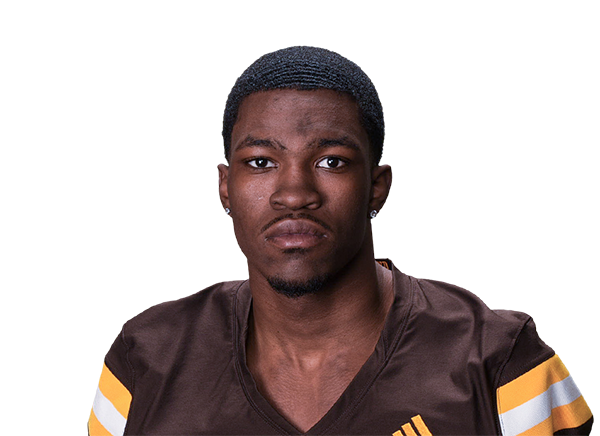 Naz Hill#2 | 1 | 1 | 0 | 0 | 0 | 0 | 0 |
 Amir Dwight#94 | 1 | 1 | 0 | 0 | 0 | 0 | 0 |
| Sebastian Vargas#17 | 1 | 1 | 0 | 1 | 0 | 0 | 0 |
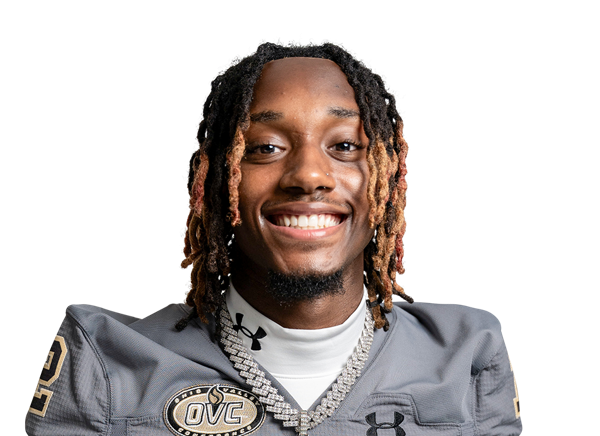 Joshua Newkirk#28 | 1 | 1 | 0 | 0 | 0 | 0 | 0 |
| David Obadein#34 | 1 | 1 | 0 | 0 | 0 | 0 | 0 |
| Alex Broshears#35 | 1 | 1 | 0 | 0 | 0 | 0 | 0 |
 Jake Parrella#20 | 0 | 0 | 0 | 0 | 1 | 0 | 0 |
Illinois| Player | TOT | SOLO | SACKS | TFL | PD | QB HUR | TD |
|---|---|---|---|---|---|---|---|
| Juice Clarke#6 | 7 | 5 | 0 | 0 | 2 | 0 | 0 |
 Jack Paris#38 | 5 | 4 | 0 | 0.5 | 0 | 0 | 0 |
 Ismael Kante#26 | 5 | 2 | 0 | 0.5 | 0 | 1 | 0 |
 Tanner Heckel#16 | 4 | 3 | 0 | 1 | 0 | 0 | 0 |
 James Kreutz#10 | 4 | 1 | 0 | 0.5 | 1 | 0 | 0 |
 Mac Resetich | 3 | 3 | 0 | 0 | 0 | 0 | 0 |
 Xavier Scott#1 | 3 | 2 | 0 | 0.5 | 0 | 0 | 0 |
| Joe Barna#43 | 3 | 2 | 0.5 | 1.5 | 0 | 0 | 0 |
 Darrell Prater#96 | 3 | 1 | 0.5 | 0.5 | 0 | 0 | 0 |
 Cameron Thomas#8 | 2 | 2 | 0 | 0 | 0 | 0 | 0 |
 Tywan Cox#32 | 2 | 2 | 0 | 0 | 0 | 0 | 0 |
 Matthew Bailey#7 | 2 | 1 | 0 | 0 | 0 | 0 | 1 |
 Carter Janki#90 | 2 | 1 | 0 | 0.5 | 0 | 1 | 0 |
 Jakwon Morris#5 | 2 | 1 | 0 | 0 | 0 | 0 | 0 |
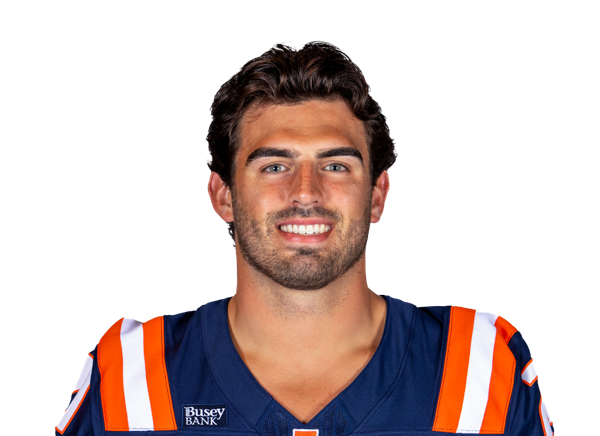 Ben Clawson#21 | 1 | 1 | 0 | 0 | 0 | 0 | 0 |
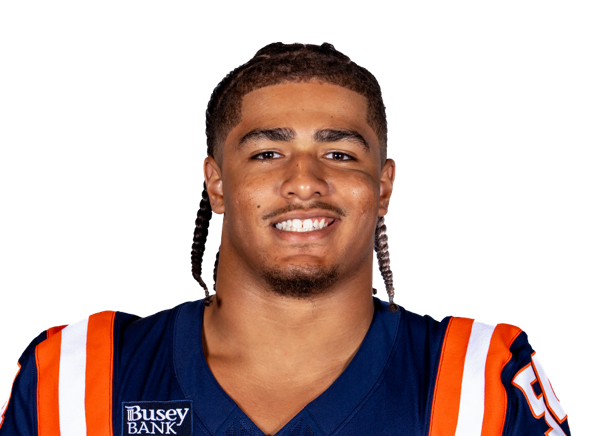 Demetrius John#54 | 1 | 1 | 0 | 0 | 0 | 0 | 0 |
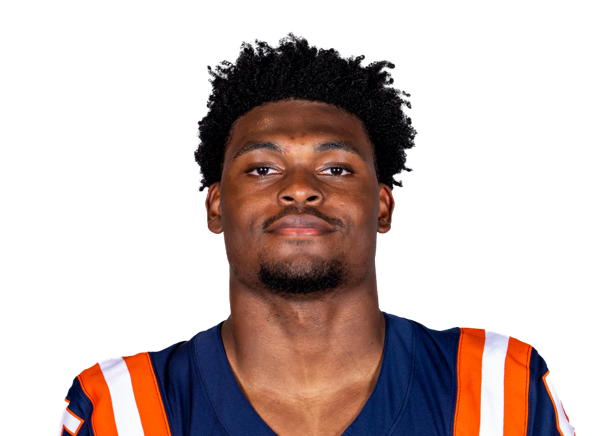 Robert Edmonson#45 | 1 | 1 | 0 | 0 | 0 | 1 | 0 |
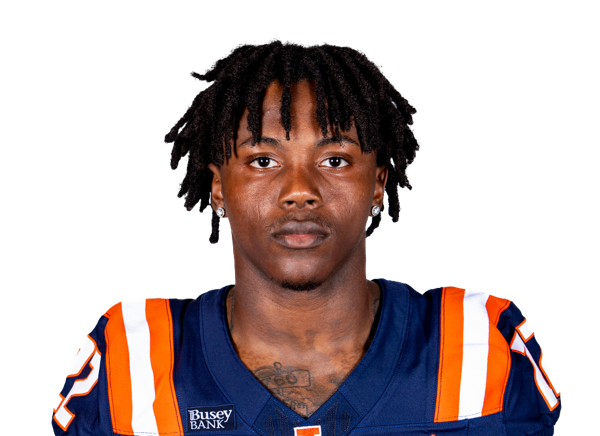 Deuce Fillmore#22 | 1 | 1 | 0 | 0 | 0 | 0 | 0 |
 Ean Rhea#40 | 1 | 1 | 0 | 0 | 0 | 1 | 0 |
 Mason Muragin#18 | 1 | 0 | 0 | 0 | 0 | 0 | 0 |
 Isaiah Thomison#17 | 1 | 0 | 0 | 0.5 | 0 | 0 | 0 |
 Grant Beerman#33 | 1 | 0 | 0 | 0 | 0 | 0 | 0 |
 Xanai Scott#13 | 1 | 0 | 0 | 0 | 0 | 0 | 0 |
 Nick Hankins Jr.#3 | 1 | 0 | 0 | 0 | 0 | 0 | 0 |
 Will Holmes#24 | 0 | 0 | 0 | 0 | 0 | 1 | 0 |
 Kayden Bennett#28 | 0 | 0 | 0 | 0 | 1 | 1 | 0 |
Southern Illinois| Player | FUM | LOST | REC |
|---|---|---|---|
| Team | 1 | 0 | 0 |
| Quade Chatmon#26 | 1 | 0 | 0 |
Southern Illinois| Player | FG | PCT | LONG | XP | PTS |
|---|---|---|---|---|---|
| Weston Schofield#97 | 1/1 | 100.0 | 27 | 1/1 | 4 |
Illinois| Player | FG | PCT | LONG | XP | PTS |
|---|---|---|---|---|---|
 Ethan Moczulski#37 | 2/2 | 100.0 | 42 | 6/6 | 12 |
Southern Illinois| Player | NO | YDS | AVG | TB | In 20 | LONG |
|---|---|---|---|---|---|---|
| Elijah Gorman#92 | 7 | 289 | 41.3 | 1 | 1 | 57 |
Illinois| Player | NO | YDS | AVG | TB | In 20 | LONG |
|---|---|---|---|---|---|---|
 Lars Rau#81 | 3 | 130 | 43.3 | 0 | 1 | 49 |
Southern Illinois| Player | NO | YDS | AVG | LONG | TD |
|---|---|---|---|---|---|
| Markell Quick#11 | 1 | 0 | 0.0 | 0 | 0 |
Southern Illinois| Player | INT | YDS | TD |
|---|---|---|---|
| Sebastian Vargas#17 | 1 | 0 | 0 |
Illinois| Player | INT | YDS | TD |
|---|---|---|---|
| Matthew Bailey#7 | 1 | 88 | 1 |
Drive Summary
SIU
Punt
21
ILL
Touchdown
65
SIU
Touchdown
75
ILL
Touchdown
75
SIU
Punt
-15
ILL
Touchdown
56
SIU
Downs
32
ILL
Touchdown
57
SIU
Punt
14
ILL
Punt
6
SIU
Field Goal
34
ILL
Punt
10
SIU
Punt
5
ILL
Field Goal
28
ILL
Interception
66
SIU
Punt
27
ILL
Punt
7
SIU
Punt
-1
ILL
Field Goal
36
SIU
Interception Touchdown
48
SIU
Punt
-2
ILL
Touchdown
61
SIU
Downs
34
ILL
End Of Quarter
27
Injury Report
No current injury report is available for this matchup.
Head-to-Head
Historical meetings are not available for this matchup.
Game Information
StageWeek 3
Season2026
KickoffSat, Sep 19, 2:00 pm
VenueGies Memorial Stadium
LocationChampaign, IL
SurfaceArtificial Turf
BroadcastPeacock
Division Standings
FCS — Missouri Valley Football Conference
| Team | W | L | T | Pct | PF | PA | Home | Away | Strk |
|---|---|---|---|---|---|---|---|---|---|
 Illinois State | 1 | 0 | 0 | 1.000 | 28 | 24 | 0-0 | 1-0 | W1 |
 North Dakota | 0 | 1 | 0 | 0.000 | 7 | 34 | 0-0 | 0-1 | L1 |
 South Dakota | 0 | 1 | 0 | 0.000 | 24 | 38 | 0-0 | 0-1 | L1 |
 South Dakota State | 0 | 1 | 0 | 0.000 | 18 | 34 | 0-0 | 0-1 | L1 |
 Youngstown State | 0 | 1 | 0 | 0.000 | 13 | 45 | 0-0 | 0-1 | L1 |
 Indiana State | 0 | 1 | 0 | 0.000 | 19 | 44 | 0-0 | 0-1 | L1 |
| Southern Illinois | 0 | 1 | 0 | 0.000 | 10 | 48 | 0-0 | 0-1 | L1 |
 Northern Iowa | 0 | 1 | 0 | 0.000 | 0 | 55 | 0-0 | 0-1 | L1 |
 Murray State | 0 | 2 | 0 | 0.000 | 14 | 97 | 0-0 | 0-2 | L2 |
FBS — Big Ten Conference
| Team | W | L | T | Pct | PF | PA | Home | Away | Strk |
|---|---|---|---|---|---|---|---|---|---|
 Penn State | 5 | 4 | 0 | 0.556 | 260 | 174 | 3-2 | 2-2 | W2 |
 USC | 7 | 2 | 0 | 0.778 | 292 | 218 | 5-1 | 2-1 | W1 |
 Indiana | 8 | 1 | 0 | 0.889 | 292 | 112 | 5-1 | 3-0 | W2 |
 Iowa | 7 | 2 | 0 | 0.778 | 250 | 110 | 4-1 | 3-1 | W2 |
 Maryland | 3 | 6 | 0 | 0.333 | 249 | 282 | 1-4 | 2-2 | W1 |
 Michigan | 5 | 4 | 0 | 0.556 | 176 | 146 | 4-3 | 1-1 | L1 |
 Michigan State | 3 | 6 | 0 | 0.333 | 174 | 212 | 2-3 | 1-3 | W1 |
 Nebraska | 5 | 4 | 0 | 0.556 | 272 | 149 | 4-2 | 1-2 | L4 |
 UCLA | 9 | 0 | 0 | 1.000 | 302 | 127 | 5-0 | 4-0 | W9 |
 Washington | 5 | 4 | 0 | 0.556 | 237 | 197 | 3-3 | 2-1 | L1 |
| Illinois | 6 | 3 | 0 | 0.667 | 256 | 207 | 4-2 | 2-1 | W4 |
 Minnesota | 5 | 4 | 0 | 0.556 | 222 | 198 | 4-2 | 1-2 | L2 |
 Ohio State | 6 | 3 | 0 | 0.667 | 321 | 165 | 4-1 | 2-2 | L2 |
 Oregon | 6 | 3 | 0 | 0.667 | 307 | 199 | 4-1 | 2-2 | W2 |
 Wisconsin | 6 | 3 | 0 | 0.667 | 220 | 147 | 5-0 | 1-3 | W1 |
 Northwestern | 6 | 3 | 0 | 0.667 | 279 | 174 | 5-1 | 1-2 | L2 |
 Purdue | 3 | 6 | 0 | 0.333 | 265 | 291 | 2-4 | 1-2 | L3 |
 Rutgers | 2 | 7 | 0 | 0.222 | 232 | 292 | 1-4 | 1-3 | L3 |
Southern Illinois
7th in MVFC
VS
Illinois
5th in Big Ten
Quarterbacks & Specialists
#7
Jake Curry
#1
DJ Williams
Receivers & Backs
#8
Chandler Chapman
#26
Quade Chatmon
#14
Traivon Dyson
#16
ET Harris
#87
Karsen Konkel
#47
Miles Marshall
#25
Jayden McCaster
#5
Allen Middleton
#11
Markell Quick
#4
Edward Robinson
#6
Kyle Thomas
#24
Lem Wash
#88
Kam White
Defensive Line & Linebackers
#98
Lance Bassett
#46
Andrew Behm
#35
Alex Broshears
#94
Amir Dwight
#19
Sam Farmer
#45
Ben Fiegel
#88
Kaden Lewis
#34
David Obadein
#20
Jake Parrella
#6
Chris Presto
#9
Ibrahim Sanogo
#15
Charles Whelpley
Defensive Backs
#8
Cameron Cason
#2
Naz Hill
#12
Te'Nerrean Jackson
#21
Matthew McClelland
#28
Joshua Newkirk
#4
Vinny Pierre Jr.
Gavin Shepard
#17
Sebastian Vargas
Other
#92
Elijah Gorman
#97
Weston Schofield
Quarterbacks & Specialists
#2
Carson Boyd
#4
Katin Houser
#81
Lars Rau
Receivers & Backs
#86
Christian Abney
#23
Jordan Anderson
#24
Javari Barnett
#13
Hudson Clement
#17
Collin Dixon
#83
Kaden Feagin
#21
Aidan Laughery
#10
Ty Robinson
#88
Davin Stoffel
#11
Brayden Trimble
#5
Ca'Lil Valentine
Defensive Line & Linebackers
#43
Joe Barna
#33
Grant Beerman
#28
Kayden Bennett
#45
Robert Edmonson
#24
Will Holmes
#90
Carter Janki
#54
Demetrius John
#26
Ismael Kante
#10
James Kreutz
#18
Mason Muragin
#38
Jack Paris
#96
Darrell Prater
#40
Ean Rhea
#8
Cameron Thomas
#17
Isaiah Thomison
Defensive Backs
#7
Matthew Bailey
#6
Juice Clarke
#21
Ben Clawson
#32
Tywan Cox
#22
Deuce Fillmore
#3
Nick Hankins Jr.
#16
Tanner Heckel
#5
Jakwon Morris
Mac Resetich
#13
Xanai Scott
#1
Xavier Scott
Other
#37
Ethan Moczulski
Southern Illinois
7th in MVFC
VS
Illinois
5th in Big Ten
Passing
54.5
Completion Percentage
64.5
152
Completions
158
2.50
Interception Percentage
2.00
7
Interceptions
5
75
Longest Pass
54
1,829
Net Passing Yards
1,840
203.2
Net Passing Yards Per Game
230.0
279
Passing Attempts
245
3.60
Passing Touchdown %
6.90
10
Passing Touchdowns
17
116.8
Passer Rating
146.4
21
Total Sacks
8
158
Sack Yards Lost
65
6.6
Yards Per Pass Attempt
7.5
1,829
Passing Yards
1,840
0
Passing Fumbles Lost
0
9
Team Games Played
8
346.4
Yards Per Game
394.3
22.6
Total Points Per Game
29.0
203
Total Points
232
24
Total Touchdowns
28
203.2
Passing Yards Per Game
230.0
152-279
Comp-Att
158-245
21-158
Sacks-Yards Lost
8-65
Rushing
335
Rushing Attempts
251
1,289
Rushing Yards
1,314
3.8
Yards Per Rush Attempt
5.2
39
Long Rushing
77
0
20+ Yard Rushing Plays
0
12
Rushing Touchdowns
9
143.2
Rushing Yards Per Game
164.3
0
Rushing Fumbles
0
0
Rushing Fumbles Lost
0
86
Rushing 1st downs
63
9
Team Games Played
8
3,118
Total Yards
3,154
635
Total Offensive Plays
504
22.6
Total Points Per Game
29.0
203
Total Points
232
24
Total Touchdowns
28
Receiving
152
Receptions
158
0
Receiving Targets
0
1,829
Receiving Yards
1,840
1,829
Receiving Yards
1,840
10
Receiving Touchdowns
17
75
Long Reception
54
0
20+ Yard Receiving Plays
0
203.2
Receiving Yards Per Game
230.0
0
Receiving Fumbles
0
0
Receiving Fumbles Lost
0
125
Receiving Yards After Catch
669
75
Receiving First Downs
92
9
Team Games Played
8
12.0
Yards Per Reception
11.6
22.6
Total Points Per Game
29.0
203
Total Points
232
24
Total Touchdowns
28
Miscellaneous
177
Total 1st downs
172
86
Rushing 1st downs
63
76
Passing 1st downs
93
15
1st downs by penalty
16
47
Third Down Conversions
41
131
Third Down Attempts
94
35.88
3rd down %
43.62
12
Fourth Down Conversions
5
24
First Downs Attempts
12
50.00
4th down %
41.67
50
Total Penalties
33
389
Total Penalty Yards
279
16523
Possession Time Seconds
13852
0.00
Red Zone Field Goal Percentage
0.00
0.00
Red Zone Scoring Percentage
0.00
0.00
Red Zone Efficiency Percentage
0.00
0.00
Red Zone Touchdown Percentage
0.00
11
Total Takeaways
8
14
Total Giveaways
6
-3
Turnover Ratio
2
0
Fumbles Lost
0
47-131
3rd down efficiency
41-94
12-24
4th down efficiency
5-12
50-389
Total-Yards
33-279
Defense
262
Solo Tackles
278
320
Assist Tackles
212
582
Total Tackles
490
20
Sacks
9
147
Sack Yards
62
68
Stuffs
50
22
Passes Defended
28
17.6
Average Interception Yards
49.7
67
Long Interception
88
0
Miscellaneous Touchdowns
0
1
Kicks Blocked
0
32
Tackles For Loss
25
9
Team Games Played
8
Defensive Interceptions
11
Interceptions
3
194
Interception Yards
149
0
Interception Touchdowns
2
11-194
INT: Total
3-149
General
12
Fumbles
3
7
Forced Fumbles
7
4
Fumbles Recovered
3
0
Fumbles Touchdowns
0
9
Games Played
8
12-0
Fumbles-Lost
3-0
Returning
11
Kick Returns
7
232
Kick Return Yards
143
21.1
Yards Per Kick Return
20.4
49
Long Kick Return
31
0
Kick Return Touchdowns
0
14
Punt Returns
5
238
Punt Return Yards
108
17.0
Yards Per Punt Return
21.6
68
Long Punt Return
65
2
Punt Return Touchdowns
0
0
Punt Return Fair Catches
0
0
Kick Return Fumbles Lost
0
0
Punt Return Fumbles Lost
0
9
Team Games Played
8
14-238
Punt: Total
5-108
Kicking
12
Field Goal Made
12
18
Field Goal Attempts
15
66.7
Field Goal Percentage
80.0
50
Long Field Goal Made
54
0
Field Goal Attempts 1-19
0
6
Field Goal Attempts 20-29
1
5
Field Goal Attempts 30-39
4
6
Field Goal Attempts 40-49
6
1
Field Goal Attempts 50+
4
19
Extra Points Made
26
21
Extra Point Attempts
26
90.5
Extra Point Percentage
100.0
0
Field Goals Made 1-19
0
5
Field Goals Made 20-29
1
4
Field Goals Made 30-39
3
2
Field Goals Made 40-49
6
1
Field Goals Made 50+
2
55
Total Kicking Points
62
9
Team Games Played
8
51
Touchback Percentage
71
0.0
Average Kickoff Return Yards
0.0
0
Kickoff Return Yards
0
0
Kickoff Returns
0
0-0
Kickoffs: Total
0-0
12-18
FG: Good-Attempts
12-15
Punting
32
Punts
23
1,403
Punt Yards
996
57
Long Punt
55
43.8
Gross Average Punt Yards
43.3
43.8
Net Average Punt Yards
43.3
0
Punts Blocked
0
13
Punts Inside 20
9
1
Touchbacks
2
11
Fair Catches
12
6
Punt Returns
4
0
Punt Return Yards
0
0.0
Average Punt Return Yards
0.0
9
Team Games Played
8
32-1,403
Punt: Total Yards
23-996
Scoring
12
Rushing Touchdowns
9
10
Receiving Touchdowns
17
2
Return Touchdowns
0
24
Total Touchdowns
26
12
Field Goals
12
19
Kick Extra Points
26
1
Total Two Point Conversions
1
203
Total Points
232
22.6
Total Points Per Game
29.0