

Tennessee vs Arkansas Live Score (10 Oct, 2026)
Score by Quarter
| Team | Q1 | Q2 | Q3 | Q4 | Final |
|---|---|---|---|---|---|
 Tennessee |
0 | 7 | 3 | 14 | 24 |
 Arkansas |
0 | 0 | 14 | 3 | 17 |
Scoring Plays
Q2
10:03
10:03
Trent Thomas 5 Yd pass from George MacIntyre (Cooper Ranvier Kick)
Passing Touchdown
7 – 0
Q3
11:04
11:04
Braylen Russell 9 Yd Run (Max Gilbert Kick)
Rushing Touchdown
7 – 7
Q3
4:28
4:28
Jaden Platt 4 Yd pass from KJ Jackson (Max Gilbert Kick)
Passing Touchdown
7 – 14
Q3
1:35
1:35
Cooper Ranvier 49 Yd Field Goal
Field Goal Good
10 – 14
Q4
12:52
12:52
DaSaahn Brame 1 Yd Run (Cooper Ranvier Kick)
Rushing Touchdown
17 – 14
Q4
7:20
7:20
Max Gilbert 55 Yd Field Goal
Field Goal Good
17 – 17
Q4
1:57
1:57
DeSean Bishop 8 Yd Run (Cooper Ranvier Kick)
Rushing Touchdown
24 – 17
Game Leaders
TennesseeArkansas
 G. MacIntyre QB
Passing Yards
 K. Jackson QB
 D. Bishop RB
Rushing Yards
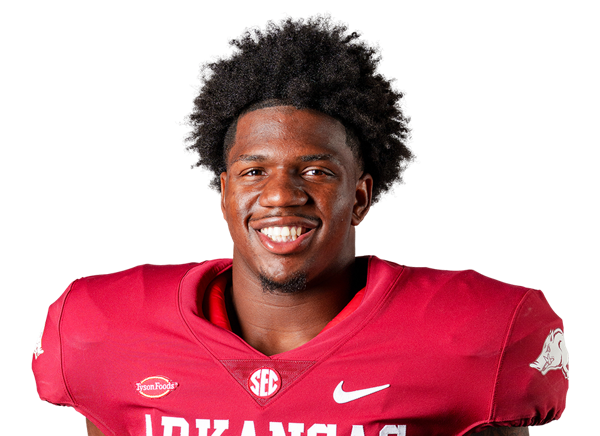 C. Settles RB
 D. Brame TE
Receiving Yards
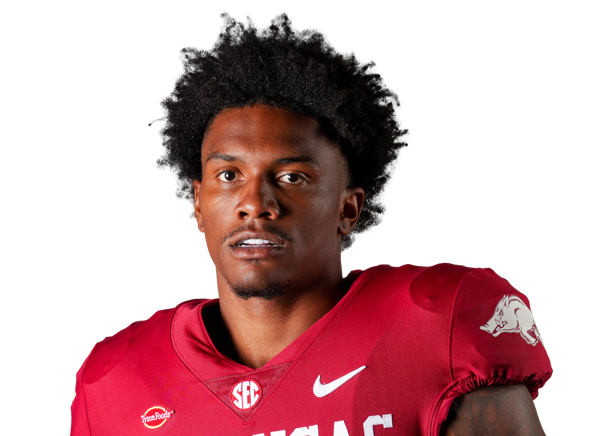 C. Marshall WR
 T. Weathersby DL
Sacks
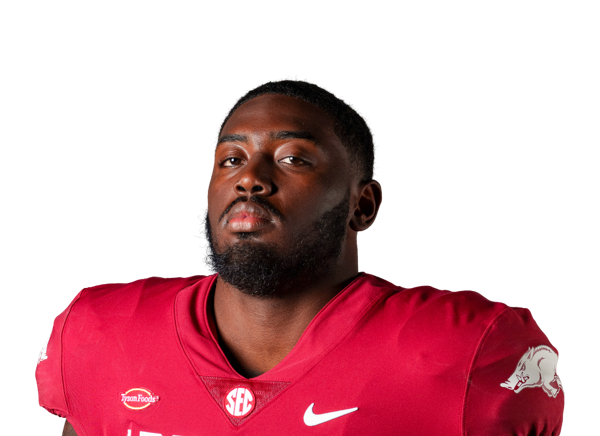 Q. Rhodes Jr. DL
 T. Metcalf DB
Tackles
 B. Bogle LB
Player Box Score
Tennessee| Player | C/ATT | YDS | AVG | TD | INT | QBR |
|---|---|---|---|---|---|---|
| George MacIntyre#12 | 18/29 | 247 | 8.5 | 1 | 2 | 10.3 |
Arkansas| Player | C/ATT | YDS | AVG | TD | INT | QBR |
|---|---|---|---|---|---|---|
| KJ Jackson#7 | 15/27 | 155 | 5.7 | 1 | 0 | 58.7 |
Tennessee| Player | CAR | YDS | AVG | TD | LONG |
|---|---|---|---|---|---|
| DeSean Bishop#18 | 19 | 138 | 7.3 | 1 | 59 |
 Daune Morris#17 | 8 | 33 | 4.1 | 0 | 12 |
 Mike Matthews#4 | 2 | 14 | 7.0 | 0 | 10 |
| DaSaahn Brame#7 | 1 | 1 | 1.0 | 1 | 1 |
| George MacIntyre#12 | 2 | -6 | -3.0 | 0 | 0 |
 Team | 3 | -13 | -4.3 | 0 | 0 |
Arkansas| Player | CAR | YDS | AVG | TD | LONG |
|---|---|---|---|---|---|
| Cam Settles#27 | 8 | 50 | 6.3 | 0 | 27 |
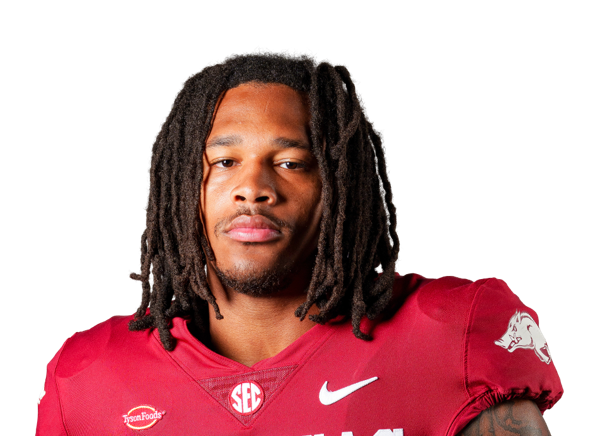 Sutton Smith#5 | 11 | 40 | 3.6 | 0 | 12 |
 Jamari Hawkins#9 | 1 | 22 | 22.0 | 0 | 22 |
 Braylen Russell | 4 | 18 | 4.5 | 1 | 9 |
 Jasper Parker#21 | 1 | 6 | 6.0 | 0 | 6 |
| KJ Jackson#7 | 9 | -3 | -0.3 | 0 | 11 |
Tennessee| Player | REC | YDS | AVG | TD | LONG |
|---|---|---|---|---|---|
| DaSaahn Brame#7 | 3 | 87 | 29.0 | 0 | 68 |
| Mike Matthews#4 | 4 | 78 | 19.5 | 0 | 33 |
 Braylon Staley#14 | 7 | 53 | 7.6 | 0 | 22 |
| Daune Morris#17 | 2 | 21 | 10.5 | 0 | 12 |
 Trent Thomas#82 | 2 | 8 | 4.0 | 1 | 5 |
Arkansas| Player | REC | YDS | AVG | TD | LONG |
|---|---|---|---|---|---|
| Chris Marshall#6 | 7 | 56 | 8.0 | 0 | 15 |
 Monte Harrison#11 | 1 | 29 | 29.0 | 0 | 29 |
 Ty Lockwood#85 | 2 | 25 | 12.5 | 0 | 20 |
 CJ Brown#3 | 1 | 21 | 21.0 | 0 | 21 |
| Cam Settles#27 | 1 | 9 | 9.0 | 0 | 9 |
 Donovan Faupel#8 | 1 | 8 | 8.0 | 0 | 8 |
 Jaden Platt#83 | 1 | 4 | 4.0 | 1 | 4 |
| Braylen Russell | 1 | 3 | 3.0 | 0 | 3 |
Tennessee| Player | TOT | SOLO | SACKS | TFL | PD | QB HUR | TD |
|---|---|---|---|---|---|---|---|
| TJ Metcalf#1 | 9 | 3 | 0 | 0 | 0 | 0 | 0 |
 Amare Campbell | 7 | 3 | 0 | 0.5 | 1 | 1 | 0 |
 Dejuan Lane#10 | 6 | 3 | 0 | 1 | 1 | 0 | 0 |
 Ty Redmond#4 | 6 | 3 | 0 | 0 | 1 | 0 | 0 |
 Qua Moss#6 | 5 | 5 | 0 | 0 | 0 | 0 | 0 |
 Arion Carter#7 | 5 | 2 | 0 | 0 | 0 | 0 | 0 |
 Xavier Gilliam#2 | 4 | 3 | 1 | 1.5 | 1 | 2 | 0 |
 Jeremiah Telander#22 | 4 | 1 | 0 | 0 | 0 | 0 | 0 |
 Daevin Hobbs#5 | 3 | 2 | 0 | 1 | 0 | 0 | 0 |
 Jordan Norman#33 | 3 | 1 | 0 | 0 | 0 | 0 | 0 |
| Tyree Weathersby#18 | 2 | 2 | 1 | 2 | 0 | 0 | 0 |
 Edwin Spillman#13 | 2 | 1 | 0 | 0 | 0 | 0 | 0 |
 Kayin Lee#14 | 1 | 1 | 0 | 0 | 0 | 0 | 0 |
 Nathan Robinson#19 | 1 | 0 | 0 | 0 | 1 | 0 | 0 |
 Carson Gentle#35 | 1 | 0 | 0 | 0 | 0 | 0 | 0 |
| George MacIntyre#12 | 1 | 0 | 0 | 0 | 0 | 0 | 0 |
 Mariyon Dye#9 | 1 | 0 | 0 | 0 | 0 | 0 | 0 |
 Radarious Jackson#3 | 1 | 0 | 0 | 0 | 0 | 0 | 0 |
 JJ Finch#26 | 0 | 0 | 0 | 0 | 0 | 1 | 0 |
Arkansas| Player | TOT | SOLO | SACKS | TFL | PD | QB HUR | TD |
|---|---|---|---|---|---|---|---|
| Ben Bogle#44 | 9 | 4 | 0 | 0 | 0 | 0 | 0 |
 Ja'Quavion Smith#25 | 8 | 4 | 0 | 0 | 0 | 0 | 0 |
 Shelton Lewis#2 | 6 | 3 | 0 | 0 | 1 | 0 | 0 |
 Joker Johnson#20 | 4 | 4 | 0 | 1 | 0 | 0 | 0 |
 Khmori House#6 | 4 | 3 | 0 | 0.5 | 1 | 1 | 0 |
 Christian Harrison#1 | 4 | 2 | 0 | 0 | 0 | 1 | 0 |
 Bradley Shaw#7 | 4 | 1 | 0 | 0 | 0 | 0 | 0 |
 Carlon Jones#91 | 3 | 2 | 0 | 0.5 | 0 | 0 | 0 |
 Hunter Osborne | 3 | 0 | 0 | 0.5 | 1 | 0 | 0 |
| Quincy Rhodes Jr.#97 | 2 | 2 | 1 | 1 | 0 | 1 | 0 |
 Carter Stoutmire#13 | 2 | 1 | 0 | 0 | 0 | 0 | 0 |
 Antonio Sandel-Bascomb#55 | 2 | 0 | 0 | 0 | 0 | 0 | 0 |
 Brylan Green#34 | 1 | 1 | 0 | 0 | 0 | 0 | 0 |
| Jamari Hawkins#9 | 1 | 1 | 0 | 0 | 0 | 0 | 0 |
 La'khi Roland#4 | 1 | 1 | 0 | 0 | 0 | 0 | 0 |
 Donovan Whitten#52 | 1 | 1 | 0 | 0 | 0 | 0 | 0 |
 Miguel Mitchell#24 | 1 | 0 | 0 | 0.5 | 0 | 0 | 0 |
Tennessee| Player | FUM | LOST | REC |
|---|---|---|---|
| George MacIntyre#12 | 1 | 1 | 0 |
| Team | 1 | 0 | 0 |
| Xavier Gilliam#2 | 0 | 0 | 1 |
Arkansas| Player | FUM | LOST | REC |
|---|---|---|---|
| KJ Jackson#7 | 1 | 1 | 0 |
| Team | 1 | 0 | 0 |
| Quincy Rhodes Jr.#97 | 0 | 0 | 1 |
Tennessee| Player | FG | PCT | LONG | XP | PTS |
|---|---|---|---|---|---|
 Cooper Ranvier#28 | 1/2 | 50.0 | 49 | 3/3 | 6 |
Arkansas| Player | FG | PCT | LONG | XP | PTS |
|---|---|---|---|---|---|
 Max Gilbert#30 | 1/2 | 50.0 | 55 | 2/2 | 5 |
Tennessee| Player | NO | YDS | AVG | TB | In 20 | LONG |
|---|---|---|---|---|---|---|
 Jackson Ross#98 | 4 | 190 | 47.5 | 1 | 2 | 57 |
Arkansas| Player | NO | YDS | AVG | TB | In 20 | LONG |
|---|---|---|---|---|---|---|
 Gavin Rush#37 | 8 | 322 | 40.3 | 0 | 2 | 49 |
Tennessee| Player | NO | YDS | AVG | LONG | TD |
|---|---|---|---|---|---|
| Qua Moss#6 | 2 | 20 | 10.0 | 18 | 0 |
Arkansas| Player | INT | YDS | TD |
|---|---|---|---|
| Shelton Lewis#2 | 1 | 11 | 0 |
| Miguel Mitchell#24 | 1 | 0 | 0 |
Drive Summary
ARK
Fumble
42
TENN
Missed FG
34
ARK
Punt
10
TENN
Punt
10
ARK
Punt
25
TENN
Touchdown
71
ARK
Punt
-6
TENN
Punt
6
ARK
Punt
18
TENN
Punt
29
ARK
Punt
5
TENN
Fumble
23
ARK
Missed FG
0
TENN
Punt
-4
ARK
Touchdown
70
TENN
Interception
5
ARK
Touchdown
63
TENN
Field Goal
44
ARK
Punt
0
TENN
Touchdown
74
ARK
Field Goal
38
TENN
Interception
33
ARK
Punt
3
TENN
Touchdown
94
ARK
Punt
0
TENN
End of Game
-2
Injury Report
No current injury report is available for this matchup.
Head-to-Head
Historical meetings are not available for this matchup.
Game Information
StageWeek 6
Season2026
KickoffSat, Oct 10, 4:15 pm
VenueDonald W. Reynolds Razorback Stadium
LocationFayetteville, AR
SurfaceArtificial Turf
BroadcastSEC Network
Attendance69,038
Division Standings
FBS — Southeastern Conference
| Team | W | L | T | Pct | PF | PA | Home | Away | Strk |
|---|---|---|---|---|---|---|---|---|---|
 Georgia | 9 | 1 | 0 | 0.900 | 418 | 147 | 6-1 | 3-0 | W3 |
 Alabama | 8 | 2 | 0 | 0.800 | 358 | 189 | 4-1 | 4-1 | W3 |
 Kentucky | 7 | 3 | 0 | 0.700 | 283 | 253 | 4-2 | 3-1 | L2 |
 Mississippi State | 4 | 6 | 0 | 0.400 | 245 | 291 | 2-4 | 2-2 | L6 |
 Missouri | 6 | 4 | 0 | 0.600 | 293 | 229 | 4-1 | 2-3 | L2 |
| Tennessee | 8 | 2 | 0 | 0.800 | 314 | 143 | 5-1 | 3-1 | W2 |
 Ole Miss | 6 | 3 | 0 | 0.667 | 304 | 234 | 5-1 | 1-2 | L1 |
 Florida | 6 | 4 | 0 | 0.600 | 313 | 262 | 3-2 | 3-2 | W1 |
 Oklahoma | 5 | 4 | 0 | 0.556 | 199 | 173 | 3-2 | 2-2 | W1 |
 Texas | 8 | 2 | 0 | 0.800 | 302 | 178 | 5-1 | 3-1 | W4 |
 LSU | 6 | 4 | 0 | 0.600 | 355 | 181 | 5-2 | 1-2 | L2 |
 Auburn | 6 | 4 | 0 | 0.600 | 260 | 246 | 4-2 | 2-2 | W2 |
 South Carolina | 6 | 4 | 0 | 0.600 | 318 | 245 | 4-2 | 2-2 | L1 |
 Texas A&M | 4 | 6 | 0 | 0.400 | 242 | 190 | 4-2 | 0-4 | L3 |
 Vanderbilt | 4 | 6 | 0 | 0.400 | 213 | 286 | 3-3 | 1-3 | L1 |
| Arkansas | 4 | 6 | 0 | 0.400 | 214 | 253 | 3-3 | 1-3 | W1 |
Tennessee
2nd in SEC
VS
Arkansas
13th in SEC
Quarterbacks & Specialists
#12
George MacIntyre
#98
Jackson Ross
Receivers & Backs
#18
DeSean Bishop
#7
DaSaahn Brame
#3
Radarious Jackson
#4
Mike Matthews
#17
Daune Morris
#14
Braylon Staley
#82
Trent Thomas
Defensive Line & Linebackers
Amare Campbell
#7
Arion Carter
#9
Mariyon Dye
#26
JJ Finch
#35
Carson Gentle
#2
Xavier Gilliam
#5
Daevin Hobbs
#33
Jordan Norman
#19
Nathan Robinson
#13
Edwin Spillman
#22
Jeremiah Telander
#18
Tyree Weathersby
Defensive Backs
#10
Dejuan Lane
#14
Kayin Lee
#1
TJ Metcalf
#6
Qua Moss
#4
Ty Redmond
Other
#28
Cooper Ranvier
Quarterbacks & Specialists
#7
KJ Jackson
#37
Gavin Rush
Receivers & Backs
#3
CJ Brown
#8
Donovan Faupel
#11
Monte Harrison
#9
Jamari Hawkins
#85
Ty Lockwood
#6
Chris Marshall
#21
Jasper Parker
#83
Jaden Platt
Braylen Russell
#27
Cam Settles
#5
Sutton Smith
Defensive Line & Linebackers
#44
Ben Bogle
#91
Carlon Jones
Hunter Osborne
#97
Quincy Rhodes Jr.
#55
Antonio Sandel-Bascomb
#7
Bradley Shaw
#25
Ja'Quavion Smith
#52
Donovan Whitten
Defensive Backs
#34
Brylan Green
#1
Christian Harrison
#6
Khmori House
#20
Joker Johnson
#2
Shelton Lewis
#24
Miguel Mitchell
#4
La'khi Roland
#13
Carter Stoutmire
Other
#30
Max Gilbert
Tennessee
3rd in SEC
VS
Arkansas
13th in SEC
Passing
65.4
Completion Percentage
59.3
157
Completions
197
1.70
Interception Percentage
1.80
4
Interceptions
6
68
Longest Pass
50
1,715
Net Passing Yards
2,217
171.5
Net Passing Yards Per Game
221.7
240
Passing Attempts
332
4.60
Passing Touchdown %
3.30
11
Passing Touchdowns
11
136.8
Passer Rating
122.9
23
Total Sacks
24
133
Sack Yards Lost
169
7.1
Yards Per Pass Attempt
6.7
1,715
Passing Yards
2,217
0
Passing Fumbles Lost
0
10
Team Games Played
10
385.5
Yards Per Game
339.6
31.4
Total Points Per Game
21.4
314
Total Points
214
37
Total Touchdowns
24
171.5
Passing Yards Per Game
221.7
157-240
Comp-Att
197-332
23-133
Sacks-Yards Lost
24-169
Rushing
445
Rushing Attempts
363
2,140
Rushing Yards
1,179
4.8
Yards Per Rush Attempt
3.2
73
Long Rushing
65
0
20+ Yard Rushing Plays
0
24
Rushing Touchdowns
11
214.0
Rushing Yards Per Game
117.9
0
Rushing Fumbles
0
0
Rushing Fumbles Lost
0
115
Rushing 1st downs
79
10
Team Games Played
10
3,855
Total Yards
3,396
708
Total Offensive Plays
719
31.4
Total Points Per Game
21.4
314
Total Points
214
37
Total Touchdowns
24
Receiving
157
Receptions
197
0
Receiving Targets
0
1,715
Receiving Yards
2,217
1,715
Receiving Yards
2,217
11
Receiving Touchdowns
11
68
Long Reception
50
0
20+ Yard Receiving Plays
0
171.5
Receiving Yards Per Game
221.7
0
Receiving Fumbles
0
0
Receiving Fumbles Lost
0
1039
Receiving Yards After Catch
1045
73
Receiving First Downs
106
10
Team Games Played
10
10.9
Yards Per Reception
11.3
31.4
Total Points Per Game
21.4
314
Total Points
214
37
Total Touchdowns
24
Miscellaneous
211
Total 1st downs
204
115
Rushing 1st downs
79
73
Passing 1st downs
106
23
1st downs by penalty
19
50
Third Down Conversions
63
139
Third Down Attempts
150
35.97
3rd down %
42.00
14
Fourth Down Conversions
10
18
First Downs Attempts
18
77.78
4th down %
55.56
70
Total Penalties
61
582
Total Penalty Yards
544
18846
Possession Time Seconds
18975
0.00
Red Zone Field Goal Percentage
0.00
0.00
Red Zone Scoring Percentage
0.00
0.00
Red Zone Efficiency Percentage
0.00
0.00
Red Zone Touchdown Percentage
0.00
15
Total Takeaways
13
11
Total Giveaways
14
4
Turnover Ratio
-1
0
Fumbles Lost
0
50-139
3rd down efficiency
63-150
14-18
4th down efficiency
10-18
70-582
Total-Yards
61-544
Defense
320
Solo Tackles
289
284
Assist Tackles
336
604
Total Tackles
625
39
Sacks
13
218
Sack Yards
109
89
Stuffs
56
38
Passes Defended
28
13.5
Average Interception Yards
15.4
41
Long Interception
63
0
Miscellaneous Touchdowns
0
1
Kicks Blocked
0
64
Tackles For Loss
32
10
Team Games Played
10
Defensive Interceptions
11
Interceptions
8
148
Interception Yards
123
1
Interception Touchdowns
2
11-148
INT: Total
8-123
General
16
Fumbles
11
7
Forced Fumbles
7
11
Fumbles Recovered
7
0
Fumbles Touchdowns
0
10
Games Played
10
16-0
Fumbles-Lost
11-0
Returning
8
Kick Returns
3
130
Kick Return Yards
75
16.3
Yards Per Kick Return
25.0
25
Long Kick Return
25
0
Kick Return Touchdowns
0
13
Punt Returns
8
148
Punt Return Yards
34
11.4
Yards Per Punt Return
4.3
57
Long Punt Return
20
1
Punt Return Touchdowns
0
0
Punt Return Fair Catches
0
0
Kick Return Fumbles Lost
0
0
Punt Return Fumbles Lost
0
10
Team Games Played
10
13-148
Punt: Total
8-34
Kicking
18
Field Goal Made
15
19
Field Goal Attempts
23
94.7
Field Goal Percentage
65.2
49
Long Field Goal Made
55
0
Field Goal Attempts 1-19
0
3
Field Goal Attempts 20-29
3
9
Field Goal Attempts 30-39
10
6
Field Goal Attempts 40-49
3
1
Field Goal Attempts 50+
7
36
Extra Points Made
23
36
Extra Point Attempts
23
100.0
Extra Point Percentage
100.0
0
Field Goals Made 1-19
0
3
Field Goals Made 20-29
3
9
Field Goals Made 30-39
9
6
Field Goals Made 40-49
2
0
Field Goals Made 50+
1
90
Total Kicking Points
68
10
Team Games Played
10
78
Touchback Percentage
81
0.0
Average Kickoff Return Yards
0.0
0
Kickoff Return Yards
0
0
Kickoff Returns
0
0-0
Kickoffs: Total
0-0
18-19
FG: Good-Attempts
15-23
Punting
42
Punts
41
1,835
Punt Yards
1,639
57
Long Punt
54
43.7
Gross Average Punt Yards
40.0
43.7
Net Average Punt Yards
40.0
0
Punts Blocked
0
18
Punts Inside 20
12
2
Touchbacks
1
22
Fair Catches
21
10
Punt Returns
5
0
Punt Return Yards
0
0.0
Average Punt Return Yards
0.0
10
Team Games Played
10
42-1,835
Punt: Total Yards
41-1,639
Scoring
24
Rushing Touchdowns
11
11
Receiving Touchdowns
11
1
Return Touchdowns
0
36
Total Touchdowns
22
18
Field Goals
15
36
Kick Extra Points
23
1
Total Two Point Conversions
1
314
Total Points
214
31.4
Total Points Per Game
21.4