

Texas Southern vs Florida Atlantic Live Score (3 Oct, 2026)
Score by Quarter
| Team | Q1 | Q2 | Q3 | Q4 | Final |
|---|---|---|---|---|---|
 Texas Southern | 3 | 7 | 0 | 0 | 10 |
 Florida Atlantic | 28 | 21 | 10 | 7 | 66 |
Scoring Plays
Q1
14:47
14:47
L. Farrow returns for 98 yds for a TD, E. Goodwin kickoff for 63 yds (C. Rogers KICK)
Kickoff
0 – 7
Q1
8:32
8:32
M. Arana III 44 yd FG GOOD
Field Goal Good
3 – 7
Q1
8:16
8:16
M. Arana III kickoff for 57 yds, L. Farrow returns for 92 yds for a TD (C. Rogers KICK)
Kickoff
3 – 14
Q1
6:38
6:38
C. McCoy fumbled, C. McCoy sacked by J. Sipp Jr. for -7 yds, W. Denaud fumbled, return for 31 yds for a TD (C. Rogers KICK)
Touchdown
3 – 21
Q1
0:29
0:29
C. Veltkamp pass to E. Messer for 19 yds, for a TD (C. Rogers KICK)
Passing Touchdown
3 – 28
Q2
12:09
12:09
C. Veltkamp pass to K. Valsin for 19 yds, for a TD (C. Rogers KICK)
Passing Touchdown
3 – 35
Q2
5:24
5:24
C. Veltkamp pass to K. Valsin for 55 yds, for a TD (C. Rogers KICK)
Passing Touchdown
3 – 42
Q2
1:17
1:17
A. Renfro Jr. run for 11 yds, for a TD (M. Arana III KICK)
Rushing Touchdown
10 – 42
Q2
1:17
1:17
C. Veltkamp pass to K. Valsin for 8 yds, for a TD (C. Rogers KICK)
Passing Touchdown
10 – 49
Q3
9:46
9:46
C. Rogers 47 yd FG GOOD
Field Goal Good
10 – 52
Q3
3:18
3:18
B. Tillman III run for 22 yds, for a TD (C. Rogers KICK)
Rushing Touchdown
10 – 59
Q4
14:47
14:47
A. Brown run for 1 yd, for a TD (C. Rogers KICK)
Rushing Touchdown
10 – 66
Game Leaders
Texas SouthernFlorida Atlantic
 C. McCoy QB
Passing Yards
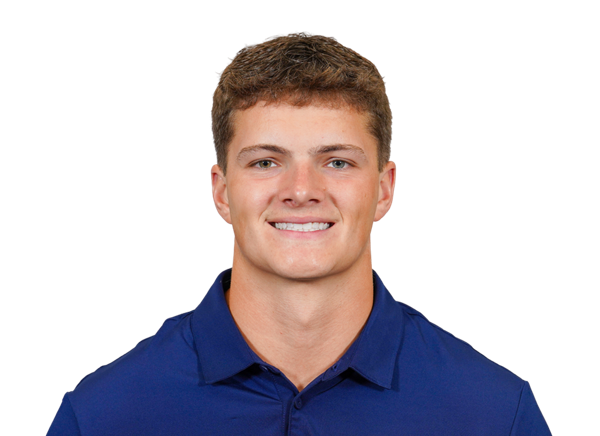 C. Veltkamp QB
 A. Renfro Jr. RB
Rushing Yards
 B. Tillman III RB
 R. Richardson WR
Receiving Yards
 K. Valsin WR
 K. Green DL
Sacks
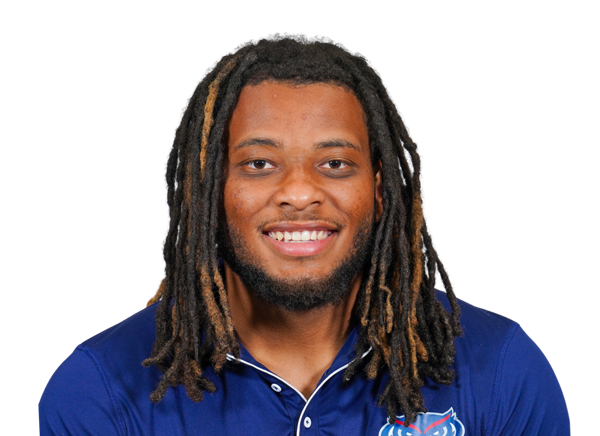 J. Sipp Jr. LB
 L. Howell CB
Tackles
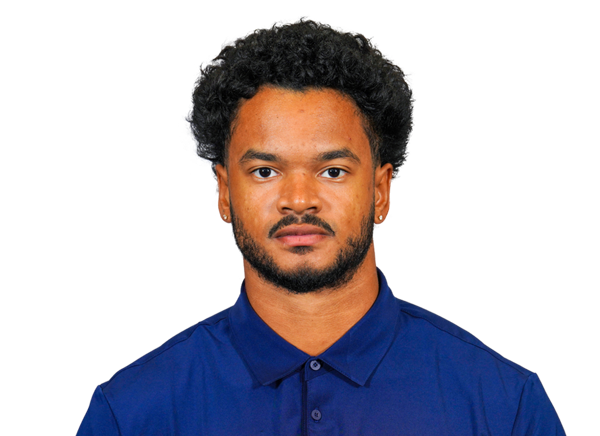 Z. Horton LB
Player Box Score
Texas Southern| Player | C/ATT | YDS | AVG | TD | INT |
|---|---|---|---|---|---|
| Cam'Ron McCoy | 17/27 | 158 | 5.9 | 0 | 1 |
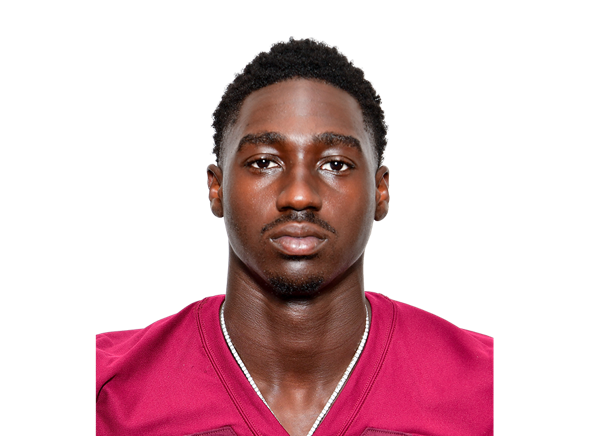 Nelson Peterson Jr.#2 | 0/1 | 0 | 0.0 | 0 | 0 |
Florida Atlantic| Player | C/ATT | YDS | AVG | TD | INT |
|---|---|---|---|---|---|
| Caden Veltkamp#10 | 13/16 | 247 | 15.4 | 4 | 0 |
 Drew Devillier#18 | 4/7 | 54 | 7.7 | 0 | 0 |
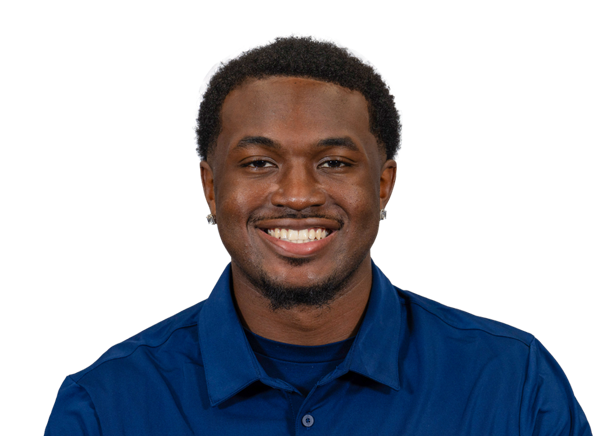 Jordan Magwood#7 | 1/3 | 16 | 5.3 | 0 | 0 |
 Jeremiah Daoud#12 | 1/4 | 6 | 1.5 | 0 | 0 |
Texas Southern| Player | CAR | YDS | AVG | TD | LONG |
|---|---|---|---|---|---|
| Athean Renfro Jr.#28 | 20 | 101 | 5.1 | 1 | 34 |
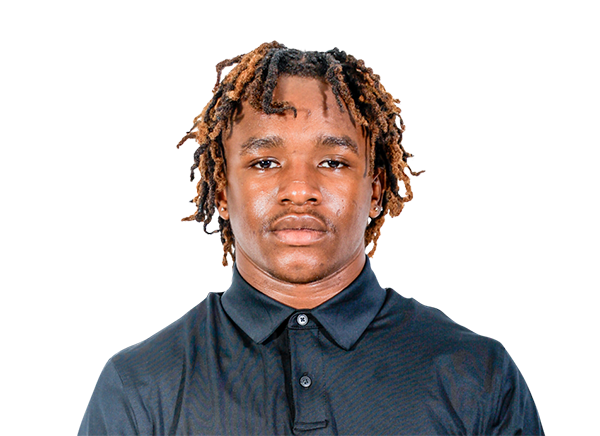 Fatu Mukuba#4 | 1 | 16 | 16.0 | 0 | 16 |
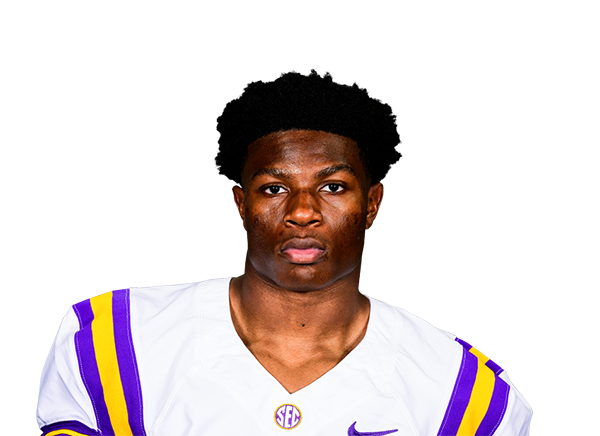 David Kency#38 | 7 | 14 | 2.0 | 0 | 7 |
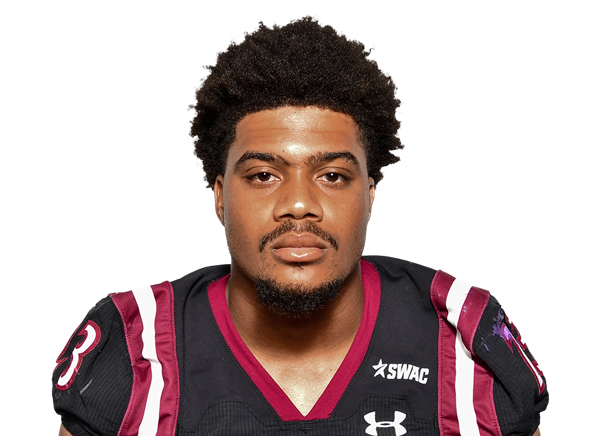 Jacob Washington#23 | 5 | 13 | 2.6 | 0 | 6 |
| Nelson Peterson Jr.#2 | 1 | 6 | 6.0 | 0 | 6 |
| Cam'Ron McCoy | 8 | 5 | 0.6 | 0 | 7 |
| Roriyon Richardson#1 | 1 | 0 | 0.0 | 0 | 0 |
| Team | 1 | -1 | -1.0 | 0 | 0 |
Florida Atlantic| Player | CAR | YDS | AVG | TD | LONG |
|---|---|---|---|---|---|
| Brady Tillman III#22 | 6 | 48 | 8.0 | 1 | 22 |
 Ethan Ervin#21 | 4 | 23 | 5.8 | 0 | 9 |
 Almari Brown#33 | 5 | 21 | 4.2 | 1 | 18 |
| Jeremiah Daoud#12 | 1 | 16 | 16.0 | 0 | 16 |
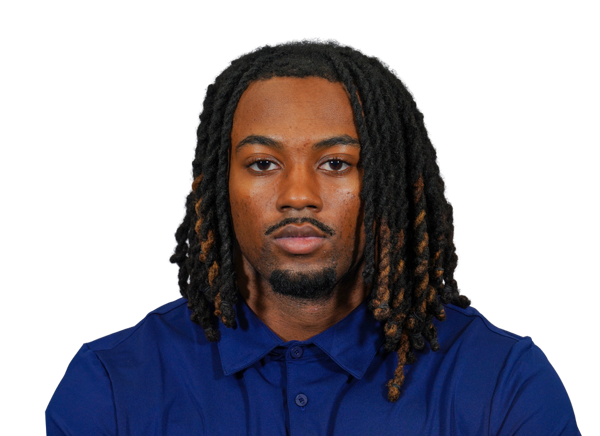 Leonard Farrow#5 | 2 | 13 | 6.5 | 0 | 9 |
 Joshua Harriott#20 | 1 | 3 | 3.0 | 0 | 3 |
| Jordan Magwood#7 | 1 | 3 | 3.0 | 0 | 3 |
| Caden Veltkamp#10 | 2 | 2 | 1.0 | 0 | 4 |
| Drew Devillier#18 | 1 | 1 | 1.0 | 0 | 1 |
Texas Southern| Player | REC | YDS | AVG | TD | LONG |
|---|---|---|---|---|---|
| Roriyon Richardson#1 | 6 | 61 | 10.2 | 0 | 20 |
 Zyion Claville#6 | 3 | 32 | 10.7 | 0 | 14 |
| Fatu Mukuba#4 | 4 | 23 | 5.8 | 0 | 9 |
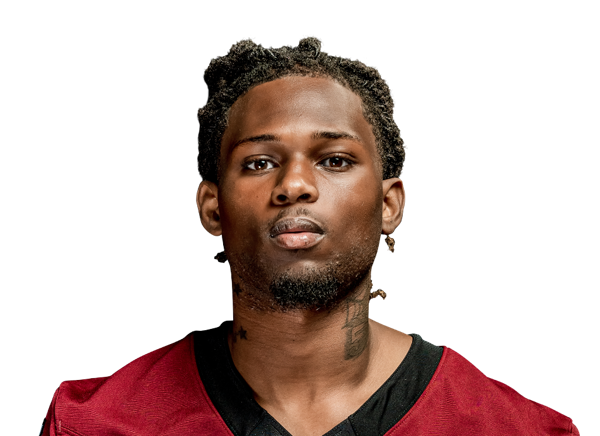 Daveon Walker#3 | 2 | 22 | 11.0 | 0 | 17 |
| Athean Renfro Jr.#28 | 1 | 19 | 19.0 | 0 | 19 |
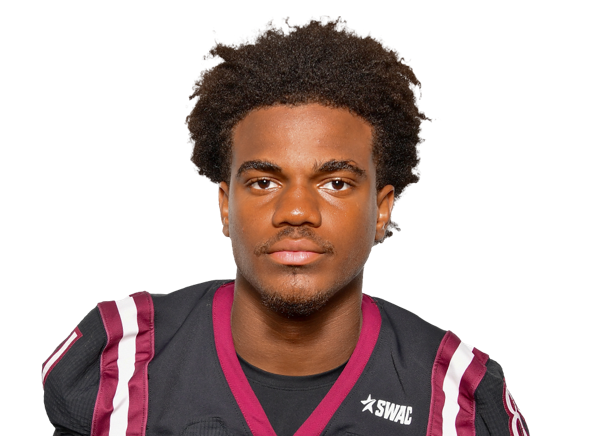 Xavier Phipps#13 | 1 | 1 | 1.0 | 0 | 1 |
Florida Atlantic| Player | REC | YDS | AVG | TD | LONG |
|---|---|---|---|---|---|
| Kelby Valsin#2 | 7 | 126 | 18.0 | 3 | 55 |
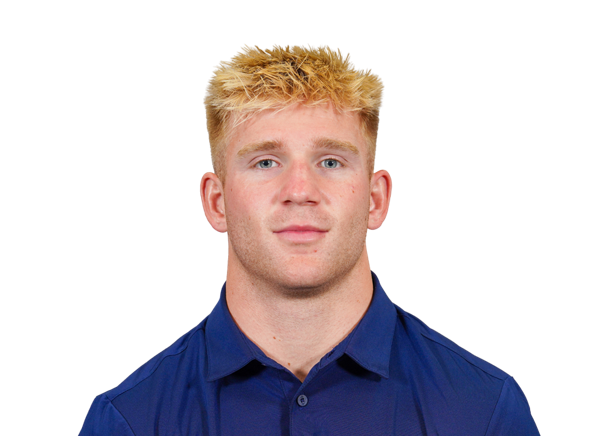 Easton Messer#8 | 4 | 88 | 22.0 | 1 | 30 |
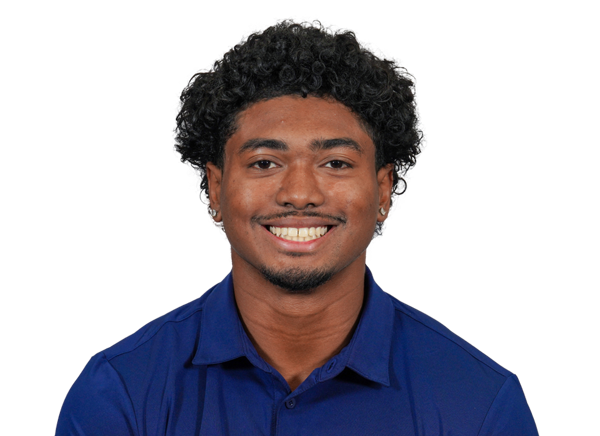 Dominique Henry#9 | 2 | 33 | 16.5 | 0 | 18 |
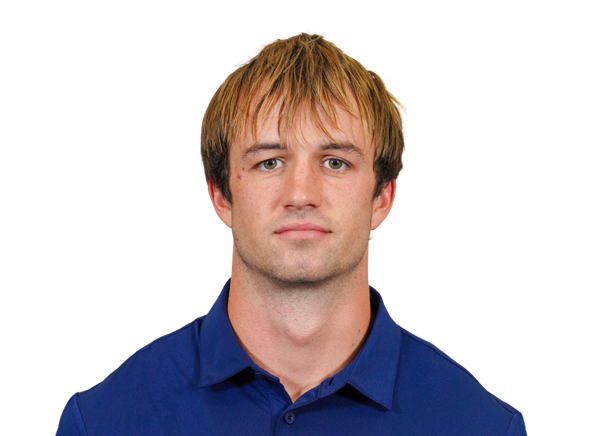 Tucker Holloway#3 | 1 | 26 | 26.0 | 0 | 26 |
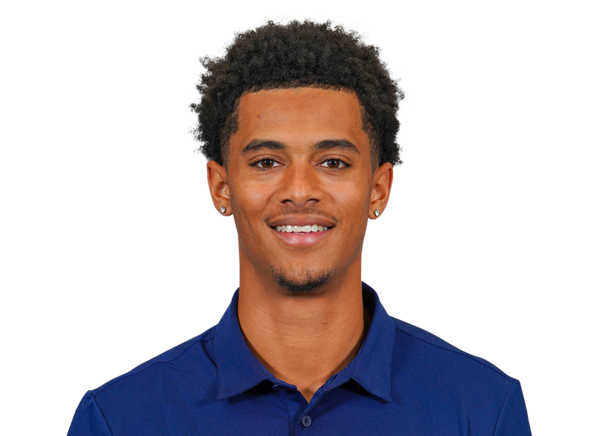 RJ Garcia II#6 | 1 | 19 | 19.0 | 0 | 19 |
 Branden Hoch | 1 | 16 | 16.0 | 0 | 16 |
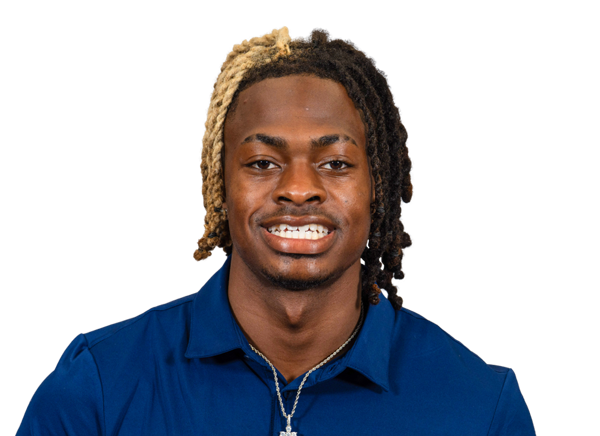 Antojuan Woody#4 | 2 | 9 | 4.5 | 0 | 14 |
 Peter Cannon#87 | 1 | 6 | 6.0 | 0 | 6 |
Texas Southern| Player | TOT | SOLO | SACKS | TFL | PD | QB HUR | TD |
|---|---|---|---|---|---|---|---|
| Langston Howell#32 | 6 | 3 | 0 | 0.5 | 0 | 0 | 0 |
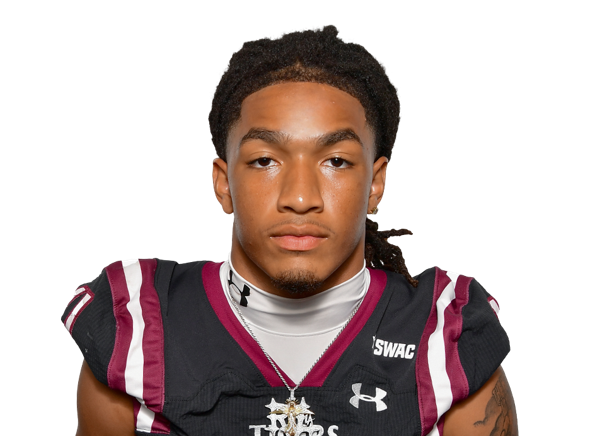 Fabian Wells#13 | 6 | 3 | 0 | 0 | 0 | 0 | 0 |
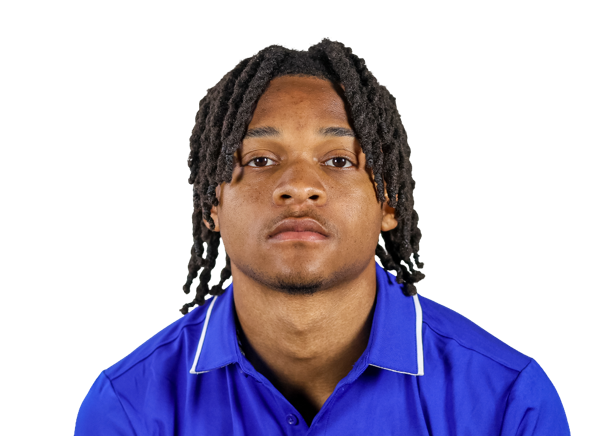 Ryan Robinson Jr.#3 | 4 | 2 | 0 | 1 | 0 | 0 | 0 |
 Aaron Kizzee#5 | 4 | 2 | 0 | 0 | 0 | 0 | 0 |
 Jacob Williams#11 | 3 | 2 | 0 | 0 | 1 | 0 | 0 |
 Joel Williams#1 | 3 | 1 | 0 | 0 | 1 | 0 | 0 |
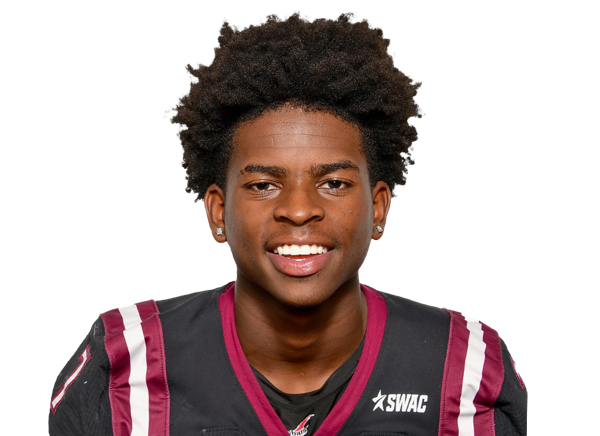 Quinton Murray#7 | 3 | 1 | 0 | 0 | 2 | 0 | 0 |
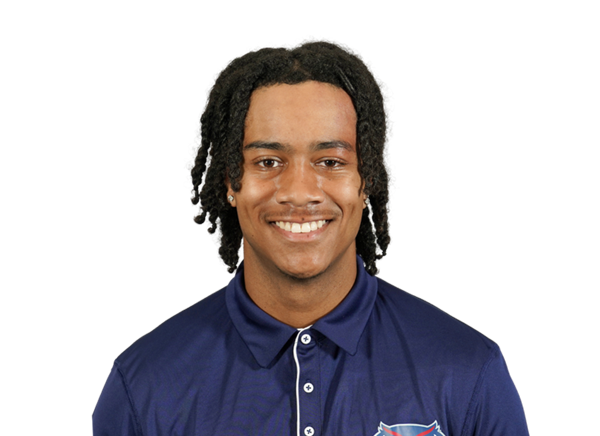 MJ Hinson#8 | 2 | 2 | 0 | 0 | 0 | 0 | 0 |
| Jordan Thompson#15 | 2 | 1 | 0 | 0 | 0 | 0 | 0 |
 Garfield Lawrence#6 | 2 | 0 | 0 | 0 | 0 | 0 | 0 |
| Kalvin Green#44 | 1 | 1 | 1 | 1 | 0 | 0 | 0 |
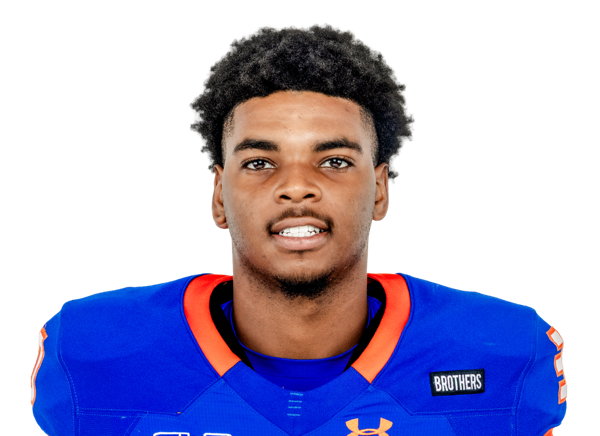 Josh McCarter#81 | 1 | 1 | 0 | 0 | 0 | 0 | 0 |
 Thurman Rayborn | 1 | 1 | 0 | 0 | 0 | 0 | 0 |
 Amare Garrett#24 | 1 | 1 | 0 | 0 | 1 | 0 | 0 |
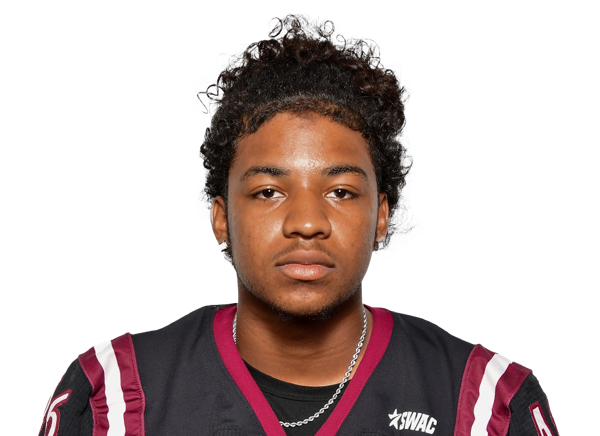 Donovan Jones#20 | 1 | 1 | 0 | 0 | 0 | 0 | 0 |
 Nico Guerra#95 | 1 | 0 | 0 | 0 | 0 | 0 | 0 |
 Nathan Morcom#2 | 1 | 0 | 0 | 0.5 | 0 | 0 | 0 |
Florida Atlantic| Player | TOT | SOLO | SACKS | TFL | PD | QB HUR | TD |
|---|---|---|---|---|---|---|---|
| Zyere Horton#28 | 6 | 2 | 0 | 0 | 0 | 0 | 0 |
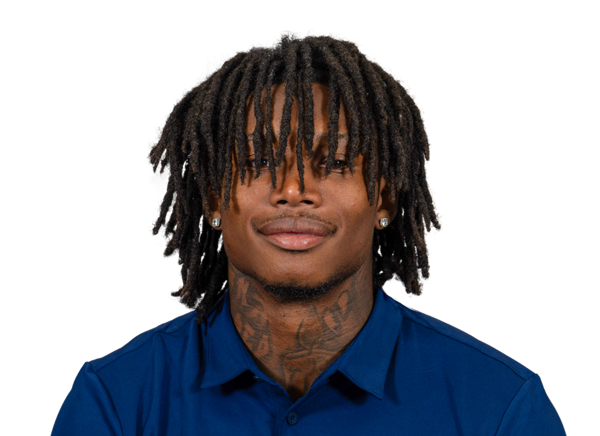 JK Johnson#23 | 5 | 3 | 0 | 0 | 0 | 0 | 0 |
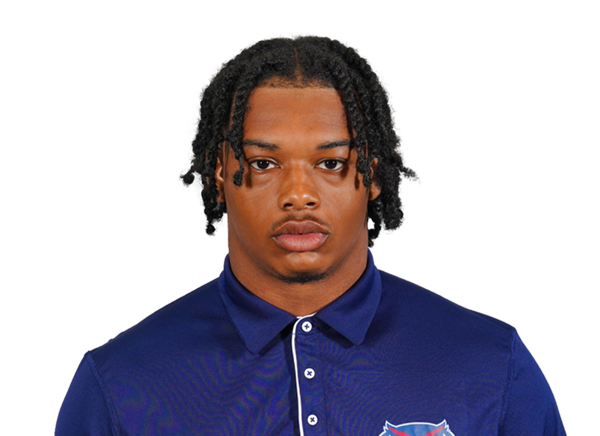 Khmari Johnson#7 | 5 | 3 | 0 | 0 | 0 | 0 | 0 |
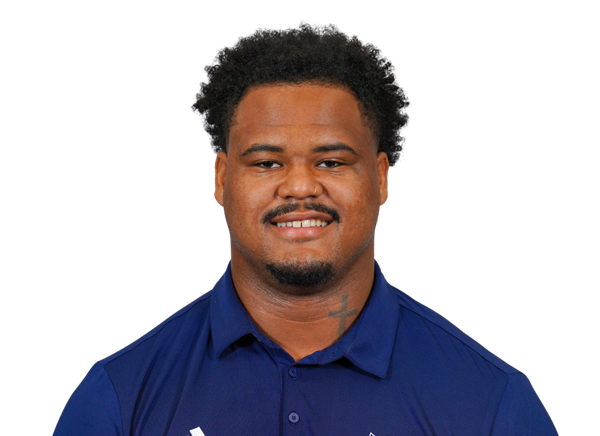 Earl Miller Jr.#13 | 5 | 2 | 0 | 0.5 | 0 | 1 | 0 |
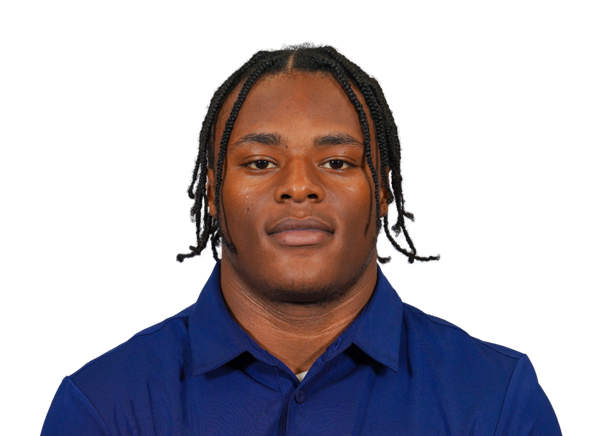 Bo Simpson-Nealy#20 | 5 | 2 | 0 | 0 | 0 | 1 | 0 |
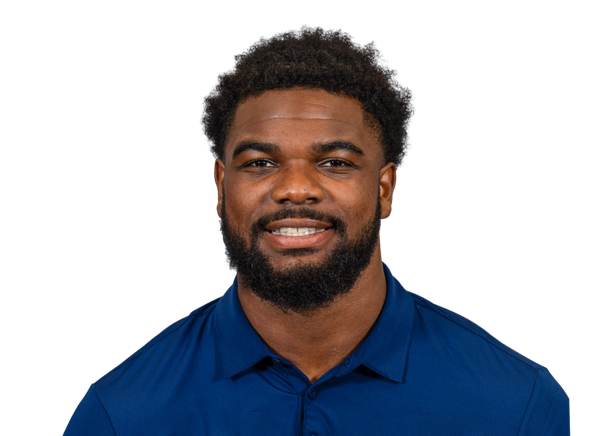 Wilky Denaud#2 | 5 | 1 | 0 | 0.5 | 0 | 0 | 1 |
 Leon Hart Jr.#6 | 5 | 0 | 0 | 0 | 0 | 1 | 0 |
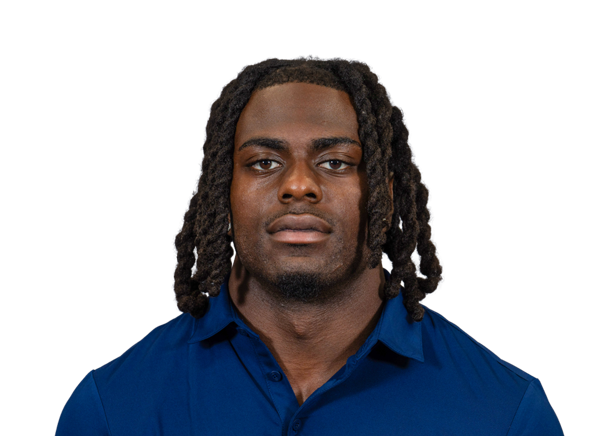 Jayden Sweeney#22 | 4 | 3 | 0 | 0.5 | 0 | 0 | 0 |
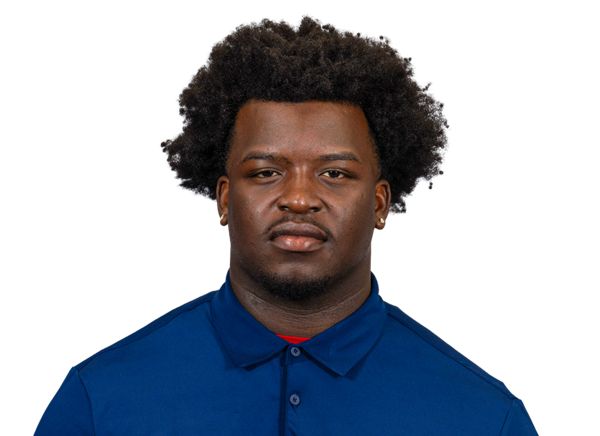 Nimari Brantley#95 | 4 | 2 | 0 | 1 | 0 | 1 | 0 |
| Joseph Sipp Jr.#18 | 4 | 1 | 1 | 1 | 0 | 1 | 0 |
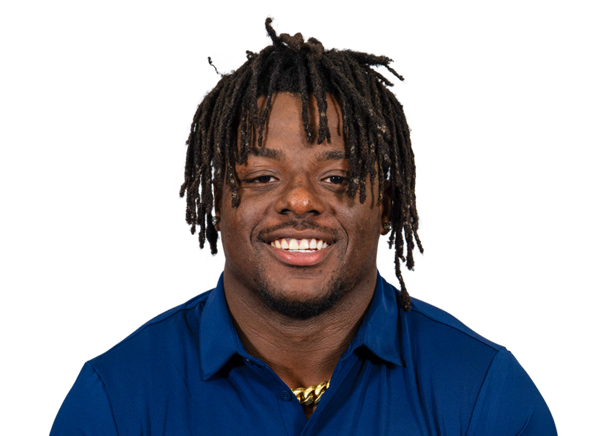 Tyclean Luman#15 | 3 | 2 | 0 | 0 | 0 | 0 | 0 |
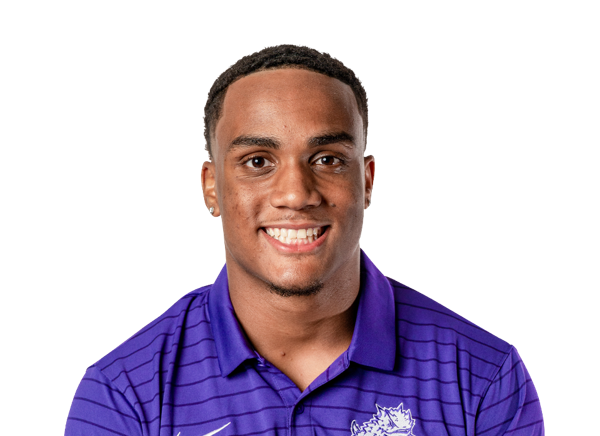 Jonathan Bax#9 | 3 | 1 | 0 | 0 | 0 | 0 | 0 |
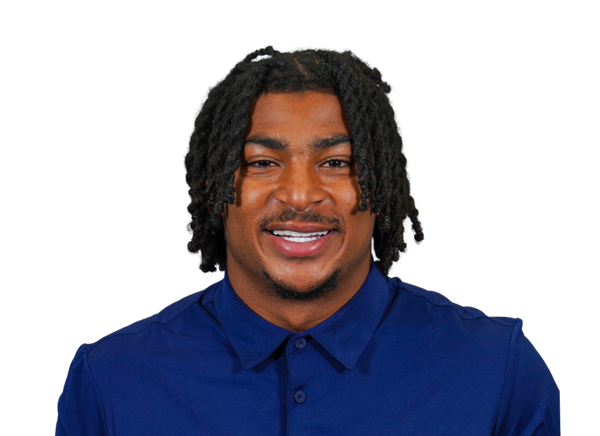 Wallace Foster IV#16 | 3 | 0 | 0 | 0 | 0 | 0 | 0 |
 Chris Tooley III#8 | 2 | 2 | 0 | 0 | 0 | 0 | 0 |
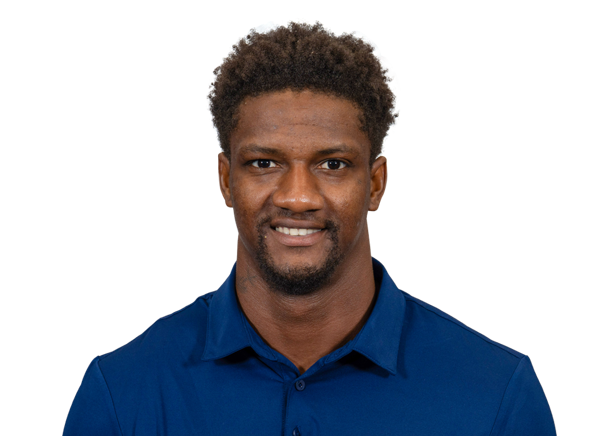 Damarius McGhee#4 | 2 | 2 | 0 | 0 | 1 | 0 | 0 |
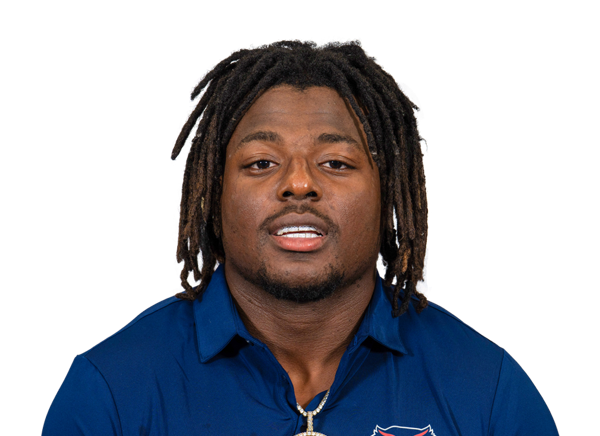 Tycoolhill Luman#14 | 2 | 1 | 1 | 1 | 0 | 0 | 0 |
 CJ Doggette Jr.#1 | 2 | 1 | 0 | 0.5 | 0 | 0 | 0 |
 Jay Crable#12 | 2 | 1 | 0 | 0 | 0 | 0 | 0 |
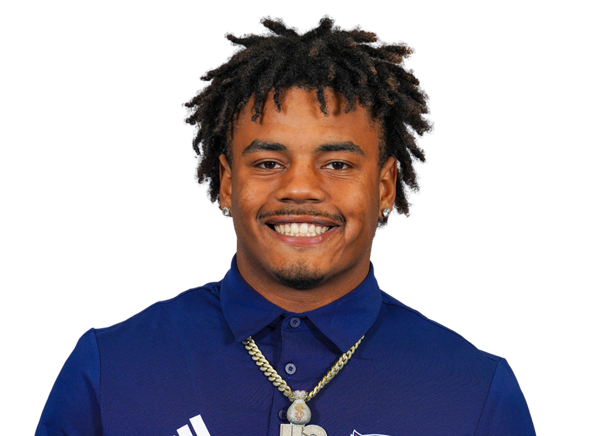 Justin Weatherall#30 | 2 | 1 | 0 | 0 | 0 | 0 | 0 |
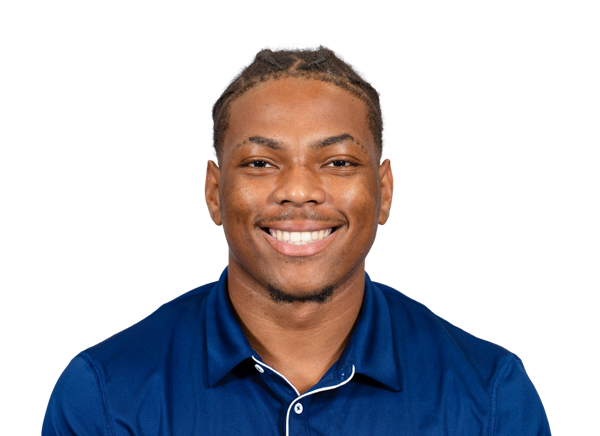 Kenyon Garner#31 | 2 | 1 | 0 | 1 | 0 | 0 | 0 |
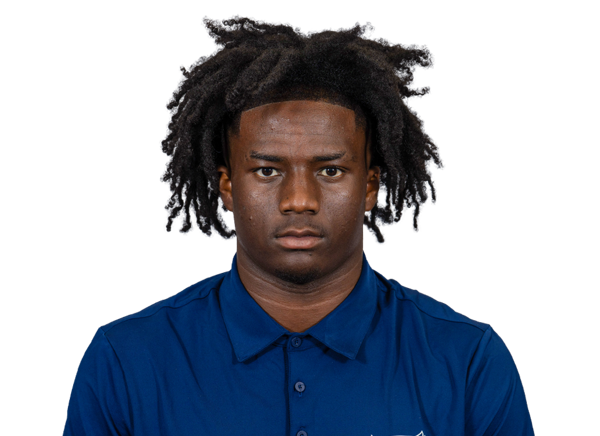 Damon Allen | 2 | 0 | 0 | 0 | 0 | 0 | 0 |
 Hector Chavez#43 | 2 | 0 | 0 | 0 | 0 | 0 | 0 |
 Enyce Sledge#62 | 1 | 1 | 0 | 0 | 0 | 0 | 0 |
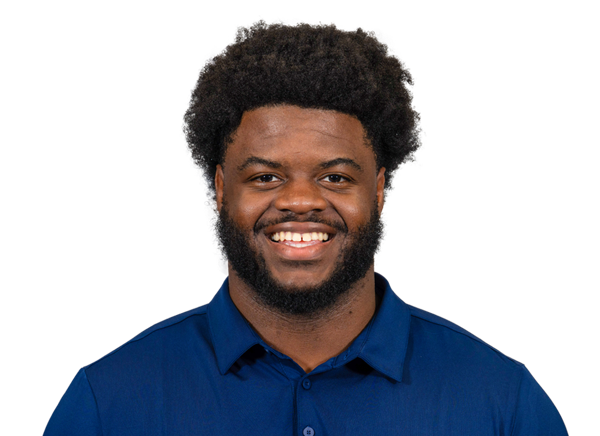 Gavench Marcelin#11 | 1 | 1 | 0 | 0 | 0 | 0 | 0 |
 Brenden Guidroz#34 | 1 | 1 | 0 | 0 | 0 | 0 | 0 |
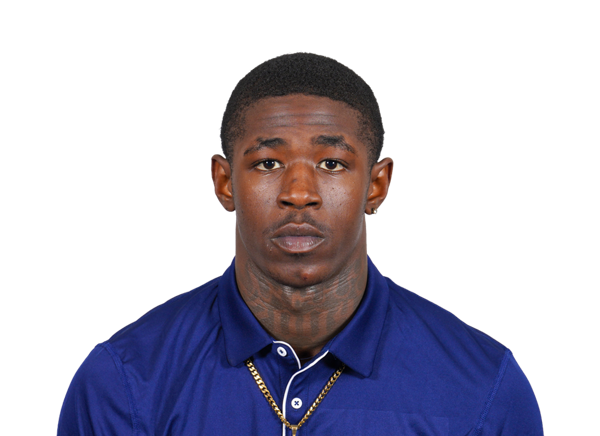 Derrick Rogers#3 | 1 | 0 | 0 | 0 | 1 | 0 | 0 |
 Char'Quez Lee#17 | 1 | 0 | 0 | 0 | 0 | 0 | 0 |
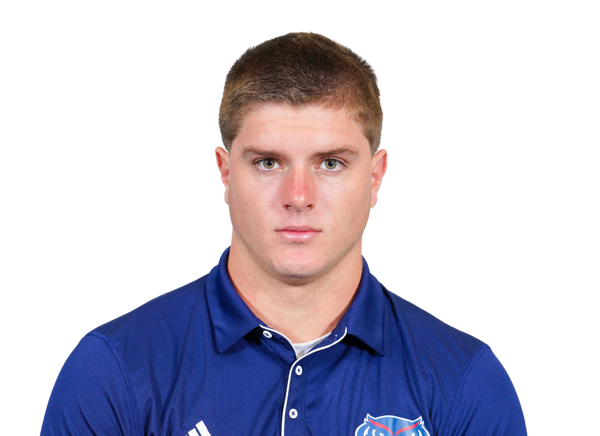 Josh Roberts#10 | 1 | 0 | 0 | 0 | 0 | 0 | 0 |
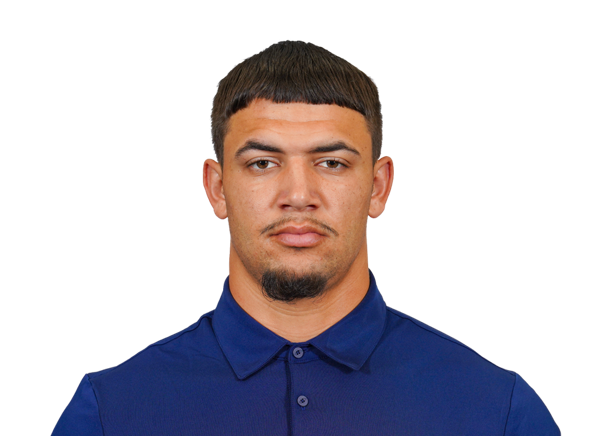 Tito Nunez#35 | 1 | 0 | 0 | 0 | 0 | 0 | 0 |
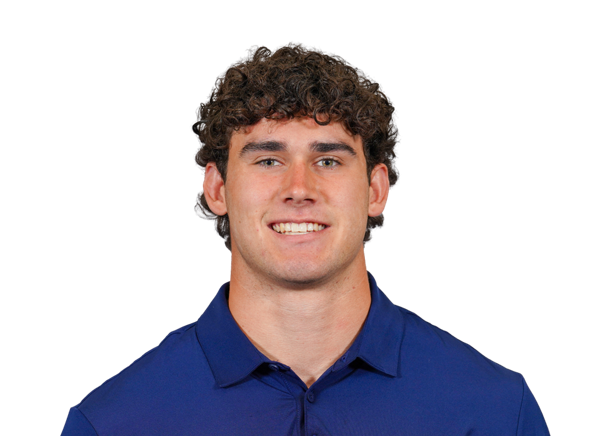 Nate Fischer#21 | 1 | 0 | 0 | 0 | 0 | 0 | 0 |
 Nick Toussaint#89 | 1 | 0 | 0 | 0 | 0 | 0 | 0 |
| Leonard Farrow#5 | 0 | 0 | 0 | 0 | 0 | 0 | 2 |
Texas Southern| Player | FUM | LOST | REC |
|---|---|---|---|
| Cam'Ron McCoy | 1 | 1 | 0 |
| Fatu Mukuba#4 | 1 | 0 | 0 |
Florida Atlantic| Player | FUM | LOST | REC |
|---|---|---|---|
| Kelby Valsin#2 | 1 | 0 | 0 |
| Wilky Denaud#2 | 0 | 0 | 1 |
Texas Southern| Player | FG | PCT | LONG | XP | PTS |
|---|---|---|---|---|---|
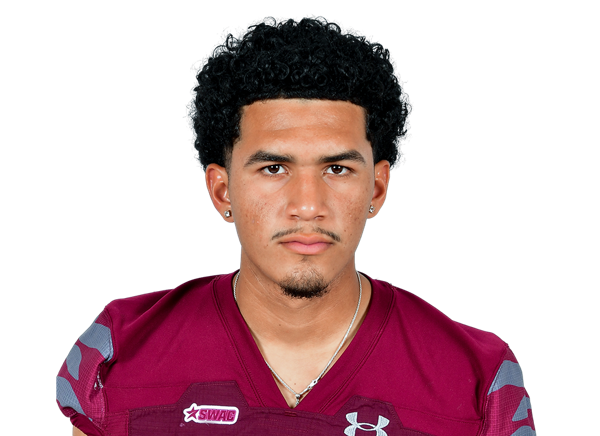 Miguel Arana III#10 | 1/1 | 100.0 | 44 | 1/1 | 4 |
Florida Atlantic| Player | FG | PCT | LONG | XP | PTS |
|---|---|---|---|---|---|
 Collin Rogers#41 | 1/1 | 100.0 | 47 | 9/9 | 12 |
Texas Southern| Player | NO | YDS | AVG | TB | In 20 | LONG |
|---|---|---|---|---|---|---|
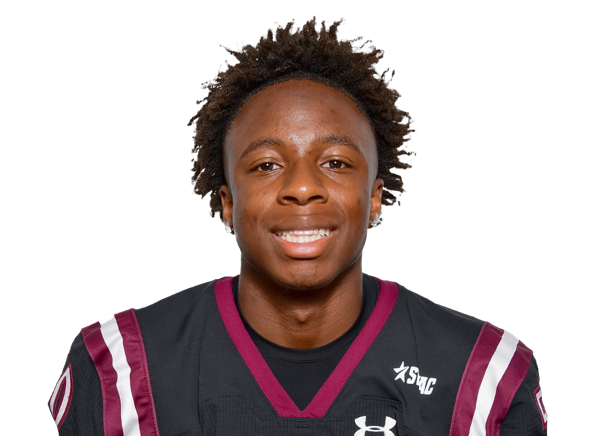 Brian Mays#50 | 7 | 247 | 35.3 | 0 | 1 | 53 |
| Team | 1 | 38 | 38.0 | 0 | 0 | 38 |
Florida Atlantic| Player | NO | YDS | AVG | TB | In 20 | LONG |
|---|---|---|---|---|---|---|
 Reed Chandley#91 | 3 | 112 | 37.3 | 0 | 2 | 43 |
Texas Southern| Player | NO | YDS | AVG | LONG | TD |
|---|---|---|---|---|---|
| Fatu Mukuba#4 | 4 | 92 | 23.0 | 29 | 0 |
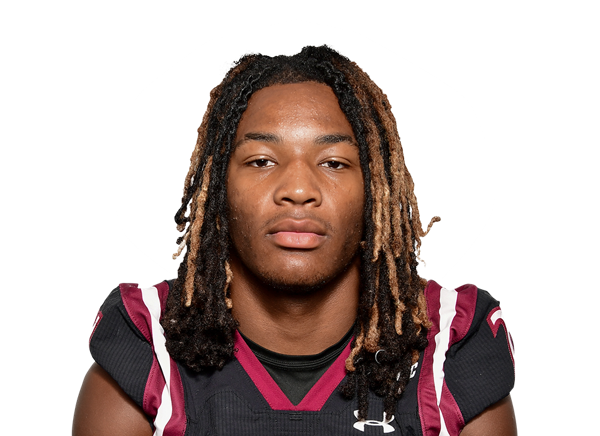 Danny Green Jr.#21 | 1 | 20 | 20.0 | 20 | 0 |
Florida Atlantic| Player | NO | YDS | AVG | LONG | TD |
|---|---|---|---|---|---|
| Leonard Farrow#5 | 2 | 190 | 95.0 | 98 | 2 |
Florida Atlantic| Player | NO | YDS | AVG | LONG | TD |
|---|---|---|---|---|---|
| Tucker Holloway#3 | 1 | 13 | 13.0 | 13 | 0 |
| Easton Messer#8 | 1 | 11 | 11.0 | 11 | 0 |
Florida Atlantic| Player | INT | YDS | TD |
|---|---|---|---|
| Wallace Foster IV#16 | 1 | 0 | 0 |
Drive Summary
TXSO
Touchdown
0
TXSO
Field Goal
48
TXSO
Touchdown
0
TXSO
Fumble Touchdown
-16
TXSO
Interception
58
FAU
Touchdown
80
TXSO
Punt
11
FAU
Touchdown
55
TXSO
Punt
9
FAU
Touchdown
80
TXSO
Touchdown
80
FAU
Touchdown
75
TXSO
End Of Half
-1
TXSO
Punt
19
FAU
Field Goal
41
TXSO
Punt
-1
FAU
Punt
22
TXSO
Punt
5
FAU
Touchdown
44
TXSO
Punt
-22
FAU
Touchdown
57
TXSO
Punt
34
FAU
Punt
19
TXSO
Punt
9
FAU
Punt
20
TXSO
End Of Quarter
8
Injury Report
No current injury report is available for this matchup.
Head-to-Head
Historical meetings are not available for this matchup.
Game Information
StageWeek 5
Season2026
KickoffSat, Oct 3, 6:00 pm
VenueFlagler Credit Union Stadium
LocationBoca Raton, FL
SurfaceGrass
BroadcastESPN+
Division Standings
FBS — American Conference
| Team | W | L | T | Pct | PF | PA | Home | Away | Strk |
|---|---|---|---|---|---|---|---|---|---|
 South Florida | 6 | 2 | 0 | 0.750 | 216 | 116 | 4-1 | 2-1 | W2 |
| Florida Atlantic | 5 | 3 | 0 | 0.625 | 302 | 286 | 4-0 | 1-3 | L1 |
 Memphis | 7 | 2 | 0 | 0.778 | 338 | 212 | 5-0 | 2-2 | W2 |
 North Texas | 6 | 2 | 0 | 0.750 | 350 | 255 | 4-0 | 2-2 | W5 |
 UAB | 4 | 4 | 0 | 0.500 | 173 | 202 | 4-0 | 0-4 | L1 |
 Army | 5 | 3 | 0 | 0.625 | 269 | 204 | 3-1 | 2-2 | L1 |
 UTSA | 7 | 1 | 0 | 0.875 | 268 | 208 | 4-0 | 3-1 | W5 |
 East Carolina | 4 | 4 | 0 | 0.500 | 192 | 193 | 3-1 | 1-3 | W1 |
 Tulane | 4 | 4 | 0 | 0.500 | 180 | 203 | 3-1 | 1-3 | W1 |
 Rice | 1 | 7 | 0 | 0.125 | 168 | 254 | 1-3 | 0-4 | L7 |
 Tulsa | 4 | 4 | 0 | 0.500 | 238 | 195 | 2-2 | 2-2 | L1 |
 Temple | 2 | 6 | 0 | 0.250 | 189 | 213 | 1-4 | 1-2 | L3 |
 Charlotte | 1 | 7 | 0 | 0.125 | 165 | 322 | 0-4 | 1-3 | L1 |
 Navy | 2 | 6 | 0 | 0.250 | 221 | 239 | 2-2 | 0-4 | L3 |
Texas Southern
8th in SWAC
VS
Florida Atlantic
Quarterbacks & Specialists
Cam'Ron McCoy
#2
Nelson Peterson Jr.
Receivers & Backs
#6
Zyion Claville
#21
Danny Green Jr.
#38
David Kency
#81
Josh McCarter
#4
Fatu Mukuba
#13
Xavier Phipps
#28
Athean Renfro Jr.
#1
Roriyon Richardson
#3
Daveon Walker
#23
Jacob Washington
Defensive Line & Linebackers
#44
Kalvin Green
#95
Nico Guerra
#20
Donovan Jones
#5
Aaron Kizzee
#6
Garfield Lawrence
#2
Nathan Morcom
Thurman Rayborn
#15
Jordan Thompson
#11
Jacob Williams
Defensive Backs
#24
Amare Garrett
#8
MJ Hinson
#32
Langston Howell
#7
Quinton Murray
#3
Ryan Robinson Jr.
#13
Fabian Wells
#1
Joel Williams
Other
#10
Miguel Arana III
#50
Brian Mays
Quarterbacks & Specialists
#91
Reed Chandley
#12
Jeremiah Daoud
#18
Drew Devillier
#7
Jordan Magwood
#10
Caden Veltkamp
Receivers & Backs
#33
Almari Brown
#87
Peter Cannon
#21
Ethan Ervin
#5
Leonard Farrow
#6
RJ Garcia II
#20
Joshua Harriott
#9
Dominique Henry
Branden Hoch
#3
Tucker Holloway
#8
Easton Messer
#22
Brady Tillman III
#2
Kelby Valsin
#4
Antojuan Woody
Defensive Line & Linebackers
#9
Jonathan Bax
#95
Nimari Brantley
#43
Hector Chavez
#12
Jay Crable
#2
Wilky Denaud
#1
CJ Doggette Jr.
#21
Nate Fischer
#31
Kenyon Garner
#6
Leon Hart Jr.
#28
Zyere Horton
#7
Khmari Johnson
#17
Char'Quez Lee
#15
Tyclean Luman
#14
Tycoolhill Luman
#11
Gavench Marcelin
#13
Earl Miller Jr.
#35
Tito Nunez
#10
Josh Roberts
#18
Joseph Sipp Jr.
#62
Enyce Sledge
#89
Nick Toussaint
Defensive Backs
Damon Allen
#16
Wallace Foster IV
#34
Brenden Guidroz
#23
JK Johnson
#4
Damarius McGhee
#3
Derrick Rogers
#20
Bo Simpson-Nealy
#22
Jayden Sweeney
#8
Chris Tooley III
#30
Justin Weatherall
Other
#41
Collin Rogers
Texas Southern
4th in SWAC - West
VS
Florida Atlantic
5th in American
Passing
54.1
Completion Percentage
69.8
98
Completions
236
2.20
Interception Percentage
1.50
4
Interceptions
5
54
Longest Pass
76
1,299
Net Passing Yards
2,637
162.4
Net Passing Yards Per Game
329.6
181
Passing Attempts
338
3.90
Passing Touchdown %
6.80
7
Passing Touchdowns
23
122.9
Passer Rating
154.8
26
Total Sacks
15
136
Sack Yards Lost
103
7.2
Yards Per Pass Attempt
7.8
1,299
Passing Yards
2,637
0
Passing Fumbles Lost
0
8
Team Games Played
8
352.1
Yards Per Game
440.0
24.6
Total Points Per Game
37.8
197
Total Points
302
24
Total Touchdowns
39
162.4
Passing Yards Per Game
329.6
98-181
Comp-Att
236-338
26-136
Sacks-Yards Lost
15-103
Rushing
317
Rushing Attempts
282
1,518
Rushing Yards
883
4.8
Yards Per Rush Attempt
3.1
86
Long Rushing
39
0
20+ Yard Rushing Plays
0
16
Rushing Touchdowns
11
189.8
Rushing Yards Per Game
110.4
0
Rushing Fumbles
0
0
Rushing Fumbles Lost
0
82
Rushing 1st downs
65
8
Team Games Played
8
2,817
Total Yards
3,520
524
Total Offensive Plays
635
24.6
Total Points Per Game
37.8
197
Total Points
302
24
Total Touchdowns
39
Receiving
98
Receptions
236
0
Receiving Targets
0
1,299
Receiving Yards
2,637
1,299
Receiving Yards
2,637
7
Receiving Touchdowns
23
54
Long Reception
76
0
20+ Yard Receiving Plays
0
162.4
Receiving Yards Per Game
329.6
0
Receiving Fumbles
0
0
Receiving Fumbles Lost
0
139
Receiving Yards After Catch
1235
43
Receiving First Downs
127
8
Team Games Played
8
13.3
Yards Per Reception
11.2
24.6
Total Points Per Game
37.8
197
Total Points
302
24
Total Touchdowns
39
Miscellaneous
141
Total 1st downs
207
82
Rushing 1st downs
65
44
Passing 1st downs
127
15
1st downs by penalty
14
41
Third Down Conversions
68
112
Third Down Attempts
129
36.61
3rd down %
52.71
9
Fourth Down Conversions
17
10
First Downs Attempts
27
90.00
4th down %
62.96
87
Total Penalties
58
723
Total Penalty Yards
474
13563
Possession Time Seconds
13030
0.00
Red Zone Field Goal Percentage
0.00
0.00
Red Zone Scoring Percentage
0.00
0.00
Red Zone Efficiency Percentage
0.00
0.00
Red Zone Touchdown Percentage
0.00
7
Total Takeaways
12
14
Total Giveaways
9
-7
Turnover Ratio
3
0
Fumbles Lost
0
41-112
3rd down efficiency
68-129
9-10
4th down efficiency
17-27
87-723
Total-Yards
58-474
Defense
262
Solo Tackles
261
276
Assist Tackles
282
538
Total Tackles
543
19
Sacks
8
128
Sack Yards
54
72
Stuffs
59
26
Passes Defended
17
7.7
Average Interception Yards
8.2
23
Long Interception
47
0
Miscellaneous Touchdowns
0
2
Kicks Blocked
1
39
Tackles For Loss
25
8
Team Games Played
8
Defensive Interceptions
3
Interceptions
6
23
Interception Yards
49
0
Interception Touchdowns
0
3-23
INT: Total
6-49
General
15
Fumbles
10
3
Forced Fumbles
7
3
Fumbles Recovered
7
0
Fumbles Touchdowns
1
8
Games Played
8
15-0
Fumbles-Lost
10-0
Returning
31
Kick Returns
24
582
Kick Return Yards
670
18.8
Yards Per Kick Return
27.9
54
Long Kick Return
98
0
Kick Return Touchdowns
2
8
Punt Returns
9
53
Punt Return Yards
248
6.6
Yards Per Punt Return
27.6
47
Long Punt Return
82
1
Punt Return Touchdowns
2
0
Punt Return Fair Catches
0
0
Kick Return Fumbles Lost
0
0
Punt Return Fumbles Lost
0
8
Team Games Played
8
8-53
Punt: Total
9-248
Kicking
10
Field Goal Made
9
14
Field Goal Attempts
13
71.4
Field Goal Percentage
69.2
48
Long Field Goal Made
60
1
Field Goal Attempts 1-19
1
1
Field Goal Attempts 20-29
1
3
Field Goal Attempts 30-39
3
7
Field Goal Attempts 40-49
4
2
Field Goal Attempts 50+
4
21
Extra Points Made
39
22
Extra Point Attempts
39
95.5
Extra Point Percentage
100.0
1
Field Goals Made 1-19
1
1
Field Goals Made 20-29
1
1
Field Goals Made 30-39
3
7
Field Goals Made 40-49
3
0
Field Goals Made 50+
1
51
Total Kicking Points
66
8
Team Games Played
8
24
Touchback Percentage
83
0.0
Average Kickoff Return Yards
0.0
0
Kickoff Return Yards
0
0
Kickoff Returns
0
0-0
Kickoffs: Total
0-0
10-14
FG: Good-Attempts
9-13
Punting
42
Punts
21
1,627
Punt Yards
852
84
Long Punt
56
38.7
Gross Average Punt Yards
40.6
38.7
Net Average Punt Yards
40.6
0
Punts Blocked
0
12
Punts Inside 20
7
0
Touchbacks
0
15
Fair Catches
6
13
Punt Returns
2
0
Punt Return Yards
0
0.0
Average Punt Return Yards
0.0
8
Team Games Played
8
42-1,627
Punt: Total Yards
21-852
Scoring
16
Rushing Touchdowns
11
7
Receiving Touchdowns
23
1
Return Touchdowns
4
24
Total Touchdowns
39
10
Field Goals
9
21
Kick Extra Points
39
1
Total Two Point Conversions
0
197
Total Points
302
24.6
Total Points Per Game
37.8