

Texas vs Tennessee Live Score (26 Sep, 2026)
Score by Quarter
| Team | Q1 | Q2 | Q3 | Q4 | Final |
|---|---|---|---|---|---|
 Texas |
7 | 3 | 3 | 7 | 20 |
 Tennessee |
3 | 0 | 7 | 7 | 17 |
Scoring Plays
Q1
10:58
10:58
Raleek Brown 9 Yd Run (Gianni Spetic Kick)
Rushing Touchdown
7 – 0
Q1
7:40
7:40
Cooper Ranvier 33 Yd Field Goal
Field Goal Good
7 – 3
Q2
14:29
14:29
Gianni Spetic 22 Yd Field Goal
Field Goal Good
10 – 3
Q3
11:14
11:14
Qua Moss 57 Yd Punt Return (Cooper Ranvier Kick)
Punt Return Touchdown
10 – 10
Q3
9:00
9:00
Gianni Spetic 44 Yd Field Goal
Field Goal Good
13 – 10
Q4
5:41
5:41
Raleek Brown 4 Yd Run (Gianni Spetic Kick)
Rushing Touchdown
20 – 10
Q4
1:22
1:22
Mike Matthews 30 Yd pass from Faizon Brandon (Cooper Ranvier Kick)
Pass Reception
20 – 17
Game Leaders
TexasTennessee
 A. Manning QB
Passing Yards
 F. Brandon QB
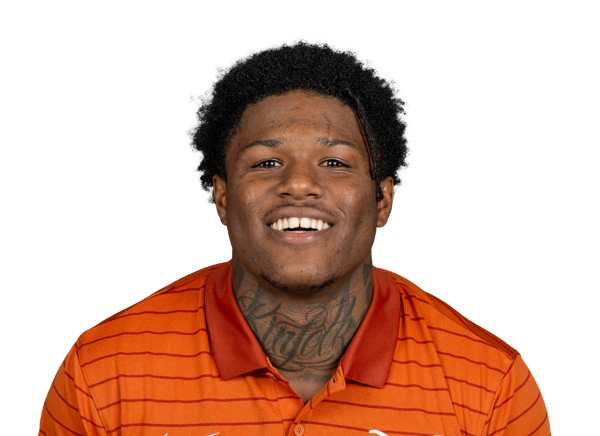 R. Brown RB
Rushing Yards
 D. Bishop RB
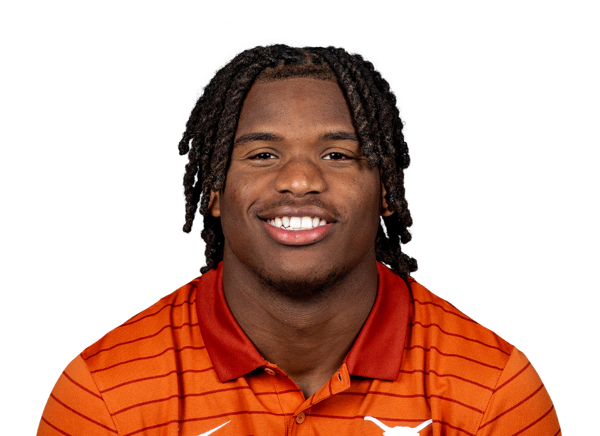 R. Wingo WR
Receiving Yards
 M. Matthews WR
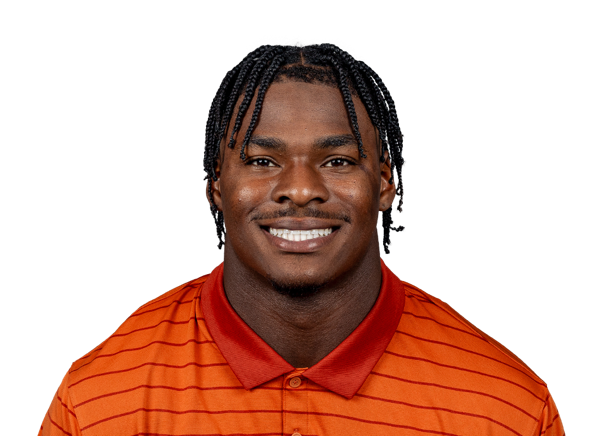 C. Simmons EDGE
Sacks
 T. Weathersby DL
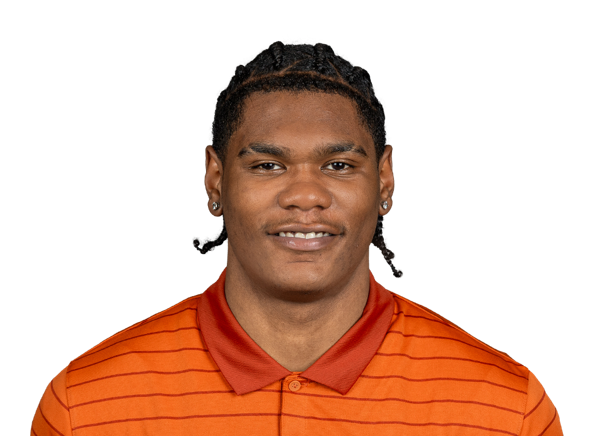 R. Biles LB
Tackles
 A. Carter LB
Player Box Score
Texas| Player | C/ATT | YDS | AVG | TD | INT | QBR |
|---|---|---|---|---|---|---|
| Arch Manning#16 | 14/19 | 201 | 10.6 | 0 | 1 | 53.1 |
Tennessee| Player | C/ATT | YDS | AVG | TD | INT | QBR |
|---|---|---|---|---|---|---|
| Faizon Brandon#11 | 17/29 | 145 | 5.0 | 1 | 0 | 55.8 |
 George MacIntyre#12 | 1/3 | 6 | 2.0 | 0 | 0 | 8.3 |
Texas| Player | CAR | YDS | AVG | TD | LONG |
|---|---|---|---|---|---|
| Raleek Brown | 17 | 67 | 3.9 | 2 | 10 |
 Derrek Cooper#5 | 7 | 7 | 1.0 | 0 | 9 |
| Arch Manning#16 | 11 | -1 | -0.1 | 0 | 11 |
 Team | 1 | -12 | -12.0 | 0 | 0 |
Tennessee| Player | CAR | YDS | AVG | TD | LONG |
|---|---|---|---|---|---|
| DeSean Bishop#18 | 11 | 34 | 3.1 | 0 | 7 |
 Daune Morris#17 | 9 | 33 | 3.7 | 0 | 13 |
| Faizon Brandon#11 | 23 | 2 | 0.1 | 0 | 16 |
| George MacIntyre#12 | 1 | 1 | 1.0 | 0 | 1 |
Texas| Player | REC | YDS | AVG | TD | LONG |
|---|---|---|---|---|---|
| Ryan Wingo#1 | 6 | 74 | 12.3 | 0 | 18 |
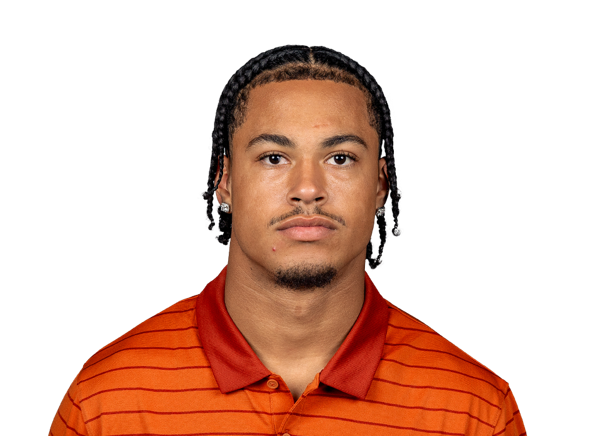 Emmett Mosley V#3 | 1 | 43 | 43.0 | 0 | 43 |
 Jermaine Bishop Jr.#4 | 2 | 34 | 17.0 | 0 | 29 |
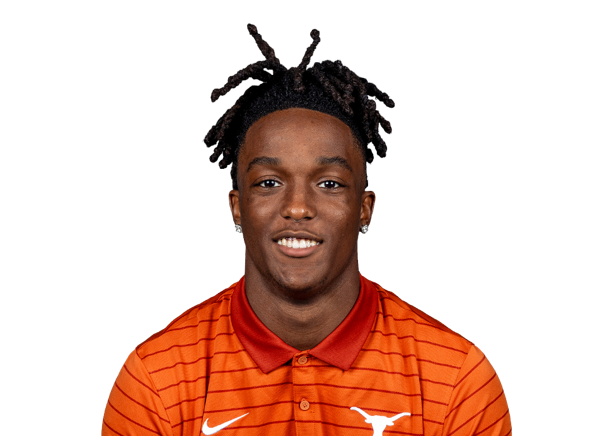 Cam Coleman#8 | 1 | 30 | 30.0 | 0 | 30 |
| Raleek Brown | 2 | 8 | 4.0 | 0 | 6 |
 Emaree Winston#85 | 1 | 6 | 6.0 | 0 | 6 |
| Derrek Cooper#5 | 1 | 6 | 6.0 | 0 | 6 |
Tennessee| Player | REC | YDS | AVG | TD | LONG |
|---|---|---|---|---|---|
| Mike Matthews#4 | 4 | 72 | 18.0 | 1 | 30 |
 Braylon Staley#14 | 7 | 45 | 6.4 | 0 | 11 |
 DaSaahn Brame#7 | 3 | 24 | 8.0 | 0 | 11 |
| DeSean Bishop#18 | 3 | 8 | 2.7 | 0 | 13 |
| Daune Morris#17 | 1 | 2 | 2.0 | 0 | 2 |
Texas| Player | TOT | SOLO | SACKS | TFL | PD | QB HUR | TD |
|---|---|---|---|---|---|---|---|
| Rasheem Biles#3 | 13 | 7 | 1 | 2 | 0 | 1 | 0 |
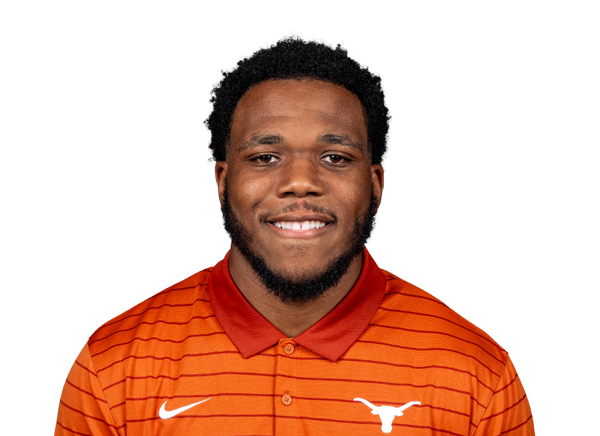 Justin Cryer#28 | 9 | 4 | 0 | 0 | 1 | 0 | 0 |
| Colin Simmons#1 | 8 | 6 | 5 | 5 | 0 | 1 | 0 |
 Jelani McDonald#4 | 8 | 3 | 0 | 0 | 1 | 0 | 0 |
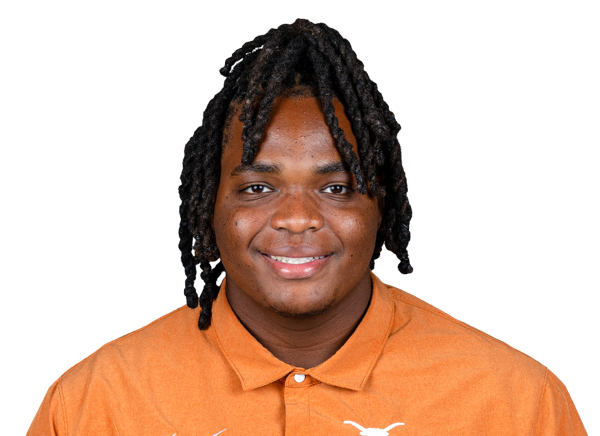 Maraad Watson#88 | 5 | 2 | 1 | 1 | 0 | 1 | 0 |
 Derek Williams Jr.#2 | 5 | 2 | 0 | 0 | 0 | 0 | 0 |
 Kade Phillips#8 | 4 | 2 | 0 | 1 | 0 | 0 | 0 |
 Lance Jackson#40 | 4 | 2 | 0 | 0 | 0 | 0 | 0 |
 Hero Kanu#93 | 4 | 1 | 1 | 1 | 0 | 1 | 0 |
 Zina Umeozulu#19 | 4 | 1 | 1 | 1 | 0 | 1 | 0 |
 Bo Mascoe#5 | 3 | 2 | 0 | 0 | 0 | 0 | 0 |
 Graceson Littleton#29 | 3 | 2 | 0 | 0 | 1 | 0 | 0 |
 Kobe Black#6 | 3 | 0 | 0 | 0 | 0 | 0 | 0 |
 Alex January#97 | 1 | 1 | 1 | 1 | 1 | 0 | 0 |
 Ryan Niblett#21 | 1 | 1 | 0 | 0 | 0 | 0 | 0 |
 Warren Roberson#24 | 1 | 1 | 0 | 0 | 0 | 0 | 0 |
| Cam Coleman#8 | 1 | 1 | 0 | 0 | 0 | 0 | 0 |
 Rett Andersen#35 | 1 | 1 | 0 | 0 | 0 | 0 | 0 |
 Kosi Okpala#18 | 1 | 1 | 0 | 0 | 0 | 0 | 0 |
 Brad Spence#14 | 1 | 0 | 0 | 0 | 0 | 0 | 0 |
 Ian Geffrard#95 | 0 | 0 | 0 | 0 | 0 | 1 | 0 |
Tennessee| Player | TOT | SOLO | SACKS | TFL | PD | QB HUR | TD |
|---|---|---|---|---|---|---|---|
| Arion Carter#7 | 11 | 5 | 0 | 0.5 | 0 | 1 | 0 |
| Tyree Weathersby#18 | 6 | 1 | 2.5 | 2.5 | 0 | 0 | 0 |
 Carson Gentle#35 | 5 | 4 | 0 | 0 | 0 | 0 | 0 |
 Qua Moss#6 | 5 | 4 | 0 | 0 | 1 | 0 | 1 |
 Amare Campbell | 5 | 3 | 1 | 2 | 0 | 0 | 0 |
 Daevin Hobbs#5 | 5 | 3 | 0 | 1.5 | 0 | 0 | 0 |
 TJ Metcalf#1 | 5 | 2 | 0 | 0 | 0 | 0 | 0 |
 Xavier Gilliam#2 | 4 | 1 | 1 | 2 | 0 | 1 | 0 |
 Jeremiah Telander#22 | 3 | 1 | 0 | 0 | 0 | 0 | 0 |
 Dejuan Lane#10 | 3 | 1 | 0 | 0 | 0 | 0 | 0 |
 Kayin Lee#14 | 2 | 2 | 0 | 0 | 0 | 0 | 0 |
 Ty Redmond#4 | 2 | 1 | 0 | 0 | 1 | 0 | 0 |
 Jordan Norman#33 | 2 | 0 | 0 | 0 | 0 | 0 | 0 |
 Mariyon Dye#9 | 1 | 1 | 1 | 1 | 0 | 0 | 0 |
 DJ Burks#42 | 1 | 1 | 0 | 0 | 0 | 0 | 0 |
 Edwin Spillman#13 | 1 | 0 | 0 | 0 | 0 | 0 | 0 |
 Isaiah Campbell#47 | 1 | 0 | 0.5 | 0.5 | 0 | 0 | 0 |
 Travis Smith Jr.#1 | 1 | 0 | 0 | 0 | 0 | 0 | 0 |
 Joel Wyatt#31 | 1 | 0 | 0 | 0 | 0 | 0 | 0 |
Texas| Player | FUM | LOST | REC |
|---|---|---|---|
| Team | 2 | 1 | 0 |
Tennessee| Player | FUM | LOST | REC |
|---|---|---|---|
| Faizon Brandon#11 | 2 | 0 | 0 |
| Arion Carter#7 | 0 | 0 | 1 |
Texas| Player | FG | PCT | LONG | XP | PTS |
|---|---|---|---|---|---|
 Gianni Spetic#44 | 2/2 | 100.0 | 44 | 2/2 | 8 |
Tennessee| Player | FG | PCT | LONG | XP | PTS |
|---|---|---|---|---|---|
 Cooper Ranvier#28 | 1/1 | 100.0 | 33 | 2/2 | 5 |
Texas| Player | NO | YDS | AVG | TB | In 20 | LONG |
|---|---|---|---|---|---|---|
 Mac Chiumento#43 | 7 | 323 | 46.1 | 1 | 2 | 54 |
Tennessee| Player | NO | YDS | AVG | TB | In 20 | LONG |
|---|---|---|---|---|---|---|
 Jackson Ross#98 | 7 | 324 | 46.3 | 0 | 1 | 51 |
Texas| Player | NO | YDS | AVG | LONG | TD |
|---|---|---|---|---|---|
| Ryan Niblett#21 | 1 | 21 | 21.0 | 21 | 0 |
| Team | 1 | -2 | -2.0 | 0 | 0 |
Tennessee| Player | NO | YDS | AVG | LONG | TD |
|---|---|---|---|---|---|
| Daune Morris#17 | 2 | 36 | 18.0 | 19 | 0 |
Texas| Player | NO | YDS | AVG | LONG | TD |
|---|---|---|---|---|---|
| Ryan Niblett#21 | 4 | 57 | 14.3 | 20 | 0 |
Tennessee| Player | NO | YDS | AVG | LONG | TD |
|---|---|---|---|---|---|
| Qua Moss#6 | 3 | 58 | 19.3 | 57 | 1 |
Tennessee| Player | INT | YDS | TD |
|---|---|---|---|
| Kayin Lee#14 | 1 | 0 | 0 |
Drive Summary
TEX
Touchdown
75
TENN
Field Goal
60
TEX
Punt
-6
TENN
Punt
-9
TEX
Field Goal
62
TENN
Punt
3
TEX
Interception
5
TENN
Punt
13
TEX
Punt
3
TENN
Downs
58
TEX
Punt
3
TENN
End of Half
3
TENN
Punt
31
TEX
Punt Touchdown
3
TEX
Field Goal
48
TENN
Punt
-1
TEX
Punt
2
TENN
Punt
21
TEX
Punt
13
TENN
Punt
-4
TEX
Touchdown
60
TENN
Downs
6
TEX
Punt
-11
TENN
Touchdown
80
TENN
End of Game
5
Injury Report
No current injury report is available for this matchup.
Head-to-Head
Historical meetings are not available for this matchup.
Game Information
StageWeek 4
Season2026
KickoffSat, Sep 26, 12:00 pm
VenueNeyland Stadium
LocationKnoxville, TN
SurfaceGrass
BroadcastABC
Attendance101,915
Division Standings
FBS — Southeastern Conference
| Team | W | L | T | Pct | PF | PA | Home | Away | Strk |
|---|---|---|---|---|---|---|---|---|---|
 Alabama | 8 | 2 | 0 | 0.800 | 358 | 189 | 4-1 | 4-1 | W3 |
 Florida | 6 | 4 | 0 | 0.600 | 313 | 262 | 3-2 | 3-2 | W1 |
 Georgia | 9 | 1 | 0 | 0.900 | 418 | 147 | 6-1 | 3-0 | W3 |
 Mississippi State | 4 | 6 | 0 | 0.400 | 245 | 291 | 2-4 | 2-2 | L6 |
| Texas | 8 | 2 | 0 | 0.800 | 302 | 178 | 5-1 | 3-1 | W4 |
 Ole Miss | 6 | 3 | 0 | 0.667 | 304 | 234 | 5-1 | 1-2 | L1 |
 Auburn | 6 | 4 | 0 | 0.600 | 260 | 246 | 4-2 | 2-2 | W2 |
 Kentucky | 7 | 3 | 0 | 0.700 | 283 | 253 | 4-2 | 3-1 | L2 |
 LSU | 6 | 4 | 0 | 0.600 | 355 | 181 | 5-2 | 1-2 | L2 |
 Missouri | 6 | 4 | 0 | 0.600 | 293 | 229 | 4-1 | 2-3 | L2 |
| Tennessee | 8 | 2 | 0 | 0.800 | 314 | 143 | 5-1 | 3-1 | W2 |
 Vanderbilt | 4 | 6 | 0 | 0.400 | 213 | 286 | 3-3 | 1-3 | L1 |
 Arkansas | 4 | 6 | 0 | 0.400 | 214 | 253 | 3-3 | 1-3 | W1 |
 Oklahoma | 5 | 4 | 0 | 0.556 | 199 | 173 | 3-2 | 2-2 | W1 |
 South Carolina | 6 | 4 | 0 | 0.600 | 318 | 245 | 4-2 | 2-2 | L1 |
 Texas A&M | 4 | 6 | 0 | 0.400 | 242 | 190 | 4-2 | 0-4 | L3 |
Texas
2nd in SEC
VS
Tennessee
2nd in SEC
Quarterbacks & Specialists
#43
Mac Chiumento
#16
Arch Manning
Receivers & Backs
#35
Rett Andersen
#4
Jermaine Bishop Jr.
Raleek Brown
#8
Cam Coleman
#5
Derrek Cooper
#3
Emmett Mosley V
#21
Ryan Niblett
#1
Ryan Wingo
#85
Emaree Winston
Defensive Line & Linebackers
#3
Rasheem Biles
#28
Justin Cryer
#95
Ian Geffrard
#97
Alex January
#93
Hero Kanu
#18
Kosi Okpala
#14
Brad Spence
#88
Maraad Watson
Defensive Backs
#6
Kobe Black
#29
Graceson Littleton
#5
Bo Mascoe
#4
Jelani McDonald
#8
Kade Phillips
#24
Warren Roberson
#2
Derek Williams Jr.
Other
#40
Lance Jackson
#1
Colin Simmons
#44
Gianni Spetic
#19
Zina Umeozulu
Quarterbacks & Specialists
#11
Faizon Brandon
#12
George MacIntyre
#98
Jackson Ross
Receivers & Backs
#18
DeSean Bishop
#7
DaSaahn Brame
#4
Mike Matthews
#17
Daune Morris
#1
Travis Smith Jr.
#14
Braylon Staley
Defensive Line & Linebackers
Amare Campbell
#47
Isaiah Campbell
#7
Arion Carter
#9
Mariyon Dye
#35
Carson Gentle
#2
Xavier Gilliam
#5
Daevin Hobbs
#33
Jordan Norman
#13
Edwin Spillman
#22
Jeremiah Telander
#18
Tyree Weathersby
Defensive Backs
#42
DJ Burks
#10
Dejuan Lane
#14
Kayin Lee
#1
TJ Metcalf
#6
Qua Moss
#4
Ty Redmond
#31
Joel Wyatt
Other
#28
Cooper Ranvier
Texas
4th in SEC
VS
Tennessee
4th in SEC
Passing
66.7
Completion Percentage
64.4
176
Completions
143
2.70
Interception Percentage
1.80
7
Interceptions
4
62
Longest Pass
68
2,087
Net Passing Yards
1,601
231.9
Net Passing Yards Per Game
177.9
264
Passing Attempts
222
6.80
Passing Touchdown %
4.50
18
Passing Touchdowns
10
150.2
Passer Rating
136.1
27
Total Sacks
21
188
Sack Yards Lost
121
7.9
Yards Per Pass Attempt
7.2
2,087
Passing Yards
1,601
0
Passing Fumbles Lost
0
9
Team Games Played
9
360.7
Yards Per Game
393.9
31.1
Total Points Per Game
32.4
280
Total Points
292
34
Total Touchdowns
36
231.9
Passing Yards Per Game
177.9
176-264
Comp-Att
143-222
27-188
Sacks-Yards Lost
21-121
Rushing
329
Rushing Attempts
389
1,159
Rushing Yards
1,944
3.5
Yards Per Rush Attempt
5.0
47
Long Rushing
73
0
20+ Yard Rushing Plays
0
13
Rushing Touchdowns
24
128.8
Rushing Yards Per Game
216.0
0
Rushing Fumbles
0
0
Rushing Fumbles Lost
0
73
Rushing 1st downs
103
9
Team Games Played
9
3,246
Total Yards
3,545
620
Total Offensive Plays
632
31.1
Total Points Per Game
32.4
280
Total Points
292
34
Total Touchdowns
36
Receiving
176
Receptions
143
0
Receiving Targets
0
2,087
Receiving Yards
1,601
2,087
Receiving Yards
1,601
18
Receiving Touchdowns
10
62
Long Reception
68
0
20+ Yard Receiving Plays
0
231.9
Receiving Yards Per Game
177.9
0
Receiving Fumbles
0
0
Receiving Fumbles Lost
0
1133
Receiving Yards After Catch
958
90
Receiving First Downs
68
9
Team Games Played
9
11.9
Yards Per Reception
11.2
31.1
Total Points Per Game
32.4
280
Total Points
292
34
Total Touchdowns
36
Miscellaneous
178
Total 1st downs
193
73
Rushing 1st downs
103
91
Passing 1st downs
68
14
1st downs by penalty
22
49
Third Down Conversions
45
124
Third Down Attempts
122
39.52
3rd down %
36.89
7
Fourth Down Conversions
12
12
First Downs Attempts
16
58.33
4th down %
75.00
60
Total Penalties
67
567
Total Penalty Yards
557
16271
Possession Time Seconds
16359
0.00
Red Zone Field Goal Percentage
0.00
0.00
Red Zone Scoring Percentage
0.00
0.00
Red Zone Efficiency Percentage
0.00
0.00
Red Zone Touchdown Percentage
0.00
14
Total Takeaways
15
14
Total Giveaways
11
0
Turnover Ratio
4
0
Fumbles Lost
0
49-124
3rd down efficiency
45-122
7-12
4th down efficiency
12-16
60-567
Total-Yards
67-557
Defense
321
Solo Tackles
300
286
Assist Tackles
258
607
Total Tackles
558
27
Sacks
39
152
Sack Yards
218
76
Stuffs
85
42
Passes Defended
35
3.2
Average Interception Yards
10.0
15
Long Interception
41
0
Miscellaneous Touchdowns
0
2
Kicks Blocked
1
52
Tackles For Loss
63
9
Team Games Played
9
Defensive Interceptions
6
Interceptions
9
19
Interception Yards
90
0
Interception Touchdowns
1
6-19
INT: Total
9-90
General
14
Fumbles
16
8
Forced Fumbles
7
7
Fumbles Recovered
11
2
Fumbles Touchdowns
0
9
Games Played
9
14-0
Fumbles-Lost
16-0
Returning
9
Kick Returns
8
131
Kick Return Yards
130
14.6
Yards Per Kick Return
16.3
28
Long Kick Return
25
0
Kick Return Touchdowns
0
20
Punt Returns
11
217
Punt Return Yards
115
10.9
Yards Per Punt Return
10.5
63
Long Punt Return
57
1
Punt Return Touchdowns
1
0
Punt Return Fair Catches
0
0
Kick Return Fumbles Lost
0
0
Punt Return Fumbles Lost
0
9
Team Games Played
9
20-217
Punt: Total
11-115
Kicking
14
Field Goal Made
13
15
Field Goal Attempts
14
93.3
Field Goal Percentage
92.9
52
Long Field Goal Made
49
0
Field Goal Attempts 1-19
0
5
Field Goal Attempts 20-29
1
5
Field Goal Attempts 30-39
7
3
Field Goal Attempts 40-49
5
2
Field Goal Attempts 50+
1
34
Extra Points Made
35
34
Extra Point Attempts
35
100.0
Extra Point Percentage
100.0
0
Field Goals Made 1-19
0
5
Field Goals Made 20-29
1
5
Field Goals Made 30-39
7
3
Field Goals Made 40-49
5
1
Field Goals Made 50+
0
76
Total Kicking Points
74
9
Team Games Played
9
61
Touchback Percentage
81
0.0
Average Kickoff Return Yards
0.0
0
Kickoff Return Yards
0
0
Kickoff Returns
0
0-0
Kickoffs: Total
0-0
14-15
FG: Good-Attempts
13-14
Punting
41
Punts
37
1,683
Punt Yards
1,597
57
Long Punt
57
41.0
Gross Average Punt Yards
43.2
41.0
Net Average Punt Yards
43.2
0
Punts Blocked
0
10
Punts Inside 20
18
2
Touchbacks
2
18
Fair Catches
21
10
Punt Returns
8
0
Punt Return Yards
0
0.0
Average Punt Return Yards
0.0
9
Team Games Played
9
41-1,683
Punt: Total Yards
37-1,597
Scoring
13
Rushing Touchdowns
24
18
Receiving Touchdowns
10
1
Return Touchdowns
1
34
Total Touchdowns
35
14
Field Goals
13
34
Kick Extra Points
35
0
Total Two Point Conversions
1
280
Total Points
292
31.1
Total Points Per Game
32.4