

Troy vs Utah State Live Score (26 Sep, 2026)
Score by Quarter
| Team | Q1 | Q2 | Q3 | Q4 | Final |
|---|---|---|---|---|---|
 Troy | 7 | 3 | 0 | 0 | 10 |
 Utah State | 7 | 0 | 14 | 0 | 21 |
Scoring Plays
Q1
13:46
13:46
Javon Robinson 57 Yd pass from Grady Brosterhous (Kian Afrookhteh Kick)
Passing Touchdown
0 – 7
Q1
7:56
7:56
Howard Kinchen 13 Yd pass from Goose Crowder (Ethan Head Kick)
Passing Touchdown
7 – 7
Q2
10:24
10:24
Ethan Head 45 Yd Field Goal
Field Goal Good
10 – 7
Q3
11:02
11:02
Eli Wood 5 Yd pass from Grady Brosterhous (Kian Afrookhteh Kick)
Passing Touchdown
10 – 14
Q3
4:51
4:51
Javen Jacobs 6 Yd Run (Kian Afrookhteh Kick)
Rushing Touchdown
10 – 21
Game Leaders
TroyUtah State
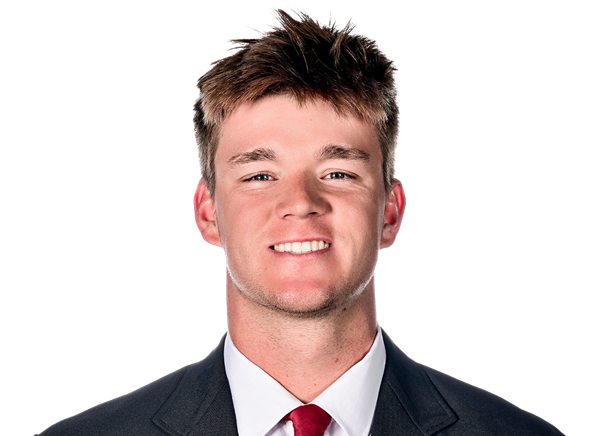 G. Crowder QB
Passing Yards
 G. Brosterhous QB
 G. Griffin RB
Rushing Yards
G. Brosterhous QB N. White WR
Receiving Yards
 E. Wood WR
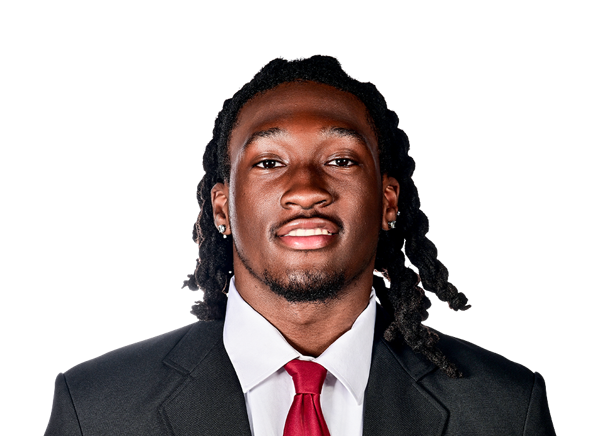 D. Smith DB
Sacks
—
J. Keyes STackles
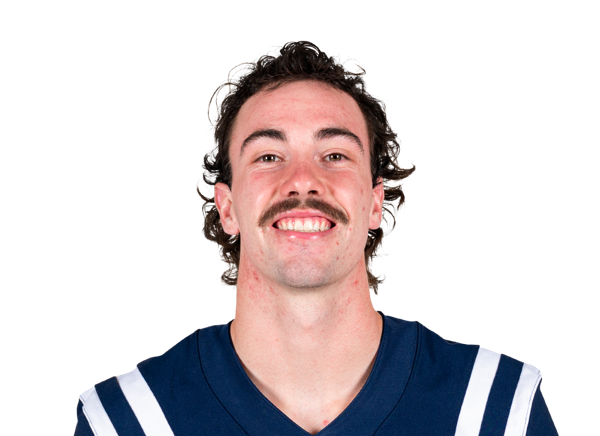 B. Hamblin S
Player Box Score
Troy| Player | C/ATT | YDS | AVG | TD | INT |
|---|---|---|---|---|---|
| Goose Crowder#9 | 25/49 | 226 | 4.6 | 1 | 3 |
Utah State| Player | C/ATT | YDS | AVG | TD | INT |
|---|---|---|---|---|---|
| Grady Brosterhous#9 | 18/28 | 242 | 8.6 | 2 | 1 |
Troy| Player | CAR | YDS | AVG | TD | LONG |
|---|---|---|---|---|---|
| Gavin Griffin | 11 | 66 | 6.0 | 0 | 39 |
| Goose Crowder#9 | 5 | 48 | 9.6 | 0 | 22 |
 Jordan Lovett#1 | 8 | 39 | 4.9 | 0 | 24 |
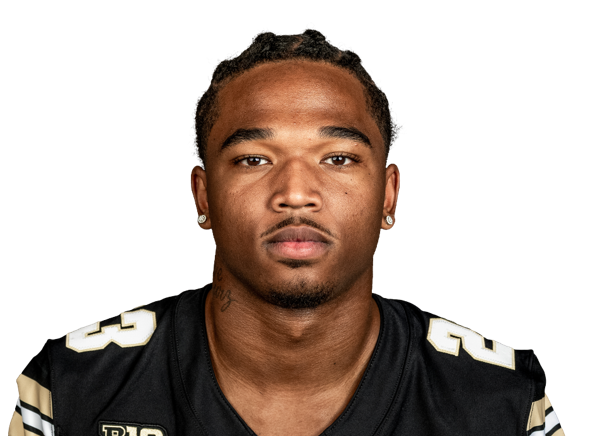 Jaheim Merriweather#3 | 7 | 16 | 2.3 | 0 | 8 |
Utah State| Player | CAR | YDS | AVG | TD | LONG |
|---|---|---|---|---|---|
| Grady Brosterhous#9 | 15 | 89 | 5.9 | 0 | 22 |
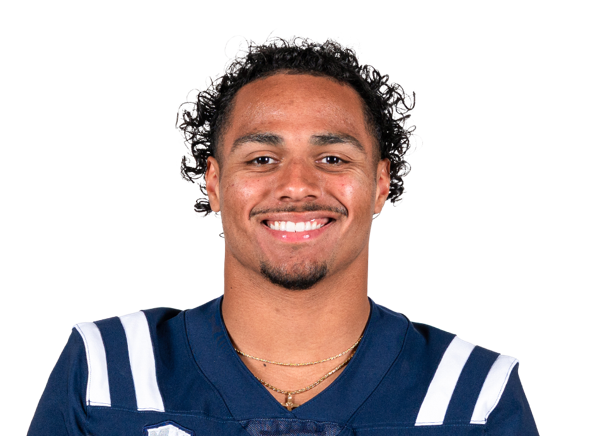 Javen Jacobs#8 | 14 | 84 | 6.0 | 1 | 36 |
| Team | 2 | -2 | -1.0 | 0 | 0 |
Troy| Player | REC | YDS | AVG | TD | LONG |
|---|---|---|---|---|---|
| Noreel White#4 | 6 | 75 | 12.5 | 0 | 36 |
| Howard Kinchen#18 | 6 | 58 | 9.7 | 1 | 14 |
 Jace Petty#17 | 4 | 30 | 7.5 | 0 | 18 |
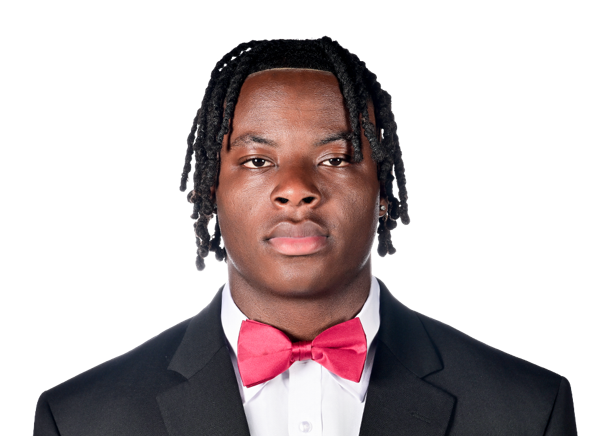 Mojo Dortch#5 | 3 | 23 | 7.7 | 0 | 12 |
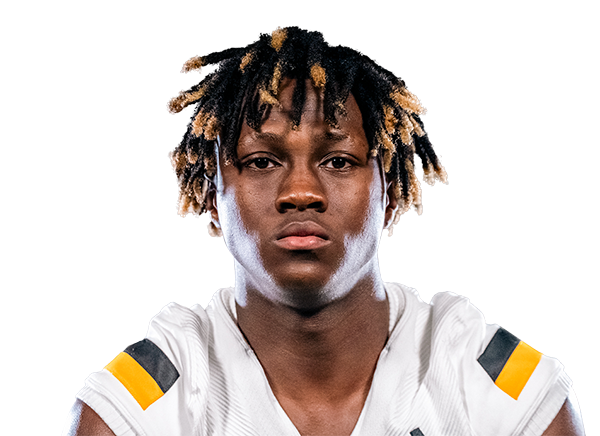 TK Keyes#8 | 3 | 20 | 6.7 | 0 | 11 |
| Gavin Griffin | 2 | 16 | 8.0 | 0 | 11 |
| Jordan Lovett#1 | 1 | 4 | 4.0 | 0 | 4 |
Utah State| Player | REC | YDS | AVG | TD | LONG |
|---|---|---|---|---|---|
| Eli Wood#7 | 7 | 96 | 13.7 | 1 | 25 |
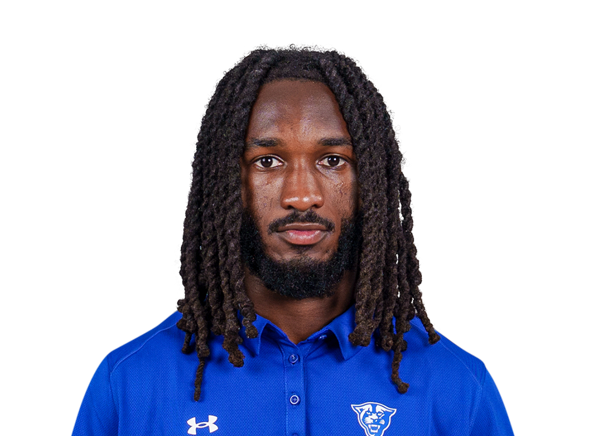 Javon Robinson | 4 | 67 | 16.8 | 1 | 57 |
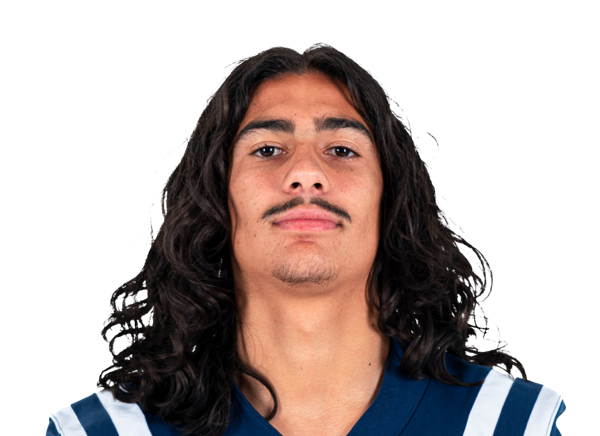 Nikko Boncore#4 | 4 | 66 | 16.5 | 0 | 43 |
| Javen Jacobs#8 | 2 | 11 | 5.5 | 0 | 6 |
 Noah White#23 | 1 | 2 | 2.0 | 0 | 2 |
Troy| Player | TOT | SOLO | SACKS | TFL | PD | QB HUR | TD |
|---|---|---|---|---|---|---|---|
| Jamarion Keyes#9 | 9 | 4 | 0 | 0 | 0 | 0 | 0 |
 Keno Jones#15 | 8 | 5 | 0 | 0.5 | 0 | 0 | 0 |
 Justin Powe#6 | 7 | 3 | 0 | 1 | 0 | 0 | 0 |
 Jordan Perry#18 | 5 | 2 | 0 | 0 | 0 | 1 | 0 |
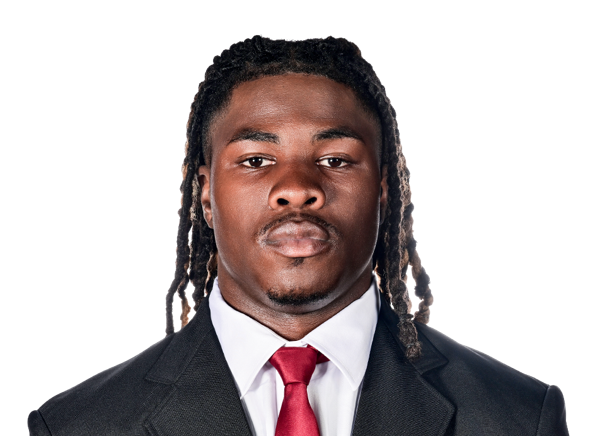 TJ Thompson#4 | 5 | 2 | 0 | 0.5 | 0 | 0 | 0 |
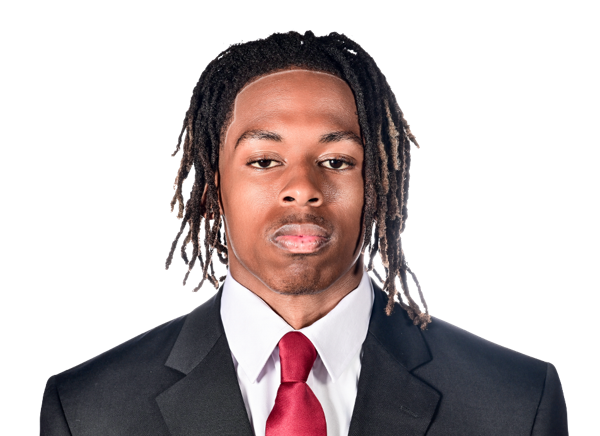 Jabari Strait#1 | 4 | 2 | 0 | 0 | 1 | 1 | 0 |
 Kam Curry | 4 | 1 | 0 | 0 | 0 | 0 | 0 |
| Donnie Smith#22 | 3 | 1 | 1 | 1 | 0 | 0 | 0 |
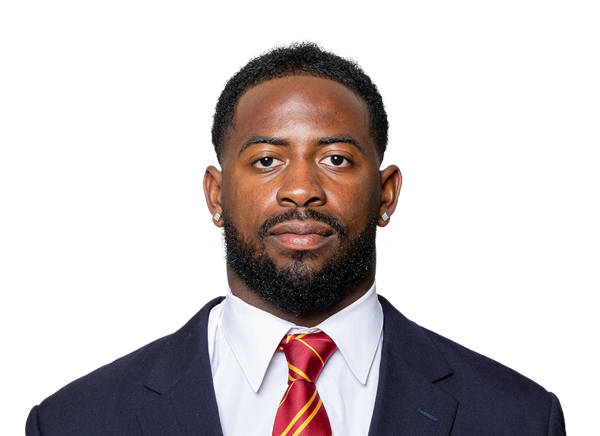 Bryce Steele#2 | 3 | 1 | 0 | 0 | 0 | 0 | 0 |
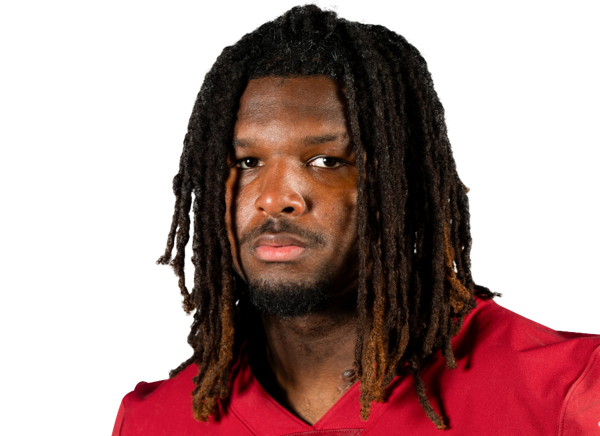 Kavion Henderson#25 | 3 | 1 | 0 | 0 | 0 | 1 | 0 |
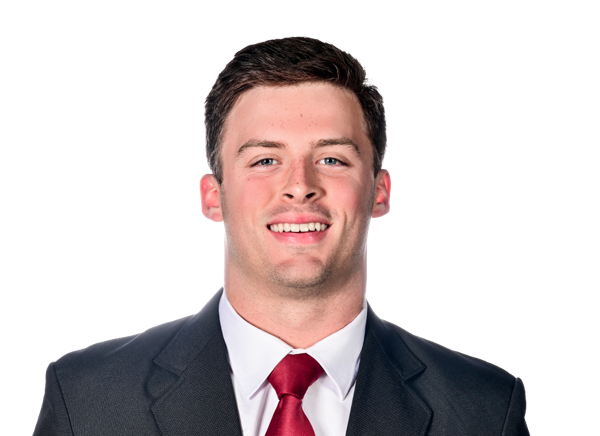 Luke Hodge#44 | 2 | 0 | 0 | 0 | 0 | 0 | 0 |
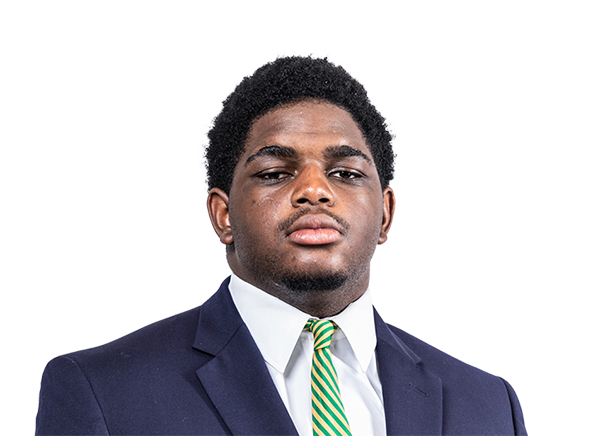 Miquon Merriweather#95 | 2 | 0 | 0 | 0 | 0 | 0 | 0 |
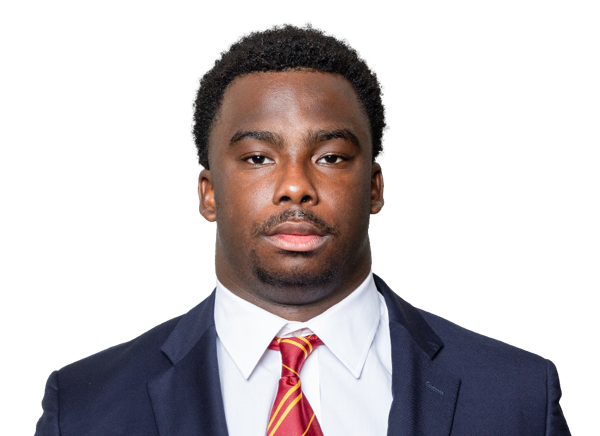 Ty Clemons#11 | 1 | 1 | 0 | 0 | 0 | 0 | 0 |
 Luke Petit#51 | 1 | 1 | 0 | 0 | 0 | 0 | 0 |
| Noreel White#4 | 1 | 1 | 0 | 0 | 0 | 0 | 0 |
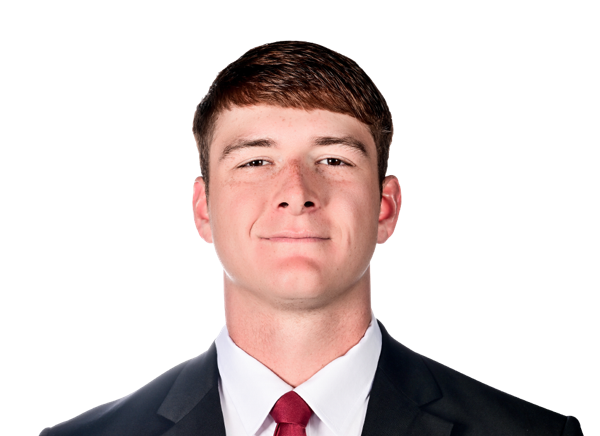 Colton Walls#87 | 1 | 1 | 0 | 0 | 0 | 0 | 0 |
| Gavin Griffin | 1 | 1 | 0 | 0 | 0 | 0 | 0 |
| Tai Terrell#21 | 1 | 1 | 0 | 0 | 0 | 0 | 0 |
 Shemar Welch#12 | 1 | 0 | 0 | 0 | 0 | 0 | 0 |
| Doug Nelson#3 | 1 | 0 | 0 | 0 | 1 | 0 | 0 |
| RaKeem Davis#93 | 1 | 0 | 0 | 0 | 0 | 0 | 0 |
Utah State| Player | TOT | SOLO | SACKS | TFL | PD | QB HUR | TD |
|---|---|---|---|---|---|---|---|
| Brevin Hamblin#4 | 12 | 5 | 0 | 0 | 0 | 1 | 0 |
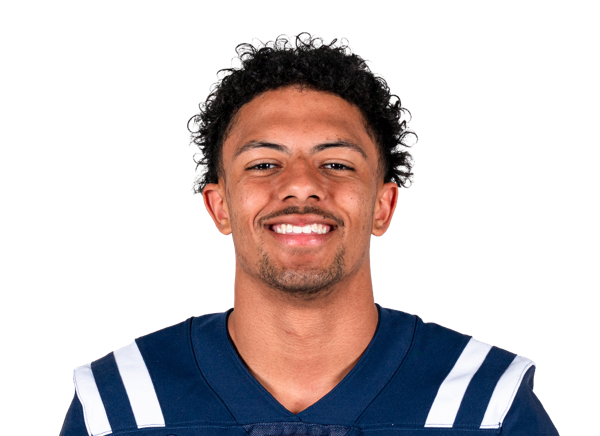 D'Angelo Mayes#15 | 8 | 5 | 0 | 0 | 1 | 0 | 0 |
 Chapman Lewis#21 | 7 | 1 | 0 | 0 | 0 | 0 | 0 |
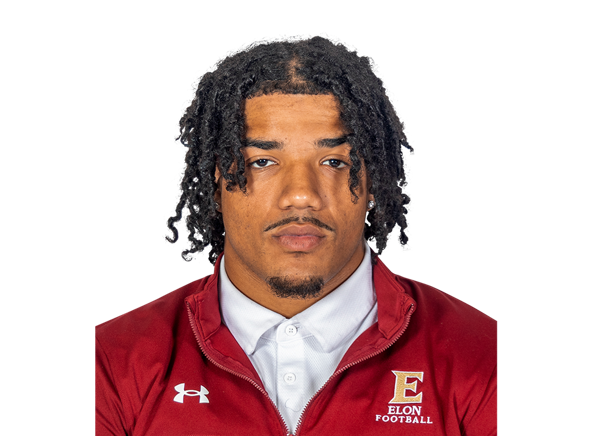 Asher Cunningham#11 | 6 | 2 | 0 | 1 | 0 | 1 | 0 |
 Carson Tujague#28 | 6 | 1 | 0 | 1 | 1 | 1 | 0 |
 Bronson Olevao Jr.#14 | 6 | 0 | 0 | 0 | 0 | 1 | 0 |
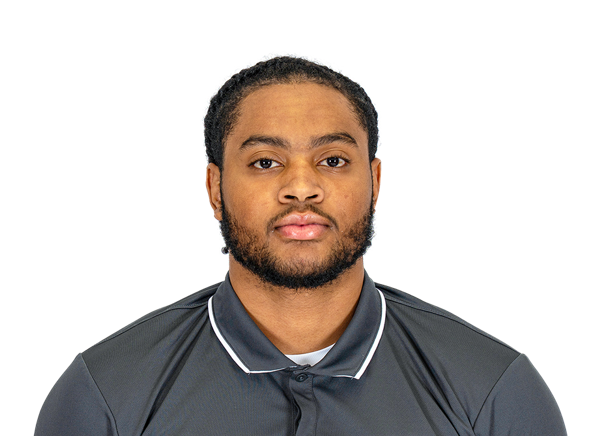 Adonis Jackson#32 | 6 | 0 | 0 | 0 | 0 | 0 | 0 |
 James Jennette#18 | 5 | 0 | 0 | 0 | 0 | 1 | 0 |
 Markie Grant#5 | 3 | 3 | 0 | 0 | 4 | 0 | 0 |
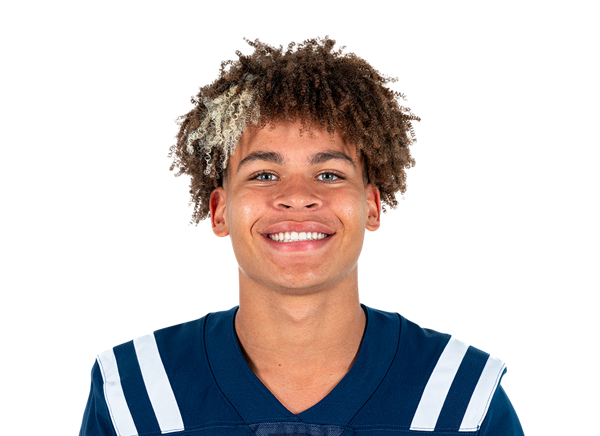 Charger Doty#3 | 3 | 2 | 0 | 0 | 0 | 0 | 0 |
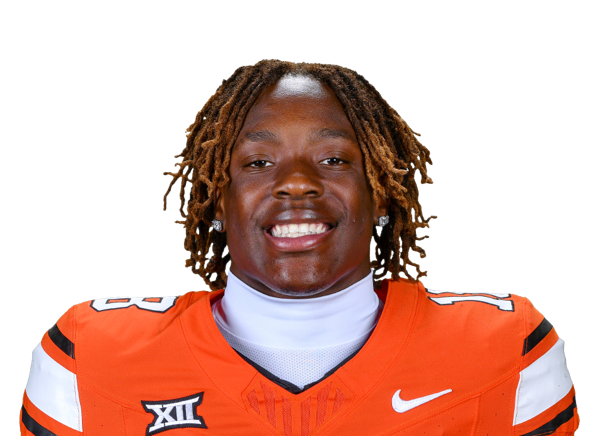 David Kabongo#8 | 3 | 1 | 0 | 0 | 0 | 1 | 0 |
 Tyree Morris#9 | 3 | 0 | 0 | 0 | 1 | 0 | 0 |
 Kye Stokes#2 | 2 | 2 | 0 | 0 | 0 | 0 | 0 |
 Jordan Pendleton#17 | 2 | 0 | 0 | 0 | 0 | 0 | 0 |
 Ta'avili Tuitama#51 | 2 | 0 | 0 | 0 | 0 | 0 | 0 |
 Tevita Tuha#55 | 2 | 0 | 0 | 0 | 0 | 0 | 0 |
 John Shepard#22 | 1 | 1 | 0 | 0 | 0 | 0 | 0 |
| Noah White#23 | 1 | 1 | 0 | 0 | 0 | 0 | 0 |
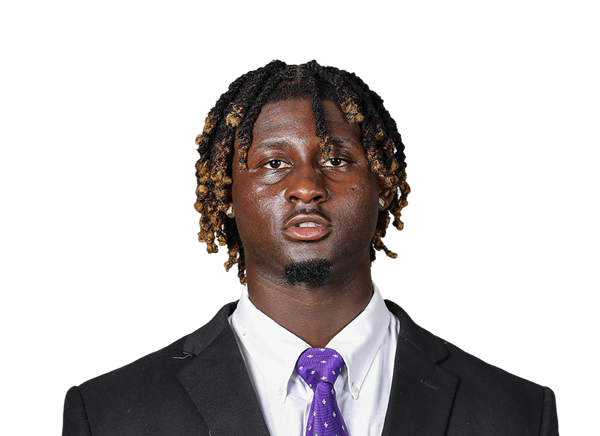 BJ Diakite | 1 | 0 | 0 | 0 | 0 | 0 | 0 |
 Paxton Naegle#10 | 1 | 0 | 0 | 0 | 0 | 1 | 0 |
Troy| Player | FUM | LOST | REC |
|---|---|---|---|
| Jordan Lovett#1 | 1 | 0 | 0 |
| Keno Jones#15 | 0 | 0 | 1 |
Utah State| Player | FUM | LOST | REC |
|---|---|---|---|
| Nikko Boncore#4 | 1 | 1 | 0 |
Troy| Player | FG | PCT | LONG | XP | PTS |
|---|---|---|---|---|---|
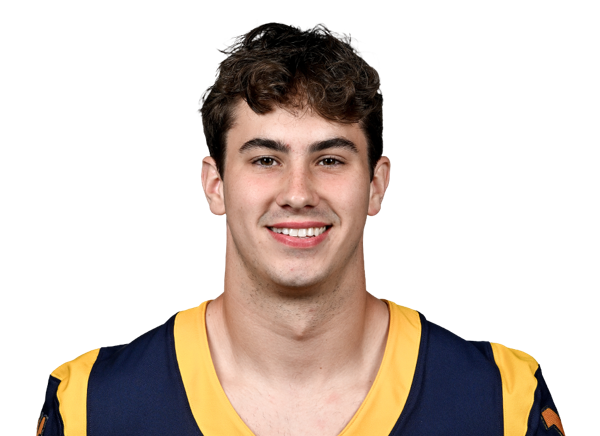 Ethan Head#33 | 1/3 | 33.0 | 45 | 1/1 | 4 |
Utah State| Player | FG | PCT | LONG | XP | PTS |
|---|---|---|---|---|---|
 Kian Afrookhteh#19 | 0/1 | 0.0 | 0 | 3/3 | 3 |
Troy| Player | NO | YDS | AVG | TB | In 20 | LONG |
|---|---|---|---|---|---|---|
 Evan Crenshaw#28 | 4 | 173 | 43.3 | 1 | 2 | 52 |
Utah State| Player | NO | YDS | AVG | TB | In 20 | LONG |
|---|---|---|---|---|---|---|
 Landon Rehkow#3 | 5 | 191 | 38.2 | 0 | 2 | 46 |
Troy| Player | NO | YDS | AVG | LONG | TD |
|---|---|---|---|---|---|
| Noreel White#4 | 1 | 0 | 0.0 | 0 | 0 |
Utah State| Player | NO | YDS | AVG | LONG | TD |
|---|---|---|---|---|---|
| Javen Jacobs#8 | 2 | 4 | 2.0 | 4 | 0 |
Troy| Player | INT | YDS | TD |
|---|---|---|---|
| Jamarion Keyes#9 | 1 | 1 | 0 |
Utah State| Player | INT | YDS | TD |
|---|---|---|---|
| Brevin Hamblin#4 | 1 | 33 | 0 |
| D'Angelo Mayes#15 | 1 | 30 | 0 |
| David Kabongo#8 | 1 | 27 | 0 |
Drive Summary
TROY
Punt
6
USU
Touchdown
57
TROY
Touchdown
75
USU
Punt
35
TROY
Downs
45
USU
Missed FG
41
TROY
Field Goal
53
USU
Interception
17
TROY
Punt
4
USU
Punt
24
TROY
Punt
14
USU
Punt
7
TROY
Interception
30
USU
End Of Half
10
USU
Touchdown
75
TROY
Punt
23
USU
Touchdown
80
TROY
Missed FG
66
USU
Punt
6
TROY
Missed FG
42
USU
Fumble
55
TROY
Interception
55
USU
Punt
23
TROY
Interception
27
USU
End of Game
-2
Injury Report
No current injury report is available for this matchup.
Head-to-Head
Historical meetings are not available for this matchup.
Game Information
StageWeek 4
Season2026
KickoffSat, Sep 26, 7:30 pm
VenueMaverik Stadium
LocationLogan, UT
SurfaceArtificial Turf
BroadcastCBSSN
Attendance22,037
Division Standings
FBS — Pac-12 Conference
| Team | W | L | T | Pct | PF | PA | Home | Away | Strk |
|---|---|---|---|---|---|---|---|---|---|
 Boise State | 8 | 1 | 0 | 0.889 | 351 | 227 | 4-0 | 4-1 | W8 |
 Fresno State | 5 | 4 | 0 | 0.556 | 241 | 185 | 3-1 | 2-3 | L1 |
 Colorado State | 3 | 6 | 0 | 0.333 | 322 | 403 | 3-3 | 0-3 | L2 |
 Texas State | 5 | 4 | 0 | 0.556 | 347 | 277 | 4-1 | 1-3 | W1 |
 Oregon State | 5 | 4 | 0 | 0.556 | 342 | 242 | 3-2 | 2-2 | L2 |
 Washington State | 1 | 8 | 0 | 0.111 | 171 | 247 | 1-3 | 0-5 | L6 |
 San Diego State | 4 | 5 | 0 | 0.444 | 238 | 309 | 4-1 | 0-4 | W1 |
| Utah State | 4 | 5 | 0 | 0.444 | 152 | 185 | 4-1 | 0-4 | W2 |
Troy
10th in Sun Belt
VS
Utah State
3rd in Pac-12
Quarterbacks & Specialists
#28
Evan Crenshaw
#9
Goose Crowder
#87
Colton Walls
Offensive Line
#51
Luke Petit
Receivers & Backs
#5
Mojo Dortch
Gavin Griffin
#8
TK Keyes
#18
Howard Kinchen
#1
Jordan Lovett
#3
Jaheim Merriweather
#17
Jace Petty
#4
Noreel White
Defensive Line & Linebackers
#11
Ty Clemons
Kam Curry
#93
RaKeem Davis
#25
Kavion Henderson
#44
Luke Hodge
#95
Miquon Merriweather
#3
Doug Nelson
#18
Jordan Perry
#2
Bryce Steele
#4
TJ Thompson
Defensive Backs
#9
Jamarion Keyes
#6
Justin Powe
#22
Donnie Smith
#1
Jabari Strait
#21
Tai Terrell
#12
Shemar Welch
Other
#33
Ethan Head
Quarterbacks & Specialists
#9
Grady Brosterhous
#3
Landon Rehkow
Receivers & Backs
#4
Nikko Boncore
#8
Javen Jacobs
Javon Robinson
#23
Noah White
#7
Eli Wood
Defensive Line & Linebackers
#11
Asher Cunningham
BJ Diakite
#32
Adonis Jackson
#18
James Jennette
#9
Tyree Morris
#10
Paxton Naegle
#14
Bronson Olevao Jr.
#17
Jordan Pendleton
#55
Tevita Tuha
#51
Ta'avili Tuitama
#28
Carson Tujague
Defensive Backs
#3
Charger Doty
#5
Markie Grant
#4
Brevin Hamblin
#8
David Kabongo
#21
Chapman Lewis
#15
D'Angelo Mayes
#22
John Shepard
#2
Kye Stokes
Other
#19
Kian Afrookhteh
Troy
3rd in Sun Belt - West
VS
Utah State
2nd in Pac-12
Passing
54.6
Completion Percentage
56.0
125
Completions
135
2.20
Interception Percentage
4.10
5
Interceptions
10
76
Longest Pass
78
1,414
Net Passing Yards
1,568
176.8
Net Passing Yards Per Game
196.0
229
Passing Attempts
241
4.40
Passing Touchdown %
4.60
10
Passing Touchdowns
11
116.7
Passer Rating
117.5
18
Total Sacks
23
120
Sack Yards Lost
112
6.2
Yards Per Pass Attempt
6.5
1,414
Passing Yards
1,568
0
Passing Fumbles Lost
0
8
Team Games Played
8
370.6
Yards Per Game
326.1
23.0
Total Points Per Game
16.9
184
Total Points
135
23
Total Touchdowns
16
176.8
Passing Yards Per Game
196.0
125-229
Comp-Att
135-241
18-120
Sacks-Yards Lost
23-112
Rushing
331
Rushing Attempts
265
1,551
Rushing Yards
1,041
4.7
Yards Per Rush Attempt
3.9
69
Long Rushing
64
0
20+ Yard Rushing Plays
0
12
Rushing Touchdowns
5
193.9
Rushing Yards Per Game
130.1
0
Rushing Fumbles
0
0
Rushing Fumbles Lost
0
82
Rushing 1st downs
50
8
Team Games Played
8
2,965
Total Yards
2,609
578
Total Offensive Plays
529
23.0
Total Points Per Game
16.9
184
Total Points
135
23
Total Touchdowns
16
Receiving
125
Receptions
135
0
Receiving Targets
0
1,414
Receiving Yards
1,568
1,414
Receiving Yards
1,568
10
Receiving Touchdowns
11
76
Long Reception
78
0
20+ Yard Receiving Plays
0
176.8
Receiving Yards Per Game
196.0
0
Receiving Fumbles
0
0
Receiving Fumbles Lost
0
741
Receiving Yards After Catch
641
57
Receiving First Downs
70
8
Team Games Played
8
11.3
Yards Per Reception
11.6
23.0
Total Points Per Game
16.9
184
Total Points
135
23
Total Touchdowns
16
Miscellaneous
155
Total 1st downs
142
82
Rushing 1st downs
50
57
Passing 1st downs
70
16
1st downs by penalty
22
38
Third Down Conversions
41
117
Third Down Attempts
106
32.48
3rd down %
38.68
10
Fourth Down Conversions
4
22
First Downs Attempts
12
45.45
4th down %
33.33
55
Total Penalties
62
546
Total Penalty Yards
531
15632
Possession Time Seconds
13688
0.00
Red Zone Field Goal Percentage
0.00
0.00
Red Zone Scoring Percentage
0.00
0.00
Red Zone Efficiency Percentage
0.00
0.00
Red Zone Touchdown Percentage
0.00
13
Total Takeaways
16
10
Total Giveaways
13
3
Turnover Ratio
3
0
Fumbles Lost
0
38-117
3rd down efficiency
41-106
10-22
4th down efficiency
4-12
55-546
Total-Yards
62-531
Defense
244
Solo Tackles
238
288
Assist Tackles
326
532
Total Tackles
564
15
Sacks
15
102
Sack Yards
101
53
Stuffs
64
27
Passes Defended
29
8.0
Average Interception Yards
30.0
37
Long Interception
33
0
Miscellaneous Touchdowns
0
0
Kicks Blocked
0
32
Tackles For Loss
33
8
Team Games Played
8
Defensive Interceptions
7
Interceptions
3
56
Interception Yards
90
1
Interception Touchdowns
0
7-56
INT: Total
3-90
General
9
Fumbles
5
8
Forced Fumbles
7
8
Fumbles Recovered
6
0
Fumbles Touchdowns
0
8
Games Played
8
9-0
Fumbles-Lost
5-0
Returning
14
Kick Returns
10
256
Kick Return Yards
202
18.3
Yards Per Kick Return
20.2
31
Long Kick Return
30
0
Kick Return Touchdowns
0
8
Punt Returns
15
35
Punt Return Yards
85
4.4
Yards Per Punt Return
5.7
26
Long Punt Return
19
0
Punt Return Touchdowns
0
0
Punt Return Fair Catches
0
0
Kick Return Fumbles Lost
0
0
Punt Return Fumbles Lost
0
8
Team Games Played
8
8-35
Punt: Total
15-85
Kicking
8
Field Goal Made
7
15
Field Goal Attempts
12
53.3
Field Goal Percentage
58.3
47
Long Field Goal Made
48
0
Field Goal Attempts 1-19
0
5
Field Goal Attempts 20-29
5
2
Field Goal Attempts 30-39
1
6
Field Goal Attempts 40-49
6
2
Field Goal Attempts 50+
0
22
Extra Points Made
14
23
Extra Point Attempts
14
95.7
Extra Point Percentage
100.0
0
Field Goals Made 1-19
0
4
Field Goals Made 20-29
4
2
Field Goals Made 30-39
0
2
Field Goals Made 40-49
3
0
Field Goals Made 50+
0
46
Total Kicking Points
35
8
Team Games Played
8
45
Touchback Percentage
52
0.0
Average Kickoff Return Yards
0.0
0
Kickoff Return Yards
0
0
Kickoff Returns
0
0-0
Kickoffs: Total
0-0
8-15
FG: Good-Attempts
7-12
Punting
41
Punts
38
1,819
Punt Yards
1,597
73
Long Punt
60
44.4
Gross Average Punt Yards
42.0
44.4
Net Average Punt Yards
42.0
0
Punts Blocked
0
15
Punts Inside 20
17
2
Touchbacks
2
14
Fair Catches
14
15
Punt Returns
10
0
Punt Return Yards
0
0.0
Average Punt Return Yards
0.0
8
Team Games Played
8
41-1,819
Punt: Total Yards
38-1,597
Scoring
12
Rushing Touchdowns
5
10
Receiving Touchdowns
11
0
Return Touchdowns
0
22
Total Touchdowns
16
8
Field Goals
7
22
Kick Extra Points
14
0
Total Two Point Conversions
2
184
Total Points
135
23.0
Total Points Per Game
16.9