

Tulsa vs Arkansas Live Score (27 Sep, 2026)
Score by Quarter
| Team | Q1 | Q2 | Q3 | Q4 | Final |
|---|---|---|---|---|---|
 Tulsa |
0 | 0 | 6 | 0 | 6 |
 Arkansas |
10 | 6 | 7 | 11 | 34 |
Scoring Plays
Q1
8:48
8:48
Max Gilbert 23 Yd Field Goal
Field Goal Good
0 – 3
Q1
4:22
4:22
KJ Jackson 10 Yd Run (Max Gilbert Kick)
Rushing Touchdown
0 – 10
Q2
5:54
5:54
Max Gilbert 35 Yd Field Goal
Field Goal Good
0 – 13
Q2
0:01
0:01
Max Gilbert 29 Yd Field Goal
Field Goal Good
0 – 16
Q3
9:38
9:38
Damari Alston 1 Yd Run (Two-Point Pass Conversion Failed)
Rushing Touchdown
6 – 16
Q3
8:06
8:06
Chris Marshall 20 Yd pass from KJ Jackson (Max Gilbert Kick)
Passing Touchdown
6 – 23
Q4
12:59
12:59
Max Gilbert 38 Yd Field Goal
Field Goal Good
6 – 26
Q4
5:44
5:44
KJ Jackson 11 Yd Run (KJ Jackson Pass to Sutton Smith for Two-Point Conversion)
Rushing Touchdown
6 – 34
Game Leaders
TulsaArkansas
 D. Williams II QB
Passing Yards
 K. Jackson QB
 D. Alston RB
Rushing Yards
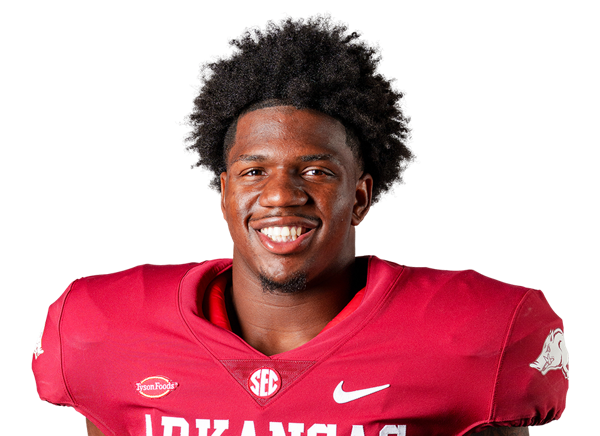 C. Settles RB
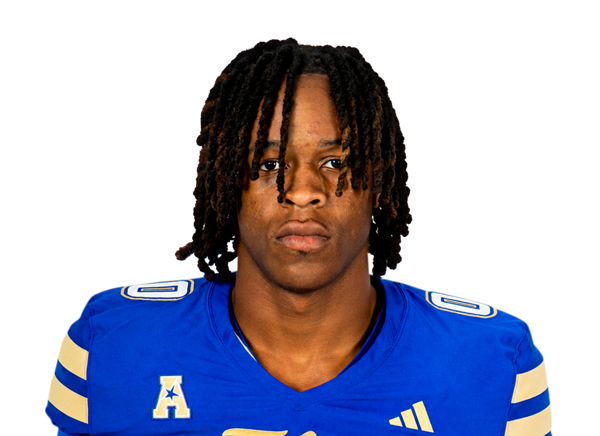 D. Gee Jr. WR
Receiving Yards
 C. Marshall WR
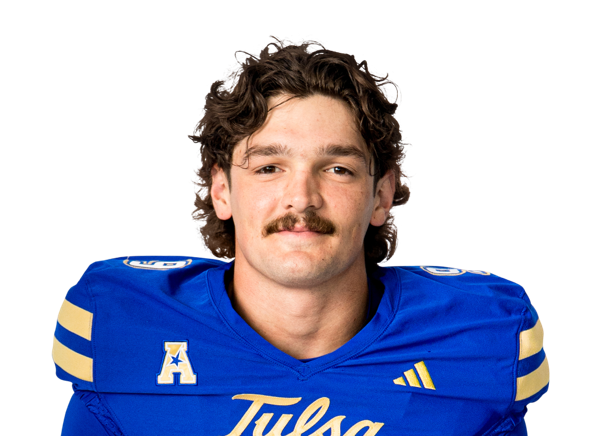 D. Collins LB
Sacks
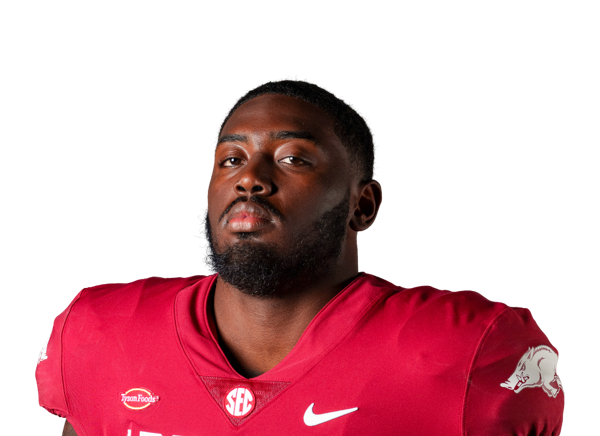 Q. Rhodes Jr. DLD. Collins LB
Tackles
 C. Harrison DB
Player Box Score
Tulsa| Player | C/ATT | YDS | AVG | TD | INT |
|---|---|---|---|---|---|
| Dexter Williams II#5 | 20/32 | 176 | 5.5 | 0 | 0 |
Arkansas| Player | C/ATT | YDS | AVG | TD | INT |
|---|---|---|---|---|---|
| KJ Jackson#7 | 24/36 | 309 | 8.6 | 1 | 1 |
Tulsa| Player | CAR | YDS | AVG | TD | LONG |
|---|---|---|---|---|---|
| Damari Alston#6 | 9 | 27 | 3.0 | 1 | 6 |
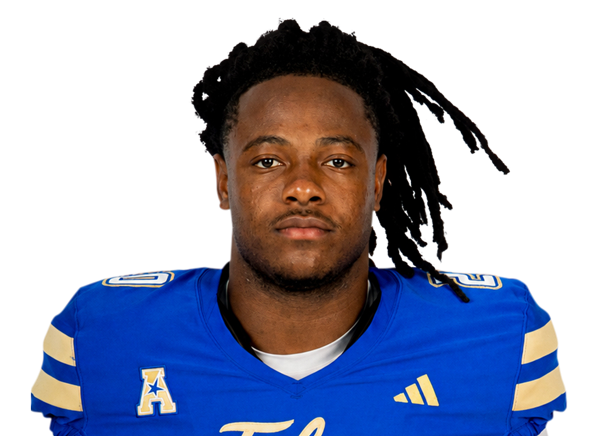 Trequan Jones#3 | 6 | 22 | 3.7 | 0 | 6 |
| Dexter Williams II#5 | 6 | 8 | 1.3 | 0 | 15 |
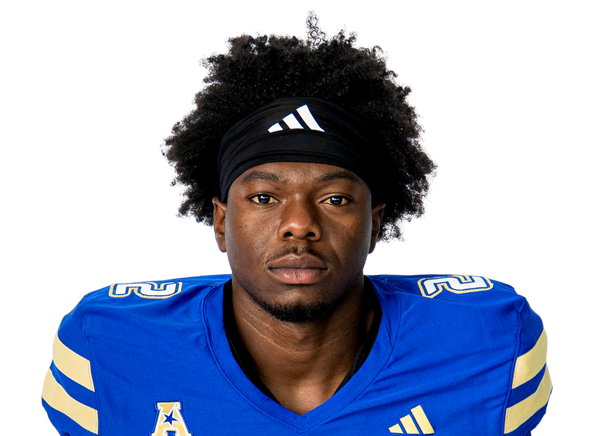 Oran Singleton Jr.#2 | 1 | 7 | 7.0 | 0 | 7 |
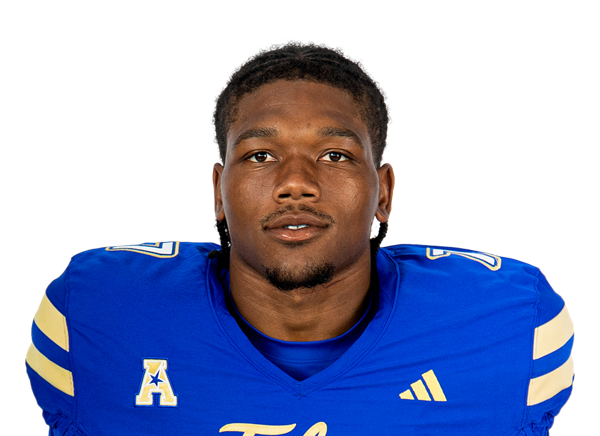 Jimmy Calloway#7 | 1 | 1 | 1.0 | 0 | 1 |
Arkansas| Player | CAR | YDS | AVG | TD | LONG |
|---|---|---|---|---|---|
| Cam Settles#27 | 11 | 40 | 3.6 | 0 | 7 |
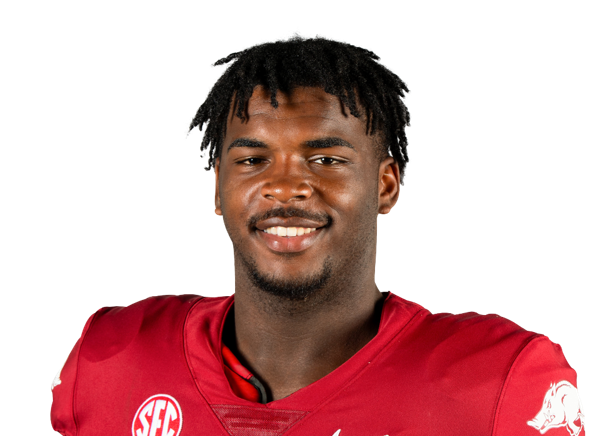 Braylen Russell | 9 | 30 | 3.3 | 0 | 10 |
| KJ Jackson#7 | 13 | 29 | 2.2 | 2 | 20 |
 Sutton Smith#5 | 5 | 19 | 3.8 | 0 | 9 |
 Jasper Parker#21 | 3 | 18 | 6.0 | 0 | 12 |
 Team | 1 | -2 | -2.0 | 0 | 0 |
 Ismael Cisse#4 | 1 | -2 | -2.0 | 0 | 0 |
Tulsa| Player | REC | YDS | AVG | TD | LONG |
|---|---|---|---|---|---|
| Donnell Gee Jr. | 4 | 49 | 12.3 | 0 | 18 |
| Oran Singleton Jr.#2 | 6 | 39 | 6.5 | 0 | 11 |
 David Wells Jr.#1 | 2 | 24 | 12.0 | 0 | 15 |
 Chris Gacayan II#82 | 1 | 23 | 23.0 | 0 | 23 |
 Javon Ross#9 | 2 | 18 | 9.0 | 0 | 14 |
| Damari Alston#6 | 3 | 16 | 5.3 | 0 | 9 |
 Grant McAtee#11 | 1 | 5 | 5.0 | 0 | 5 |
 DJ McKinney#4 | 1 | 2 | 2.0 | 0 | 2 |
Arkansas| Player | REC | YDS | AVG | TD | LONG |
|---|---|---|---|---|---|
| Chris Marshall#6 | 9 | 195 | 21.7 | 1 | 50 |
 Jaden Platt#83 | 3 | 36 | 12.0 | 0 | 13 |
| Ismael Cisse#4 | 4 | 35 | 8.8 | 0 | 18 |
| Cam Settles#27 | 6 | 20 | 3.3 | 0 | 11 |
| Braylen Russell | 1 | 18 | 18.0 | 0 | 18 |
 Jamari Hawkins#9 | 1 | 5 | 5.0 | 0 | 5 |
Tulsa| Player | TOT | SOLO | SACKS | TFL | PD | QB HUR | TD |
|---|---|---|---|---|---|---|---|
| Dax Collins#9 | 11 | 6 | 1.5 | 1.5 | 1 | 0 | 0 |
 Thomas Davis#15 | 10 | 3 | 0 | 0 | 0 | 0 | 0 |
 Chris Thompson Jr.#6 | 9 | 3 | 0 | 0 | 0 | 0 | 0 |
 Zach Williams#1 | 8 | 3 | 0 | 0 | 0 | 0 | 0 |
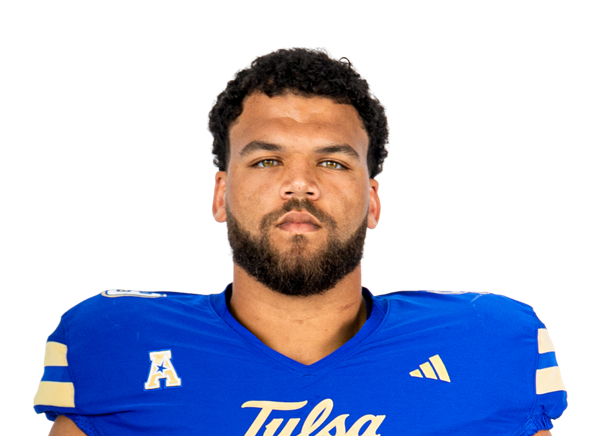 Tai Newhouse#99 | 6 | 0 | 0 | 0 | 0 | 1 | 0 |
 Tyson Williams#4 | 5 | 3 | 0 | 0 | 2 | 0 | 0 |
 Devin Robinson#2 | 5 | 1 | 0 | 1 | 0 | 0 | 0 |
 Caldra Williford#16 | 4 | 3 | 0 | 1.5 | 0 | 0 | 0 |
 Sam Stone#25 | 4 | 2 | 0 | 0 | 0 | 0 | 0 |
 Arias Nash#10 | 4 | 1 | 0 | 0 | 0 | 0 | 0 |
 Ashton Williams#5 | 4 | 1 | 0 | 0.5 | 0 | 0 | 0 |
 Zane Woodham#27 | 3 | 2 | 0 | 0 | 0 | 0 | 0 |
 Kyran Duhon | 3 | 1 | 1 | 1 | 0 | 1 | 0 |
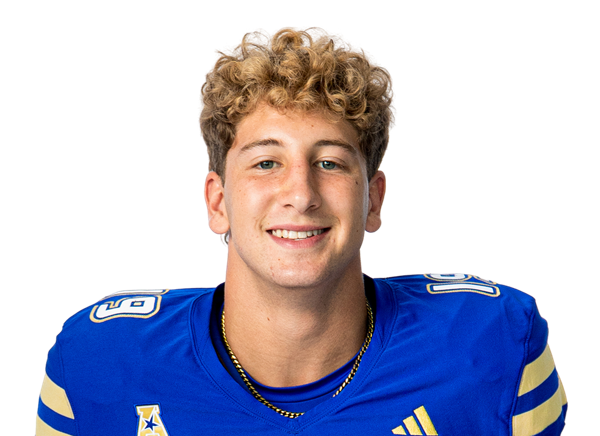 Rylan Leathers#19 | 3 | 1 | 0 | 0 | 0 | 0 | 0 |
 Hudson Ball#32 | 2 | 1 | 0 | 1 | 0 | 0 | 0 |
 Jaylen George#11 | 2 | 0 | 0 | 0 | 0 | 1 | 0 |
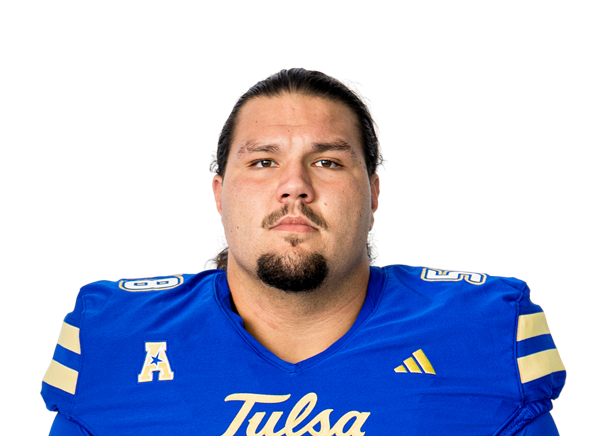 Tyler Rich#58 | 2 | 0 | 0 | 0 | 0 | 0 | 0 |
 Dailen Howard#88 | 2 | 0 | 0 | 0 | 0 | 1 | 0 |
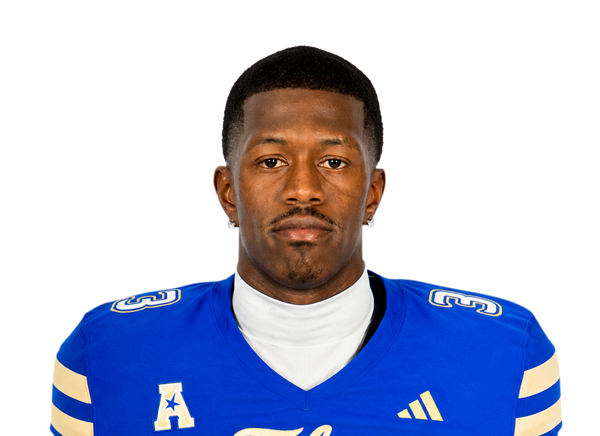 JD Drew#3 | 1 | 1 | 0 | 0 | 0 | 0 | 0 |
 Willie Goodwyn#23 | 1 | 1 | 0 | 0 | 0 | 0 | 0 |
| Trequan Jones#3 | 1 | 1 | 0 | 0 | 0 | 0 | 0 |
 NuNu Campbell#13 | 1 | 0 | 0 | 0 | 0 | 0 | 0 |
 Aquavious Dunbar#21 | 1 | 0 | 0 | 0 | 0 | 0 | 0 |
 Will Upshaw#41 | 1 | 0 | 0.5 | 0.5 | 0 | 0 | 0 |
 Jackson Shockley#87 | 1 | 0 | 0 | 0 | 0 | 0 | 0 |
Arkansas| Player | TOT | SOLO | SACKS | TFL | PD | QB HUR | TD |
|---|---|---|---|---|---|---|---|
 Ja'Quavion Smith#25 | 8 | 4 | 0 | 0 | 0 | 0 | 0 |
| Christian Harrison#1 | 8 | 3 | 0 | 0 | 1 | 0 | 0 |
 Joker Johnson#20 | 6 | 3 | 0 | 0 | 1 | 0 | 0 |
 Khmori House#6 | 5 | 1 | 0 | 0 | 1 | 0 | 0 |
 Ben Bogle#44 | 4 | 1 | 1 | 1 | 1 | 0 | 0 |
 Miguel Mitchell#24 | 3 | 3 | 0 | 0 | 1 | 0 | 0 |
 Tay Lockett#22 | 3 | 2 | 0 | 0 | 0 | 0 | 0 |
 La'khi Roland#4 | 3 | 1 | 0 | 0 | 0 | 0 | 0 |
 Antonio Sandel-Bascomb#55 | 3 | 1 | 0 | 0 | 0 | 0 | 0 |
 Carter Stoutmire#13 | 3 | 0 | 0 | 0 | 0 | 0 | 0 |
 Shelton Lewis#2 | 2 | 2 | 0 | 0 | 0 | 0 | 0 |
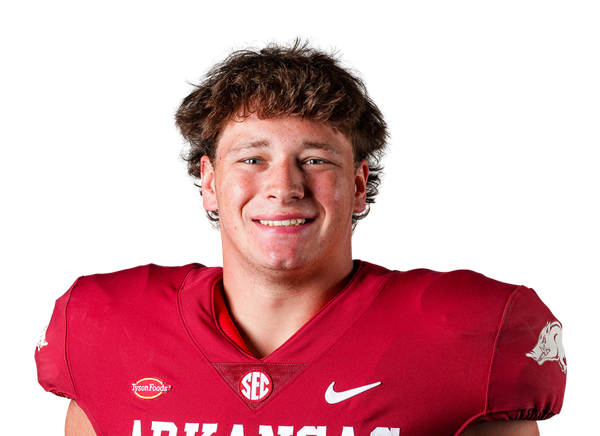 Donovan Whitten#52 | 2 | 1 | 0 | 0 | 0 | 0 | 0 |
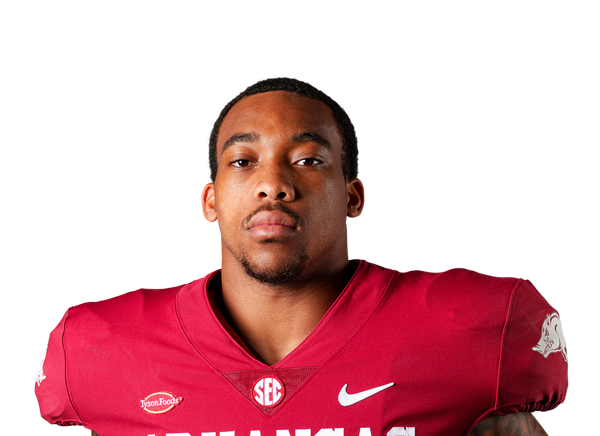 Phoenix Jackson#8 | 2 | 0 | 0 | 0 | 0 | 0 | 0 |
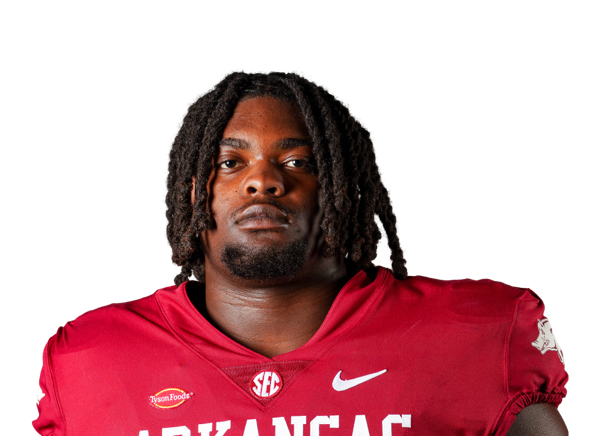 Xadavien Sims#88 | 2 | 0 | 0 | 0 | 0 | 0 | 0 |
| Quincy Rhodes Jr.#97 | 1 | 1 | 1 | 1 | 0 | 1 | 0 |
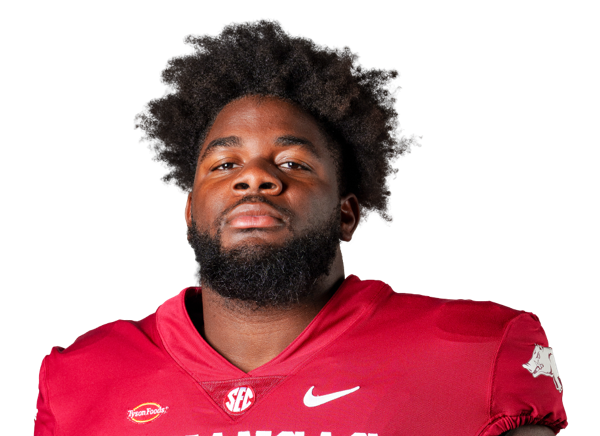 David Oke#92 | 1 | 0 | 0 | 0 | 0 | 0 | 0 |
 Hunter Osborne | 1 | 0 | 0 | 0 | 0 | 1 | 0 |
 Brian Alston#41 | 1 | 0 | 0 | 0 | 0 | 1 | 0 |
 Jeremy Evans#42 | 1 | 0 | 0 | 0 | 0 | 0 | 0 |
 Caleb Bell#90 | 1 | 0 | 0 | 0 | 0 | 0 | 0 |
| Jasper Parker#21 | 1 | 0 | 0 | 0 | 0 | 0 | 0 |
 Danny Beale III#99 | 0 | 0 | 0 | 0 | 1 | 0 | 0 |
 Trajen Odom#28 | 0 | 0 | 0 | 0 | 0 | 1 | 0 |
Tulsa| Player | FUM | LOST | REC |
|---|---|---|---|
| Dexter Williams II#5 | 1 | 1 | 0 |
| Chris Gacayan II#82 | 1 | 1 | 0 |
Arkansas| Player | FUM | LOST | REC |
|---|---|---|---|
| Shelton Lewis#2 | 0 | 0 | 1 |
| Ben Bogle#44 | 0 | 0 | 1 |
Arkansas| Player | FG | PCT | LONG | XP | PTS |
|---|---|---|---|---|---|
 Max Gilbert#30 | 4/4 | 100.0 | 38 | 2/2 | 14 |
Tulsa| Player | NO | YDS | AVG | TB | In 20 | LONG |
|---|---|---|---|---|---|---|
 Max Tulen#29 | 7 | 311 | 44.4 | 0 | 1 | 51 |
Arkansas| Player | NO | YDS | AVG | TB | In 20 | LONG |
|---|---|---|---|---|---|---|
 Gavin Rush#37 | 3 | 126 | 42.0 | 0 | 3 | 43 |
Tulsa| Player | NO | YDS | AVG | LONG | TD |
|---|---|---|---|---|---|
| Trequan Jones#3 | 2 | 29 | 14.5 | 16 | 0 |
Arkansas| Player | NO | YDS | AVG | LONG | TD |
|---|---|---|---|---|---|
| Sutton Smith#5 | 2 | 5 | 2.5 | 7 | 0 |
Tulsa| Player | INT | YDS | TD |
|---|---|---|---|
 Dedaunte Scott#12 | 1 | 0 | 0 |
Drive Summary
ARK
Field Goal
70
TLSA
Punt
-9
ARK
Touchdown
60
TLSA
Punt
31
ARK
Punt
32
TLSA
Punt
3
ARK
Field Goal
47
TLSA
Punt
-4
ARK
Punt
8
TLSA
Punt
10
ARK
Field Goal
56
TLSA
Punt
3
ARK
Punt
5
TLSA
Touchdown
81
ARK
Touchdown
51
TLSA
Punt
4
ARK
Interception
2
TLSA
Fumble
34
ARK
Field Goal
38
TLSA
Fumble
41
ARK
Touchdown
66
TLSA
Downs
47
ARK
End Of Quarter
16
Injury Report
No current injury report is available for this matchup.
Head-to-Head
Historical meetings are not available for this matchup.
Game Information
StageWeek 4
Season2026
KickoffSat, Sep 26, 8:00 pm
VenueDonald W. Reynolds Razorback Stadium
LocationFayetteville, AR
SurfaceArtificial Turf
BroadcastSECN+
Division Standings
FBS — American Conference
| Team | W | L | T | Pct | PF | PA | Home | Away | Strk |
|---|---|---|---|---|---|---|---|---|---|
 South Florida | 6 | 4 | 0 | 0.600 | 274 | 188 | 4-2 | 2-2 | L2 |
 Florida Atlantic | 6 | 4 | 0 | 0.600 | 383 | 353 | 5-0 | 1-4 | L1 |
 UAB | 6 | 4 | 0 | 0.600 | 232 | 224 | 5-0 | 1-4 | W2 |
 Army | 5 | 4 | 0 | 0.556 | 290 | 228 | 3-2 | 2-2 | L2 |
 Memphis | 8 | 2 | 0 | 0.800 | 390 | 253 | 5-0 | 3-2 | W3 |
| Tulsa | 6 | 4 | 0 | 0.600 | 336 | 226 | 3-2 | 3-2 | W2 |
 UTSA | 7 | 2 | 0 | 0.778 | 297 | 268 | 4-0 | 3-2 | L1 |
 East Carolina | 6 | 4 | 0 | 0.600 | 229 | 226 | 4-1 | 2-3 | W3 |
 North Texas | 7 | 2 | 0 | 0.778 | 402 | 278 | 5-0 | 2-2 | W6 |
 Tulane | 5 | 5 | 0 | 0.500 | 210 | 280 | 3-2 | 2-3 | W1 |
 Rice | 2 | 9 | 0 | 0.182 | 239 | 353 | 1-4 | 1-5 | W1 |
 Charlotte | 1 | 9 | 0 | 0.100 | 193 | 362 | 0-5 | 1-4 | L3 |
 Temple | 2 | 9 | 0 | 0.182 | 261 | 322 | 1-6 | 1-3 | L6 |
 Navy | 3 | 6 | 0 | 0.333 | 263 | 274 | 3-2 | 0-4 | W1 |
FBS — Southeastern Conference
| Team | W | L | T | Pct | PF | PA | Home | Away | Strk |
|---|---|---|---|---|---|---|---|---|---|
 Alabama | 8 | 2 | 0 | 0.800 | 358 | 189 | 4-1 | 4-1 | W3 |
 Florida | 6 | 4 | 0 | 0.600 | 313 | 262 | 3-2 | 3-2 | W1 |
 Georgia | 9 | 1 | 0 | 0.900 | 418 | 147 | 6-1 | 3-0 | W3 |
 Mississippi State | 4 | 6 | 0 | 0.400 | 245 | 291 | 2-4 | 2-2 | L6 |
 Texas | 8 | 2 | 0 | 0.800 | 302 | 178 | 5-1 | 3-1 | W4 |
 Ole Miss | 6 | 3 | 0 | 0.667 | 304 | 234 | 5-1 | 1-2 | L1 |
 Auburn | 6 | 4 | 0 | 0.600 | 260 | 246 | 4-2 | 2-2 | W2 |
 Kentucky | 7 | 3 | 0 | 0.700 | 283 | 253 | 4-2 | 3-1 | L2 |
 LSU | 6 | 4 | 0 | 0.600 | 355 | 181 | 5-2 | 1-2 | L2 |
 Missouri | 6 | 4 | 0 | 0.600 | 293 | 229 | 4-1 | 2-3 | L2 |
 Tennessee | 8 | 2 | 0 | 0.800 | 314 | 143 | 5-1 | 3-1 | W2 |
 Vanderbilt | 4 | 6 | 0 | 0.400 | 213 | 286 | 3-3 | 1-3 | L1 |
| Arkansas | 4 | 6 | 0 | 0.400 | 214 | 253 | 3-3 | 1-3 | W1 |
 Oklahoma | 5 | 4 | 0 | 0.556 | 199 | 173 | 3-2 | 2-2 | W1 |
 South Carolina | 6 | 4 | 0 | 0.600 | 318 | 245 | 4-2 | 2-2 | L1 |
 Texas A&M | 4 | 6 | 0 | 0.400 | 242 | 190 | 4-2 | 0-4 | L3 |
Tulsa
VS
Arkansas
13th in SEC
Quarterbacks & Specialists
#29
Max Tulen
#5
Dexter Williams II
Receivers & Backs
#6
Damari Alston
#7
Jimmy Calloway
#82
Chris Gacayan II
Donnell Gee Jr.
#3
Trequan Jones
#11
Grant McAtee
#4
DJ McKinney
#9
Javon Ross
#87
Jackson Shockley
#2
Oran Singleton Jr.
#1
David Wells Jr.
Defensive Line & Linebackers
#32
Hudson Ball
#9
Dax Collins
#15
Thomas Davis
Kyran Duhon
#21
Aquavious Dunbar
#11
Jaylen George
#88
Dailen Howard
#10
Arias Nash
#99
Tai Newhouse
#58
Tyler Rich
#25
Sam Stone
#6
Chris Thompson Jr.
#41
Will Upshaw
Defensive Backs
#13
NuNu Campbell
#3
JD Drew
#23
Willie Goodwyn
#19
Rylan Leathers
#2
Devin Robinson
#12
Dedaunte Scott
#5
Ashton Williams
#4
Tyson Williams
#1
Zach Williams
#16
Caldra Williford
#27
Zane Woodham
Quarterbacks & Specialists
#7
KJ Jackson
#37
Gavin Rush
Receivers & Backs
#4
Ismael Cisse
#9
Jamari Hawkins
#6
Chris Marshall
#21
Jasper Parker
#83
Jaden Platt
Braylen Russell
#27
Cam Settles
#5
Sutton Smith
Defensive Line & Linebackers
#41
Brian Alston
#99
Danny Beale III
#90
Caleb Bell
#44
Ben Bogle
#42
Jeremy Evans
#8
Phoenix Jackson
#28
Trajen Odom
#92
David Oke
Hunter Osborne
#97
Quincy Rhodes Jr.
#55
Antonio Sandel-Bascomb
#88
Xadavien Sims
#25
Ja'Quavion Smith
#52
Donovan Whitten
Defensive Backs
#1
Christian Harrison
#6
Khmori House
#20
Joker Johnson
#2
Shelton Lewis
#22
Tay Lockett
#24
Miguel Mitchell
#4
La'khi Roland
#13
Carter Stoutmire
Other
#30
Max Gilbert
Tulsa
7th in American
VS
Arkansas
13th in SEC
Passing
62.8
Completion Percentage
59.3
204
Completions
197
1.20
Interception Percentage
1.80
4
Interceptions
6
56
Longest Pass
50
2,340
Net Passing Yards
2,217
234.0
Net Passing Yards Per Game
221.7
325
Passing Attempts
332
6.20
Passing Touchdown %
3.30
20
Passing Touchdowns
11
141.2
Passer Rating
122.9
15
Total Sacks
24
93
Sack Yards Lost
169
7.2
Yards Per Pass Attempt
6.7
2,340
Passing Yards
2,217
0
Passing Fumbles Lost
0
10
Team Games Played
10
402.1
Yards Per Game
339.6
33.6
Total Points Per Game
21.4
336
Total Points
214
45
Total Touchdowns
24
234.0
Passing Yards Per Game
221.7
204-325
Comp-Att
197-332
15-93
Sacks-Yards Lost
24-169
Rushing
339
Rushing Attempts
363
1,681
Rushing Yards
1,179
5.0
Yards Per Rush Attempt
3.2
81
Long Rushing
65
0
20+ Yard Rushing Plays
0
24
Rushing Touchdowns
11
168.1
Rushing Yards Per Game
117.9
0
Rushing Fumbles
0
0
Rushing Fumbles Lost
0
75
Rushing 1st downs
79
10
Team Games Played
10
4,021
Total Yards
3,396
679
Total Offensive Plays
719
33.6
Total Points Per Game
21.4
336
Total Points
214
45
Total Touchdowns
24
Receiving
204
Receptions
197
0
Receiving Targets
0
2,340
Receiving Yards
2,217
2,340
Receiving Yards
2,217
20
Receiving Touchdowns
11
56
Long Reception
50
0
20+ Yard Receiving Plays
0
234.0
Receiving Yards Per Game
221.7
0
Receiving Fumbles
0
0
Receiving Fumbles Lost
0
1129
Receiving Yards After Catch
1045
103
Receiving First Downs
106
10
Team Games Played
10
11.5
Yards Per Reception
11.3
33.6
Total Points Per Game
21.4
336
Total Points
214
45
Total Touchdowns
24
Miscellaneous
197
Total 1st downs
204
75
Rushing 1st downs
79
103
Passing 1st downs
106
19
1st downs by penalty
19
44
Third Down Conversions
63
133
Third Down Attempts
150
33.08
3rd down %
42.00
21
Fourth Down Conversions
10
28
First Downs Attempts
18
75.00
4th down %
55.56
49
Total Penalties
61
431
Total Penalty Yards
544
16481
Possession Time Seconds
18975
0.00
Red Zone Field Goal Percentage
0.00
0.00
Red Zone Scoring Percentage
0.00
0.00
Red Zone Efficiency Percentage
0.00
0.00
Red Zone Touchdown Percentage
0.00
13
Total Takeaways
13
8
Total Giveaways
14
5
Turnover Ratio
-1
0
Fumbles Lost
0
44-133
3rd down efficiency
63-150
21-28
4th down efficiency
10-18
49-431
Total-Yards
61-544
Defense
360
Solo Tackles
289
486
Assist Tackles
336
846
Total Tackles
625
27
Sacks
13
194
Sack Yards
109
93
Stuffs
56
32
Passes Defended
28
8.3
Average Interception Yards
15.4
23
Long Interception
63
0
Miscellaneous Touchdowns
0
0
Kicks Blocked
0
45
Tackles For Loss
32
10
Team Games Played
10
Defensive Interceptions
10
Interceptions
8
83
Interception Yards
123
0
Interception Touchdowns
2
10-83
INT: Total
8-123
General
9
Fumbles
11
8
Forced Fumbles
7
9
Fumbles Recovered
7
0
Fumbles Touchdowns
0
10
Games Played
10
9-0
Fumbles-Lost
11-0
Returning
21
Kick Returns
3
441
Kick Return Yards
75
21.0
Yards Per Kick Return
25.0
98
Long Kick Return
25
1
Kick Return Touchdowns
0
9
Punt Returns
8
50
Punt Return Yards
34
5.6
Yards Per Punt Return
4.3
14
Long Punt Return
20
0
Punt Return Touchdowns
0
0
Punt Return Fair Catches
0
0
Kick Return Fumbles Lost
0
0
Punt Return Fumbles Lost
0
10
Team Games Played
10
9-50
Punt: Total
8-34
Kicking
8
Field Goal Made
15
12
Field Goal Attempts
23
66.7
Field Goal Percentage
65.2
45
Long Field Goal Made
55
0
Field Goal Attempts 1-19
0
2
Field Goal Attempts 20-29
3
3
Field Goal Attempts 30-39
10
7
Field Goal Attempts 40-49
3
0
Field Goal Attempts 50+
7
38
Extra Points Made
23
40
Extra Point Attempts
23
95.0
Extra Point Percentage
100.0
0
Field Goals Made 1-19
0
2
Field Goals Made 20-29
3
2
Field Goals Made 30-39
9
4
Field Goals Made 40-49
2
0
Field Goals Made 50+
1
62
Total Kicking Points
68
10
Team Games Played
10
38
Touchback Percentage
81
0.0
Average Kickoff Return Yards
0.0
0
Kickoff Return Yards
0
0
Kickoff Returns
0
0-0
Kickoffs: Total
0-0
8-12
FG: Good-Attempts
15-23
Punting
45
Punts
41
1,830
Punt Yards
1,639
61
Long Punt
54
40.7
Gross Average Punt Yards
40.0
40.7
Net Average Punt Yards
40.0
0
Punts Blocked
0
14
Punts Inside 20
12
2
Touchbacks
1
15
Fair Catches
21
14
Punt Returns
5
0
Punt Return Yards
0
0.0
Average Punt Return Yards
0.0
10
Team Games Played
10
45-1,830
Punt: Total Yards
41-1,639
Scoring
24
Rushing Touchdowns
11
20
Receiving Touchdowns
11
1
Return Touchdowns
0
45
Total Touchdowns
22
8
Field Goals
15
38
Kick Extra Points
23
2
Total Two Point Conversions
1
336
Total Points
214
33.6
Total Points Per Game
21.4