

| Team | Q1 | Q2 | Q3 | Q4 | Final |
|---|---|---|---|---|---|
 Tulsa |
0 | 21 | 3 | 14 | 38 |
 Rice |
7 | 10 | 0 | 0 | 17 |
Scoring Plays
12:10
14:56
11:58
10:59
2:48
0:33
8:21
10:06
3:39
Game Leaders
Tulsa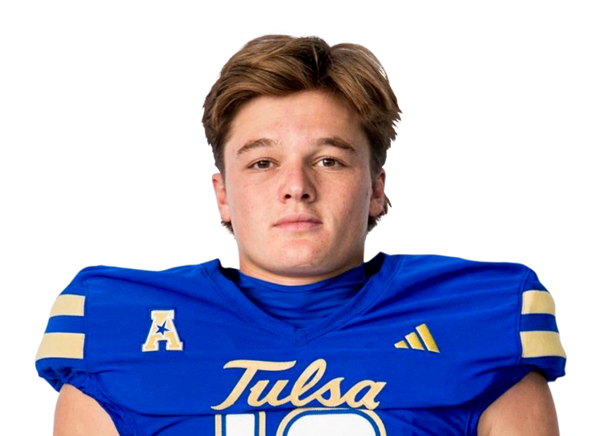 B. Hayes QB
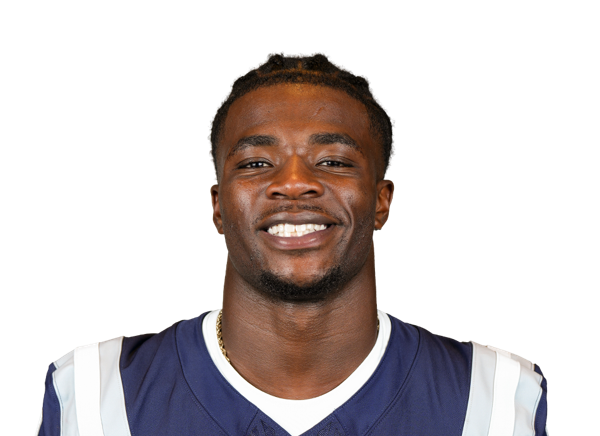 J. Brown QB
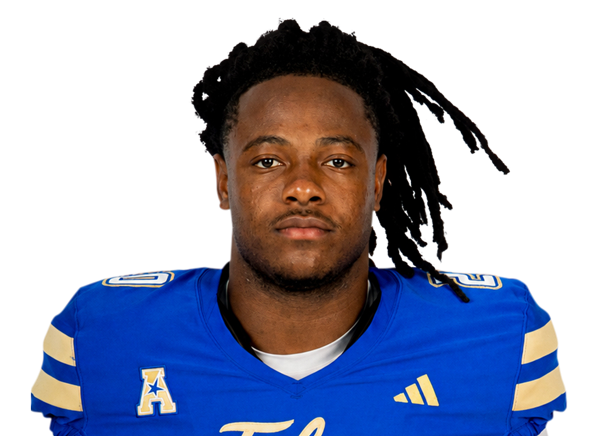 T. Jones RBJ. Brown QB
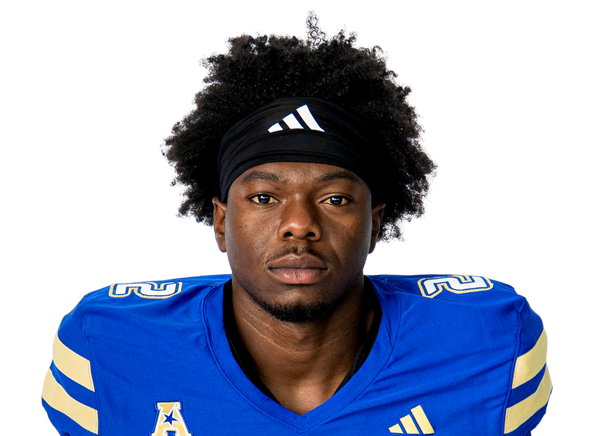 O. Singleton Jr. WR
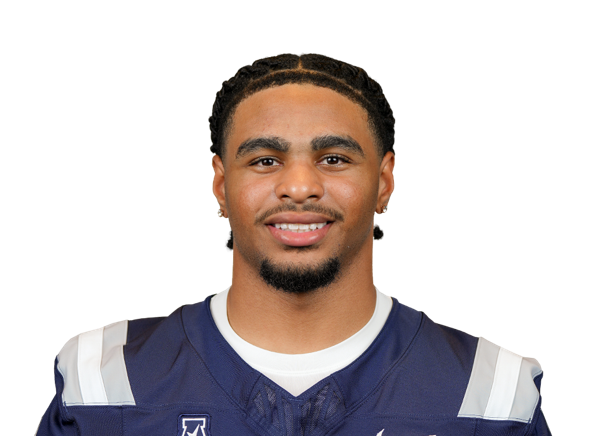 J. Clark WR
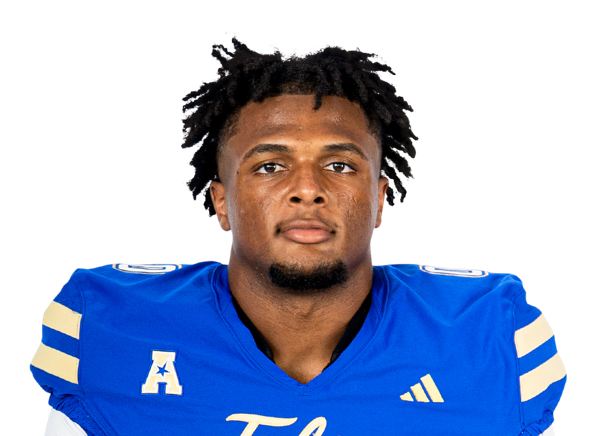 K. Duhon DL
 A. Harnetiaux LB
 T. Williams CB
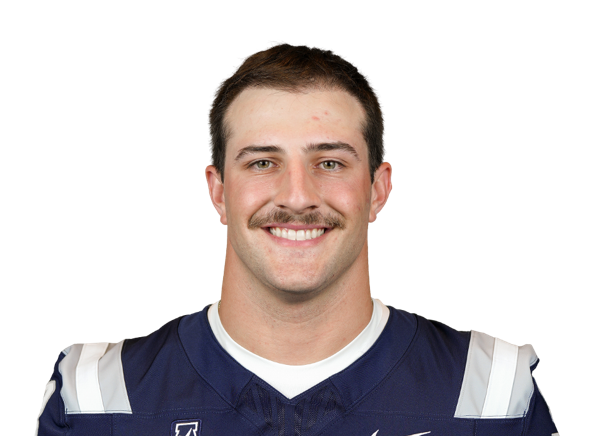 S. Combs LB
Player Box Score
Tulsa| Player | C/ATT | YDS | AVG | TD | INT |
|---|---|---|---|---|---|
| Baylor Hayes#10 | 20/27 | 249 | 9.2 | 3 | 0 |
Rice| Player | C/ATT | YDS | AVG | TD | INT |
|---|---|---|---|---|---|
| Jacurri Brown#11 | 2/6 | 47 | 7.8 | 0 | 0 |
 Gael Ochoa#4 | 2/2 | 15 | 7.5 | 0 | 0 |
Tulsa| Player | CAR | YDS | AVG | TD | LONG |
|---|---|---|---|---|---|
| Trequan Jones#3 | 12 | 77 | 6.4 | 1 | 45 |
 Damari Alston#6 | 12 | 52 | 4.3 | 1 | 13 |
 Jimmy Calloway#7 | 2 | 20 | 10.0 | 0 | 11 |
| Baylor Hayes#10 | 5 | 3 | 0.6 | 0 | 10 |
 Team | 3 | 2 | 0.7 | 0 | 0 |
 Dexter Williams II#5 | 2 | -2 | -1.0 | 0 | 0 |
Rice| Player | CAR | YDS | AVG | TD | LONG |
|---|---|---|---|---|---|
| Jacurri Brown#11 | 11 | 154 | 14.0 | 2 | 78 |
 Tyvonn Byars#26 | 15 | 53 | 3.5 | 0 | 9 |
 D'Andre Hardeman Jr.#28 | 12 | 38 | 3.2 | 0 | 7 |
| Jordan Clark#19 | 4 | 29 | 7.3 | 0 | 16 |
 Davis Lane#5 | 2 | 14 | 7.0 | 0 | 9 |
 Max Mosey#13 | 3 | 10 | 3.3 | 0 | 7 |
| Gael Ochoa#4 | 7 | -9 | -1.3 | 0 | 4 |
Tulsa| Player | REC | YDS | AVG | TD | LONG |
|---|---|---|---|---|---|
| Oran Singleton Jr.#2 | 7 | 87 | 12.4 | 1 | 33 |
 David Wells Jr.#1 | 2 | 52 | 26.0 | 0 | 35 |
 Javon Ross#9 | 3 | 31 | 10.3 | 1 | 12 |
| Damari Alston#6 | 1 | 26 | 26.0 | 0 | 26 |
 Jewlyen Roberts#84 | 1 | 17 | 17.0 | 0 | 17 |
 Sevion Morrison#28 | 2 | 12 | 6.0 | 1 | 6 |
| Trequan Jones#3 | 1 | 8 | 8.0 | 0 | 8 |
 Chris Gacayan II#82 | 1 | 8 | 8.0 | 0 | 8 |
| Jimmy Calloway#7 | 1 | 4 | 4.0 | 0 | 4 |
 Xavier Green#88 | 1 | 4 | 4.0 | 0 | 4 |
Rice| Player | REC | YDS | AVG | TD | LONG |
|---|---|---|---|---|---|
| Jordan Clark#19 | 3 | 52 | 17.3 | 0 | 38 |
 Payton Matthews | 1 | 10 | 10.0 | 0 | 10 |
Tulsa| Player | TOT | SOLO | SACKS | TFL | PD | QB HUR | TD |
|---|---|---|---|---|---|---|---|
| Tyson Williams#4 | 12 | 7 | 0 | 0.5 | 0 | 0 | 0 |
 Chris Thompson Jr.#6 | 10 | 3 | 0 | 0 | 0 | 0 | 0 |
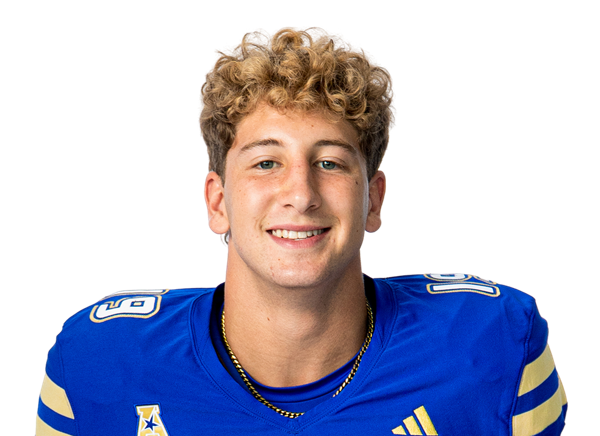 Rylan Leathers#19 | 8 | 4 | 0 | 0 | 0 | 0 | 0 |
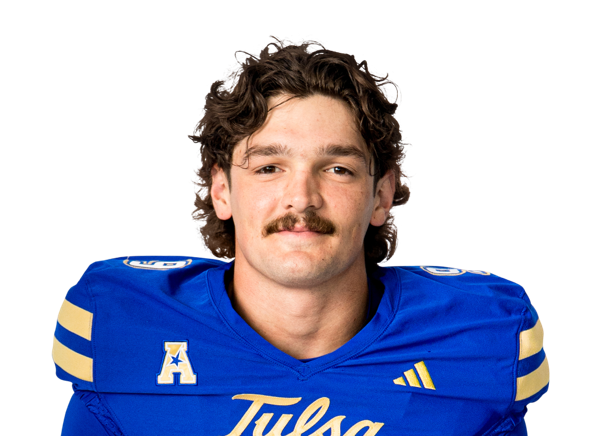 Dax Collins#9 | 8 | 2 | 0 | 0.5 | 0 | 0 | 0 |
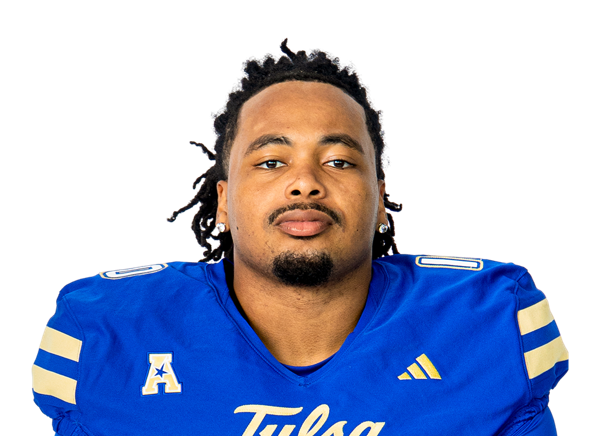 Arias Nash#10 | 6 | 2 | 0 | 0 | 0 | 0 | 0 |
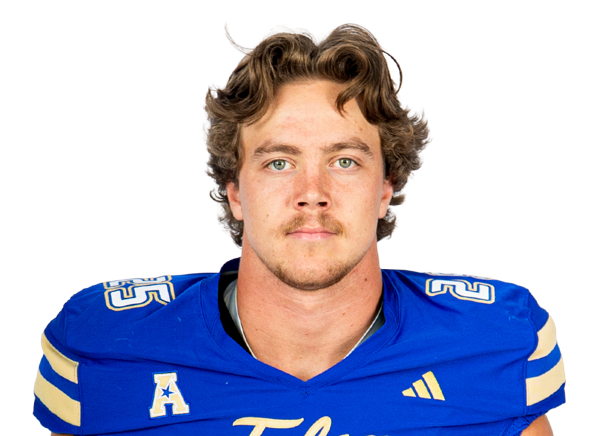 Sam Stone#25 | 5 | 2 | 0 | 0 | 0 | 0 | 0 |
 Devin Robinson#2 | 4 | 3 | 1 | 1 | 0 | 0 | 0 |
 Jaylen George#11 | 4 | 3 | 0 | 0 | 0 | 0 | 0 |
 Zach Williams#1 | 4 | 1 | 0 | 0 | 0 | 0 | 0 |
 Dailen Howard#88 | 3 | 1 | 0 | 0 | 0 | 0 | 0 |
 Thomas Davis#15 | 3 | 0 | 0 | 0 | 0 | 0 | 0 |
| Kyran Duhon | 2 | 2 | 2 | 2 | 0 | 0 | 0 |
 Caldra Williford#16 | 2 | 1 | 0 | 0 | 0 | 0 | 0 |
 Ty Anderson#50 | 2 | 1 | 0 | 0 | 0 | 0 | 0 |
 Ashton Williams#5 | 2 | 1 | 0 | 0 | 1 | 0 | 0 |
 JD Drew#3 | 2 | 0 | 0 | 0 | 0 | 0 | 0 |
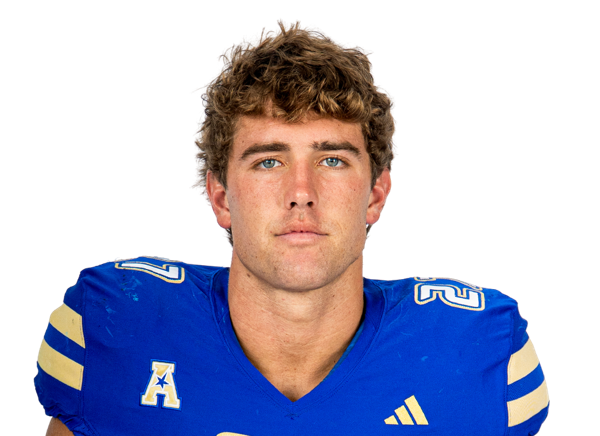 Zane Woodham#27 | 2 | 0 | 0 | 0 | 0 | 0 | 0 |
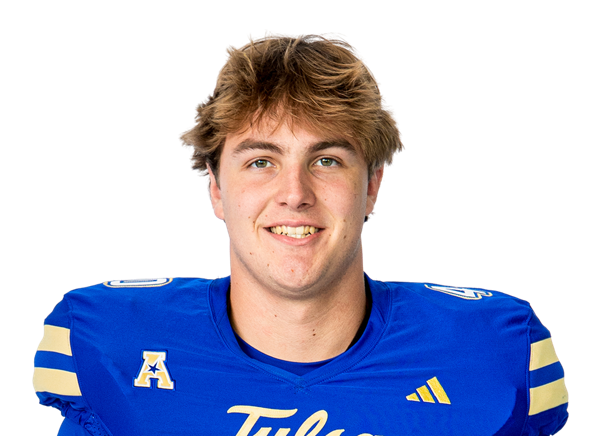 Tristan Lawyer#40 | 2 | 0 | 0 | 0 | 0 | 0 | 0 |
 Ty Williams#22 | 1 | 1 | 0 | 0 | 0 | 0 | 0 |
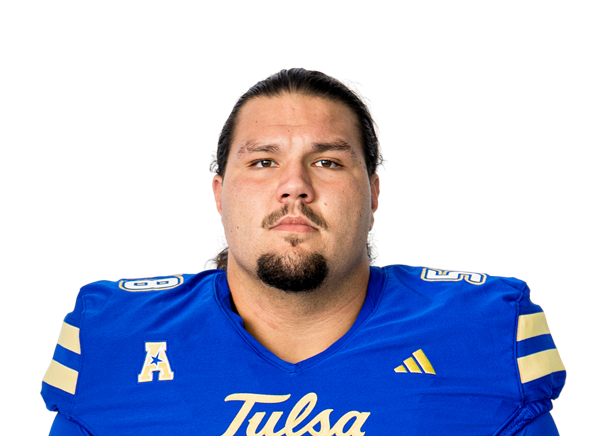 Tyler Rich#58 | 1 | 0 | 0 | 0 | 0 | 0 | 0 |
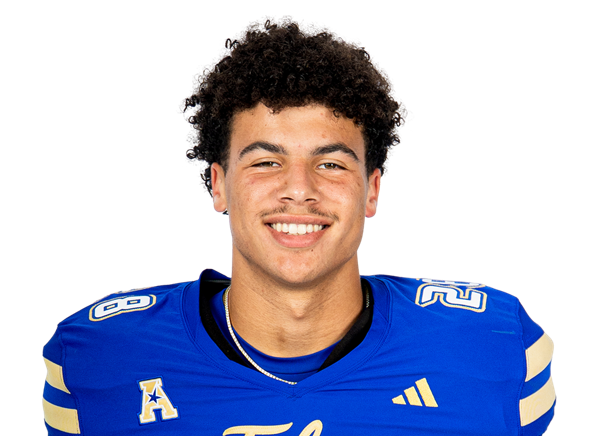 Carter Langenderfer#28 | 1 | 0 | 0 | 0 | 0 | 0 | 0 |
Rice| Player | TOT | SOLO | SACKS | TFL | PD | QB HUR | TD |
|---|---|---|---|---|---|---|---|
| Austin Harnetiaux#54 | 10 | 5 | 1 | 1 | 1 | 1 | 0 |
| Stone Combs#33 | 10 | 3 | 0 | 1 | 0 | 0 | 0 |
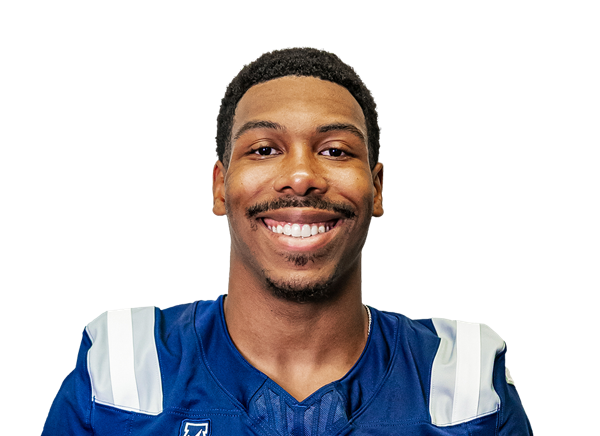 AJ Brown#7 | 7 | 3 | 0 | 0 | 0 | 0 | 0 |
 Jamir Benjamin#12 | 6 | 4 | 0 | 0 | 0 | 0 | 0 |
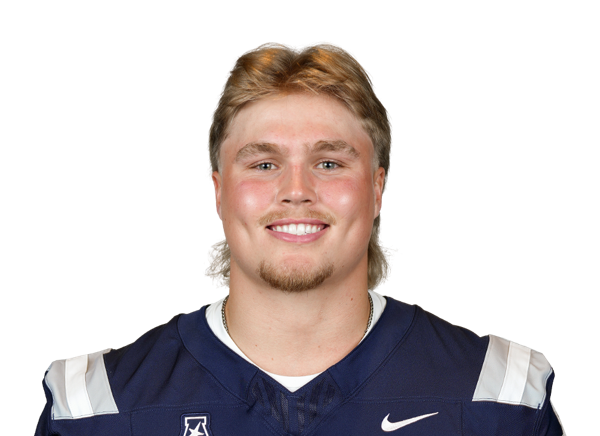 Braden Bays#94 | 5 | 5 | 0 | 3 | 0 | 1 | 0 |
 Koa Akui#3 | 4 | 4 | 0 | 0 | 0 | 0 | 0 |
 Aquantis Clemmons#57 | 3 | 2 | 0 | 0 | 0 | 1 | 0 |
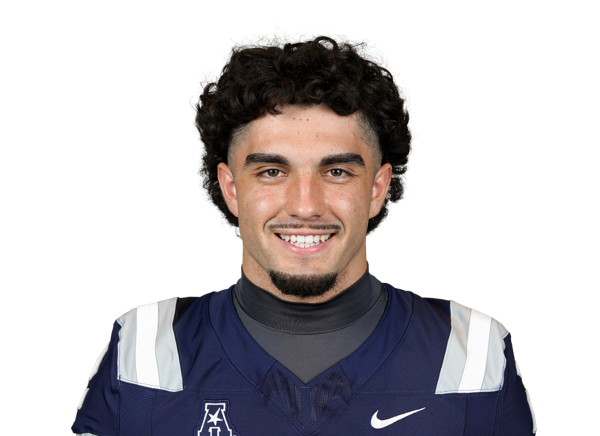 Jo Chavez#2 | 3 | 2 | 0 | 0 | 0 | 1 | 0 |
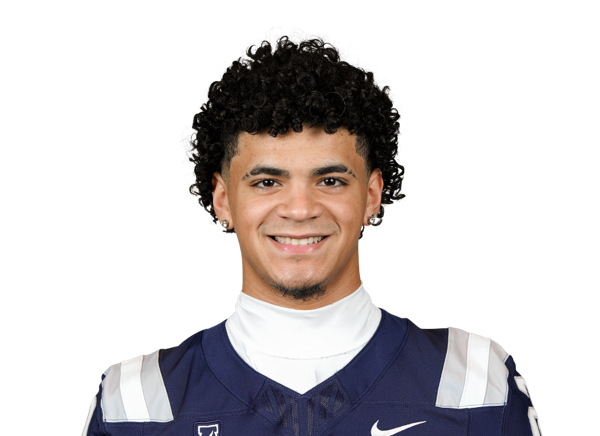 Bailey Fletcher#20 | 3 | 0 | 0 | 0 | 0 | 0 | 0 |
 Joseph Mutombo#8 | 2 | 2 | 0 | 0 | 0 | 0 | 0 |
 Daveon Hook | 2 | 1 | 0 | 1 | 0 | 0 | 0 |
 Luca Akirtava#92 | 2 | 1 | 0 | 1 | 0 | 0 | 0 |
 Chris Bruce#23 | 1 | 1 | 0 | 0 | 0 | 0 | 0 |
| D'Andre Hardeman Jr.#28 | 1 | 1 | 0 | 0 | 0 | 0 | 0 |
 Robert Rooks#98 | 1 | 1 | 0 | 0 | 0 | 0 | 0 |
 Christopher Clark-Jolivet#11 | 1 | 0 | 0 | 0 | 0 | 0 | 0 |
 Beau Barton#14 | 0 | 0 | 0 | 0 | 0 | 1 | 0 |
 Kyren Condoll#10 | 0 | 0 | 0 | 0 | 1 | 0 | 0 |
 Seth Clarke#56 | 0 | 0 | 0 | 0 | 2 | 0 | 0 |
Tulsa| Player | FUM | LOST | REC |
|---|---|---|---|
| Damari Alston#6 | 1 | 0 | 0 |
| Trequan Jones#3 | 1 | 0 | 0 |
 Hudson Ball#32 | 0 | 0 | 1 |
Rice| Player | FUM | LOST | REC |
|---|---|---|---|
| Jacurri Brown#11 | 1 | 1 | 0 |
| Gael Ochoa#4 | 1 | 0 | 0 |
Tulsa| Player | FG | PCT | LONG | XP | PTS |
|---|---|---|---|---|---|
 Owen Carey#10 | 1/1 | 100.0 | 35 | 3/4 | 6 |
Rice| Player | FG | PCT | LONG | XP | PTS |
|---|---|---|---|---|---|
 Tommy Bauchiero#49 | 1/2 | 50.0 | 32 | 2/2 | 5 |
Tulsa| Player | NO | YDS | AVG | TB | In 20 | LONG |
|---|---|---|---|---|---|---|
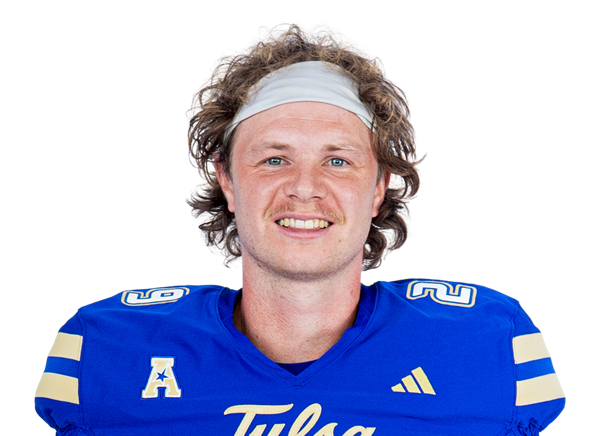 Max Tulen#29 | 2 | 88 | 44.0 | 0 | 2 | 55 |
Rice| Player | NO | YDS | AVG | TB | In 20 | LONG |
|---|---|---|---|---|---|---|
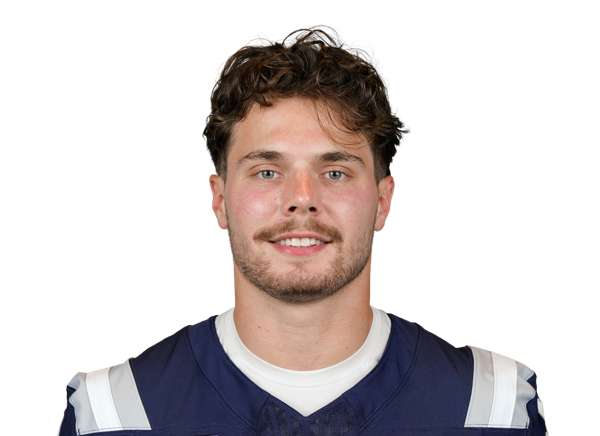 Charlie Durkin#29 | 2 | 94 | 47.0 | 0 | 0 | 48 |
Tulsa| Player | NO | YDS | AVG | LONG | TD |
|---|---|---|---|---|---|
| Trequan Jones#3 | 2 | 28 | 14.0 | 18 | 0 |
Rice| Player | NO | YDS | AVG | LONG | TD |
|---|---|---|---|---|---|
| Max Mosey#13 | 3 | 49 | 16.3 | 25 | 0 |
 Will Swartz#84 | 1 | 4 | 4.0 | 4 | 0 |
Tulsa| Player | NO | YDS | AVG | LONG | TD |
|---|---|---|---|---|---|
| Oran Singleton Jr.#2 | 1 | 6 | 6.0 | 6 | 0 |
Drive Summary
Injury Report
No current injury report is available for this matchup.
Head-to-Head
Historical meetings are not available for this matchup.
Game Information
Division Standings
FBS — American Conference
| Team | W | L | T | Pct | PF | PA | Home | Away | Strk |
|---|---|---|---|---|---|---|---|---|---|
 UTSA | 7 | 2 | 0 | 0.778 | 297 | 268 | 4-0 | 3-2 | L1 |
 North Texas | 7 | 2 | 0 | 0.778 | 402 | 278 | 5-0 | 2-2 | W6 |
 Army | 5 | 4 | 0 | 0.556 | 290 | 228 | 3-2 | 2-2 | L2 |
 Memphis | 8 | 2 | 0 | 0.800 | 390 | 253 | 5-0 | 3-2 | W3 |
 UAB | 6 | 4 | 0 | 0.600 | 232 | 224 | 5-0 | 1-4 | W2 |
 Florida Atlantic | 6 | 4 | 0 | 0.600 | 383 | 353 | 5-0 | 1-4 | L1 |
 East Carolina | 6 | 4 | 0 | 0.600 | 229 | 226 | 4-1 | 2-3 | W3 |
 Tulane | 5 | 5 | 0 | 0.500 | 210 | 280 | 3-2 | 2-3 | W1 |
 Charlotte | 1 | 9 | 0 | 0.100 | 193 | 362 | 0-5 | 1-4 | L3 |
 Navy | 3 | 6 | 0 | 0.333 | 263 | 274 | 3-2 | 0-4 | W1 |
 Temple | 2 | 8 | 0 | 0.200 | 234 | 291 | 1-5 | 1-3 | L5 |
 South Florida | 6 | 4 | 0 | 0.600 | 274 | 188 | 4-2 | 2-2 | L2 |
| Tulsa | 6 | 4 | 0 | 0.600 | 336 | 226 | 3-2 | 3-2 | W2 |
| Rice | 1 | 9 | 0 | 0.100 | 208 | 326 | 1-4 | 0-5 | L9 |
Quarterbacks & Specialists
Receivers & Backs
Defensive Line & Linebackers
Defensive Backs
Other
Quarterbacks & Specialists
Receivers & Backs
Defensive Line & Linebackers
Defensive Backs
Other
Passing
Rushing
Receiving
Miscellaneous
Defense
Defensive Interceptions
General
Returning
Kicking
Punting
Scoring
FAQs: Tulsa vs Rice
How can I watch Tulsa vs. Rice live?
You can stream Tulsa vs. Rice live on ESPN+. ESPN+ will carry the October 17 college football game between the Golden Hurricane and the Owls.
What time does Tulsa vs. Rice start?
The game starts at 4:30 p.m. ET on Saturday, October 17, 2026. That’s 3:30 p.m. Central for fans in Houston and Tulsa.
Where is Tulsa vs. Rice being played?
The game will be played at Rice Stadium in Houston, Texas. Rice is the home team for this matchup of AAC teams, with Tulsa traveling to face the Owls.
Where can I buy tickets for Tulsa vs. Rice?
Tickets for the game are available through StubHub, Vivid Seats and Ticketmaster. All three offer tickets for the October 17 matchup at Rice Stadium.
How do the teams compare on offense?
Through their first five games, Tulsa averaged 27.8 points and 354.2 yards per game, while Rice averaged 18.0 points and 329.2 yards. Rice allowed 27.4 points per game over that stretch; Tulsa allowed 21.2.
Which Tulsa players should fans keep an eye on?
Damari Alston rushed for 292 yards and five touchdowns through Tulsa’s first five games. Oran Singleton added 26 catches for 306 yards and two touchdowns, while Thomas Davis recorded four sacks and an interception on defense.