

UCLA vs California Live Score (6 Sep, 2026)
Score by Quarter
| Team | Q1 | Q2 | Q3 | Q4 | Final |
|---|---|---|---|---|---|
 UCLA |
7 | 17 | 0 | 21 | 45 |
 California |
7 | 10 | 7 | 0 | 24 |
Scoring Plays
Q1
10:28
10:28
J. Sagapolutele pass to C. Hendricks for 9 yds, for a TD (T. McGough KICK)
Passing Touchdown
0 – 7
Q1
7:00
7:00
N. Iamaleava run for 9 yds, for a TD (M. Bhaghani KICK)
Rushing Touchdown
7 – 7
Q2
12:46
12:46
T. McGough 28 yd FG GOOD
Field Goal Good
7 – 10
Q2
10:19
10:19
A. Woods run for 31 yds, for a TD (M. Bhaghani KICK)
Rushing Touchdown
14 – 10
Q2
3:23
3:23
W. Knight run for 8 yds, for a TD (M. Bhaghani KICK)
Rushing Touchdown
21 – 10
Q2
0:13
0:13
J. Sagapolutele pass to M. Mini for 8 yds, for a TD (T. McGough KICK)
Passing Touchdown
21 – 17
Q2
0:03
0:03
M. Bhaghani 38 yd FG GOOD
Field Goal Good
24 – 17
Q3
3:50
3:50
A. Mohammed run for 1 yd, for a TD (T. McGough KICK)
Rushing Touchdown
24 – 24
Q4
8:46
8:46
W. Knight run for 31 yds, for a TD (M. Bhaghani KICK)
Rushing Touchdown
31 – 24
Q4
2:58
2:58
W. Knight run for 4 yds, for a TD (M. Bhaghani KICK)
Rushing Touchdown
38 – 24
Q4
1:17
1:17
A. Woods run for 53 yds, for a TD (M. Bhaghani KICK)
Rushing Touchdown
45 – 24
Game Leaders
UCLACalifornia
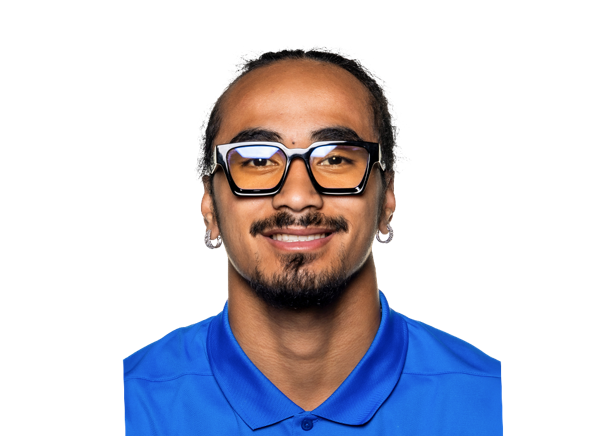 N. Iamaleava QB
Passing Yards
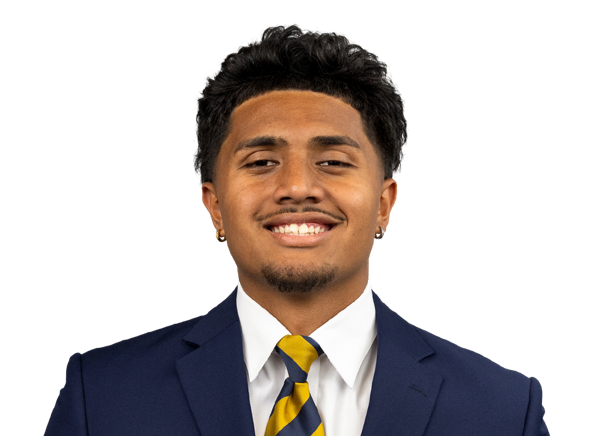 J. Sagapolutele QB
 A. Woods RB
Rushing Yards
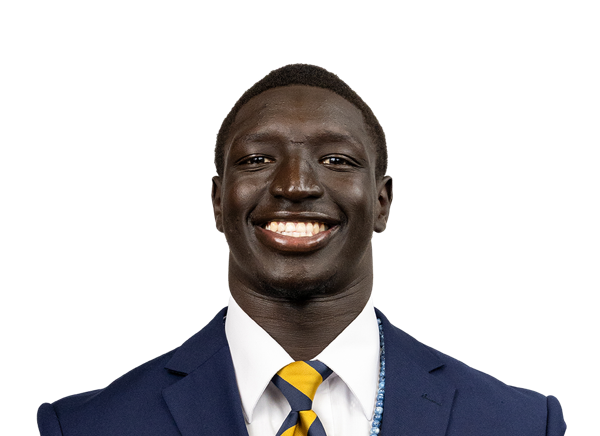 A. Mohammed RB
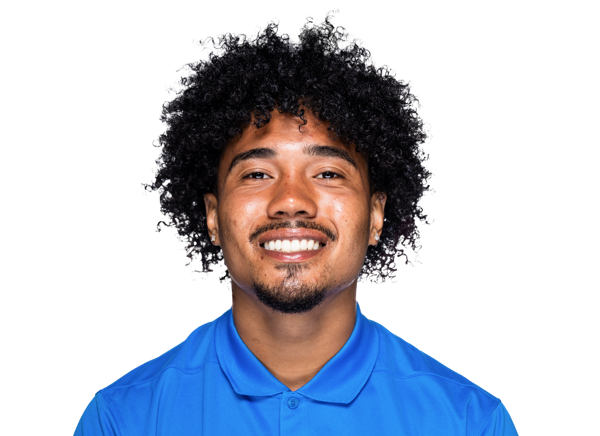 M. Matthews WR
Receiving Yards
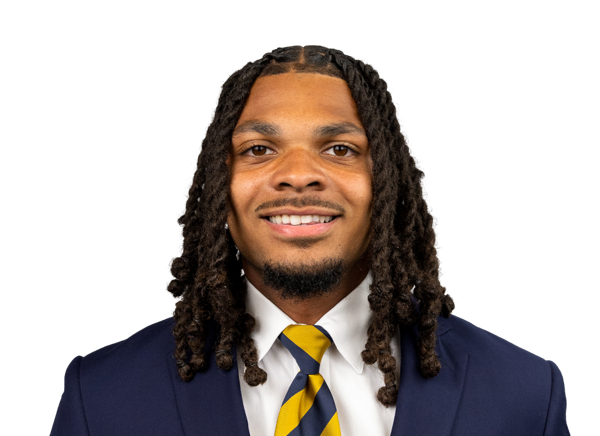 I. Strong WR
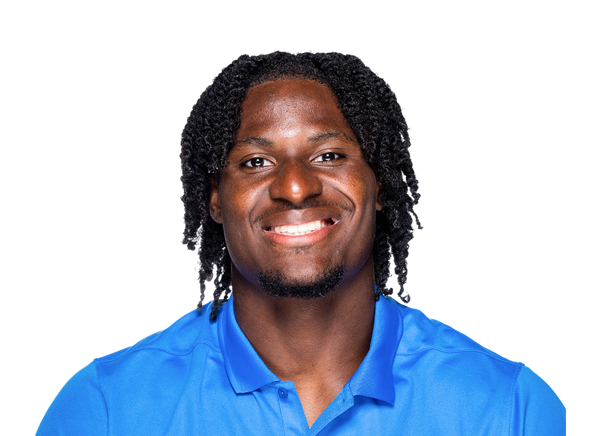 S. Omosigho LB
Sacks
 N. Burrell DLS. Omosigho LB
Tackles
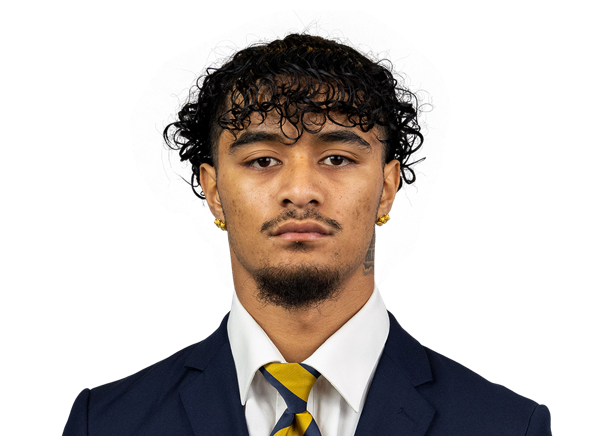 K. Lopa DB
Player Box Score
UCLA| Player | C/ATT | YDS | AVG | TD | INT |
|---|---|---|---|---|---|
| Nico Iamaleava#9 | 14/22 | 184 | 8.4 | 0 | 1 |
California| Player | C/ATT | YDS | AVG | TD | INT |
|---|---|---|---|---|---|
| Jaron-Keawe Sagapolutele#3 | 24/41 | 271 | 6.6 | 2 | 2 |
 Jackson Brousseau#11 | 2/6 | 20 | 3.3 | 0 | 0 |
UCLA| Player | CAR | YDS | AVG | TD | LONG |
|---|---|---|---|---|---|
| Anthony Woods#6 | 8 | 118 | 14.8 | 2 | 53 |
 Wayne Knight#3 | 8 | 71 | 8.9 | 3 | 31 |
 Jaivian Thomas#21 | 5 | 41 | 8.2 | 0 | 15 |
| Nico Iamaleava#9 | 9 | 29 | 3.2 | 1 | 10 |
 Brian Rowe Jr.#2 | 1 | 20 | 20.0 | 0 | 20 |
 Team | 1 | -2 | -2.0 | 0 | 2 |
California| Player | CAR | YDS | AVG | TD | LONG |
|---|---|---|---|---|---|
| Adam Mohammed#24 | 28 | 120 | 4.3 | 1 | 20 |
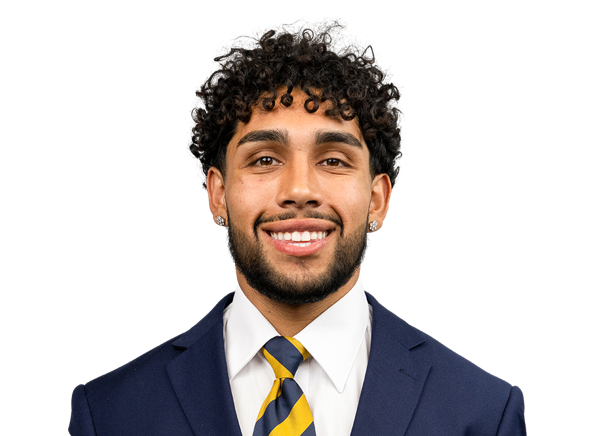 Carter Vargas#1 | 4 | 14 | 3.5 | 0 | 6 |
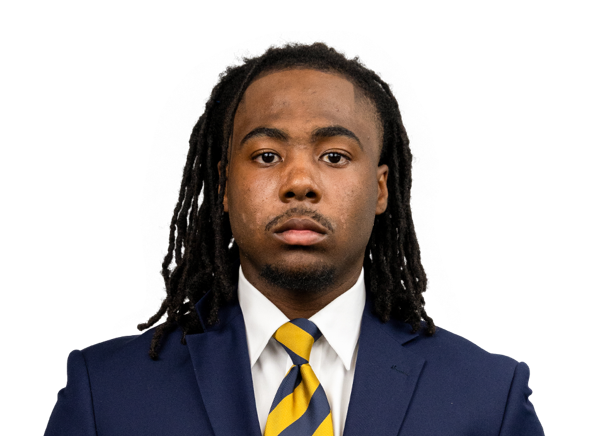 Ashten Emory#20 | 1 | 6 | 6.0 | 0 | 6 |
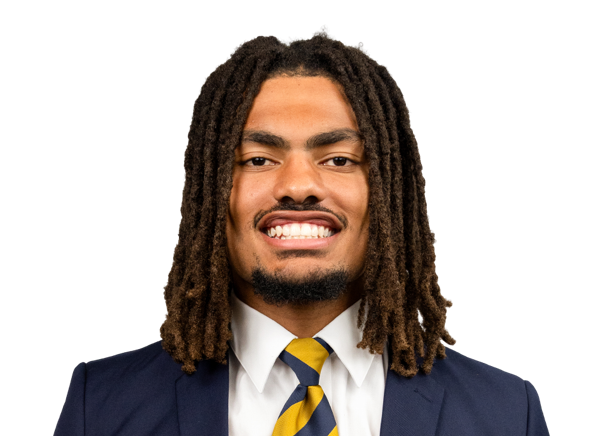 Anthony League#25 | 1 | 1 | 1.0 | 0 | 1 |
| Team | 2 | -6 | -3.0 | 0 | 6 |
| Jaron-Keawe Sagapolutele#3 | 4 | -16 | -4.0 | 0 | 2 |
UCLA| Player | REC | YDS | AVG | TD | LONG |
|---|---|---|---|---|---|
| Mikey Matthews#7 | 4 | 88 | 22.0 | 0 | 43 |
| Wayne Knight#3 | 2 | 30 | 15.0 | 0 | 22 |
| Brian Rowe Jr.#2 | 3 | 28 | 9.3 | 0 | 15 |
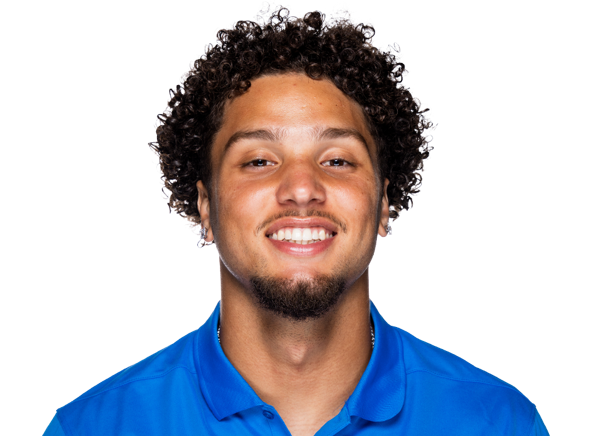 Landon Ellis#11 | 1 | 20 | 20.0 | 0 | 20 |
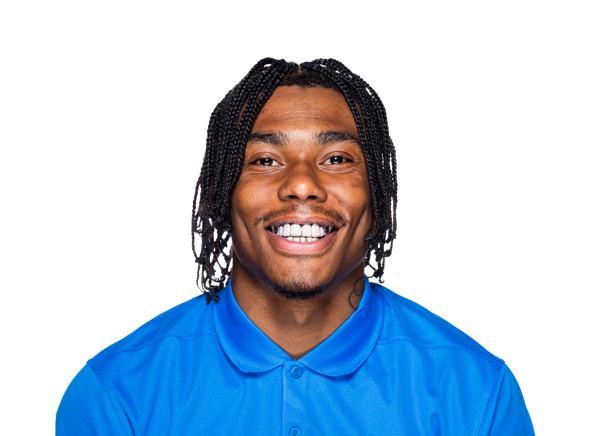 Semaj Morgan#4 | 2 | 13 | 6.5 | 0 | 7 |
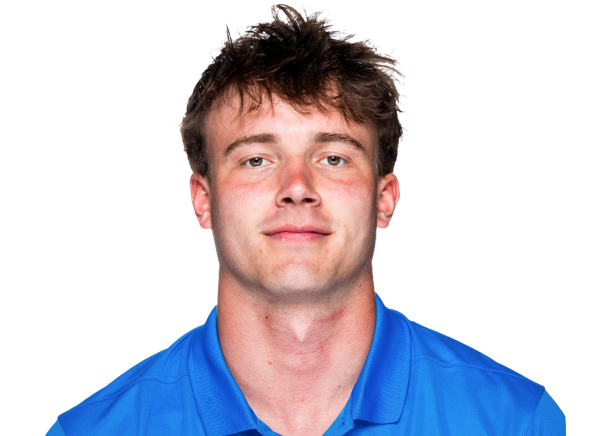 Harry Lodge#19 | 1 | 4 | 4.0 | 0 | 4 |
| Anthony Woods#6 | 1 | 1 | 1.0 | 0 | 1 |
California| Player | REC | YDS | AVG | TD | LONG |
|---|---|---|---|---|---|
| Ian Strong#9 | 5 | 94 | 18.8 | 0 | 49 |
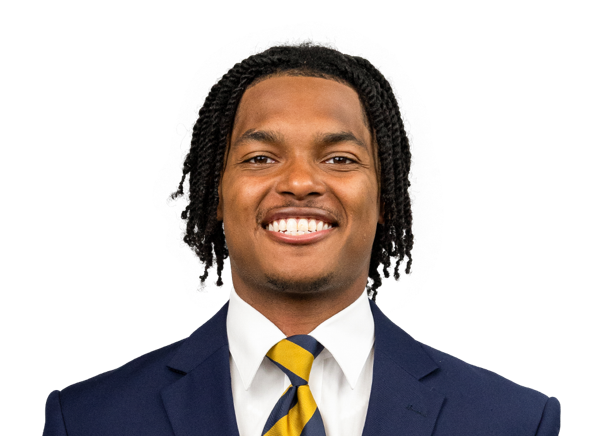 Chase Hendricks#7 | 6 | 66 | 11.0 | 1 | 30 |
 Mason Mini#85 | 4 | 58 | 14.5 | 1 | 26 |
| Adam Mohammed#24 | 7 | 46 | 6.6 | 0 | 14 |
 Cooper Perry#10 | 1 | 19 | 19.0 | 0 | 19 |
| Carter Vargas#1 | 2 | 6 | 3.0 | 0 | 6 |
 Jordan King#4 | 1 | 2 | 2.0 | 0 | 2 |
UCLA| Player | TOT | SOLO | SACKS | TFL | PD | QB HUR | TD |
|---|---|---|---|---|---|---|---|
| Sammy Omosigho#10 | 14 | 7 | 1 | 2 | 0 | 0 | 0 |
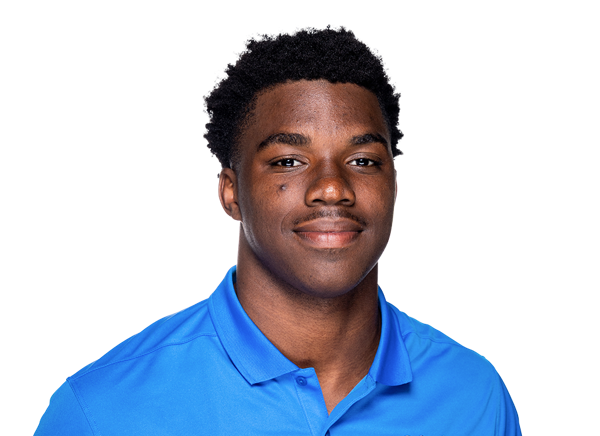 Jalen Woods#9 | 11 | 4 | 0 | 0.5 | 0 | 0 | 0 |
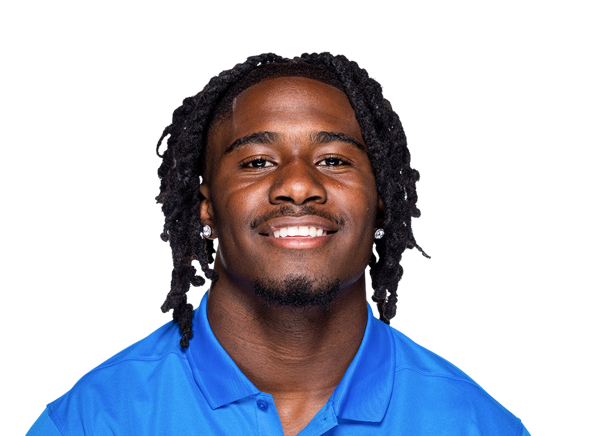 Ta'Shawn James#27 | 8 | 3 | 0 | 0 | 0 | 1 | 0 |
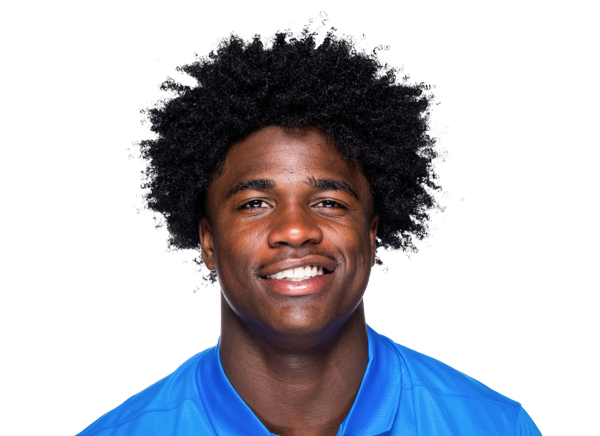 Scooter Jackson#1 | 5 | 4 | 0 | 0 | 1 | 0 | 0 |
 Sahir West#15 | 5 | 3 | 0 | 1 | 0 | 1 | 0 |
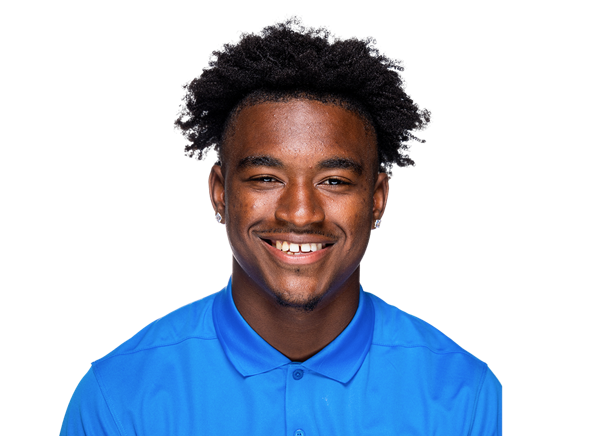 Rodrick Pleasant#2 | 5 | 1 | 0 | 0.5 | 2 | 0 | 0 |
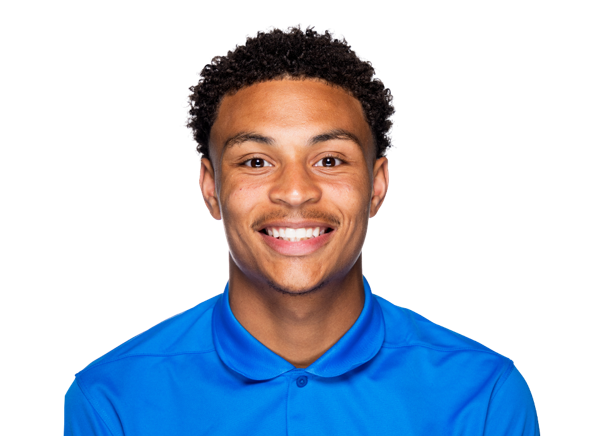 Malik Hartford#12 | 5 | 1 | 0 | 0.5 | 1 | 0 | 0 |
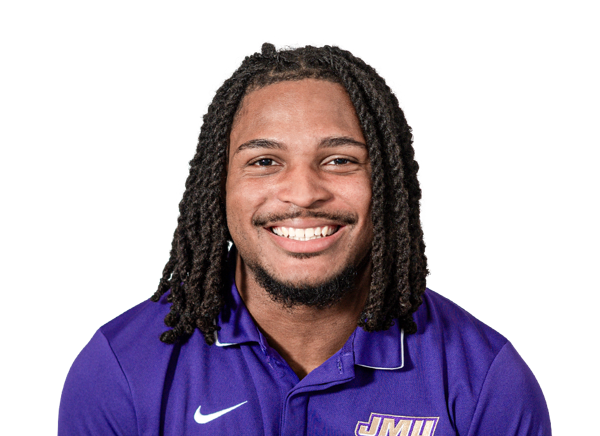 Derrick Barksdale#32 | 4 | 3 | 1 | 1 | 0 | 0 | 0 |
 Anthony Sacca#39 | 3 | 2 | 0 | 0 | 0 | 0 | 0 |
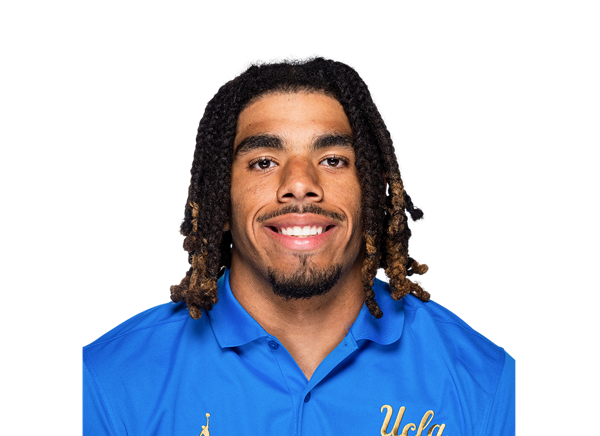 Donavyn Pellot | 3 | 1 | 0 | 0.5 | 1 | 0 | 0 |
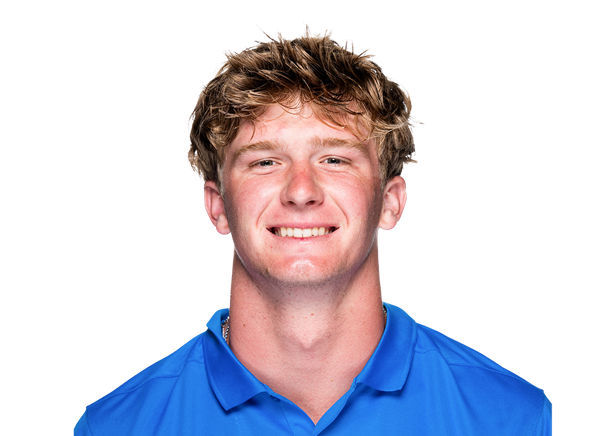 Scott Taylor#20 | 3 | 0 | 0 | 0 | 1 | 0 | 0 |
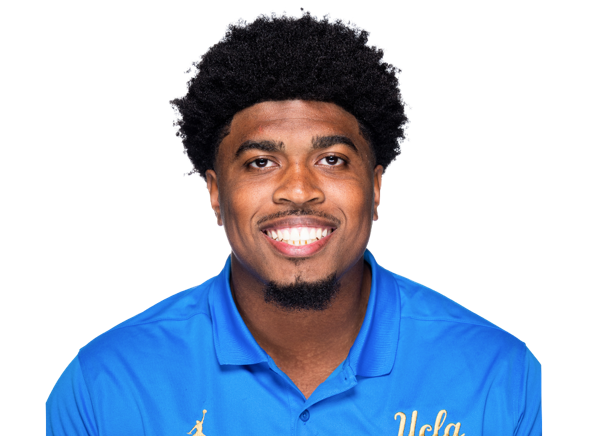 Tyson Ford#95 | 2 | 1 | 0 | 0 | 0 | 0 | 0 |
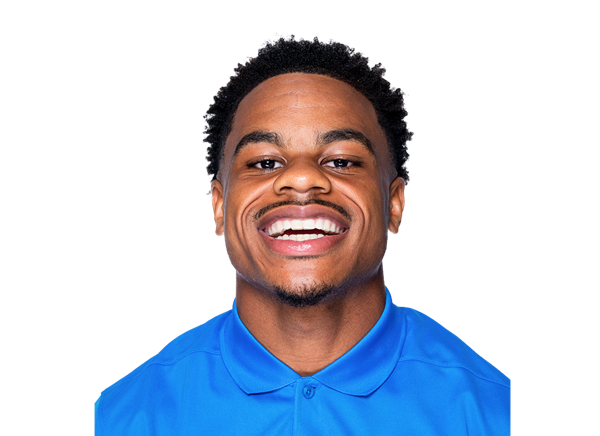 Cole Martin#4 | 2 | 1 | 0 | 0 | 0 | 0 | 0 |
 Tao Johnson#6 | 2 | 1 | 0 | 0 | 0 | 0 | 0 |
 Trent Hendrick#25 | 2 | 0 | 0 | 0 | 0 | 0 | 0 |
 Nico Davillier#11 | 1 | 1 | 0 | 0 | 0 | 0 | 0 |
 Darold DeNgohe#92 | 1 | 1 | 0 | 0 | 0 | 0 | 0 |
 Mason Rivera#28 | 1 | 1 | 0 | 0 | 0 | 0 | 0 |
 Osiris Gilbert#18 | 1 | 1 | 0 | 0 | 1 | 0 | 0 |
 Cole Cogshell#24 | 1 | 1 | 0 | 0 | 0 | 0 | 0 |
 Ty Lee#22 | 1 | 0 | 0 | 0 | 0 | 0 | 0 |
 Amier Washington#90 | 1 | 0 | 0 | 0 | 0 | 0 | 0 |
 A.J. Fuimaono#55 | 1 | 0 | 0 | 0 | 0 | 0 | 0 |
 Jewelous Walls#41 | 1 | 0 | 0 | 0 | 0 | 0 | 0 |
 Aiden Gobaira#97 | 0 | 0 | 0 | 0 | 0 | 1 | 0 |
California| Player | TOT | SOLO | SACKS | TFL | PD | QB HUR | TD |
|---|---|---|---|---|---|---|---|
| Kingston Lopa#2 | 6 | 5 | 0 | 0 | 0 | 1 | 0 |
 Tristan Jernigan#32 | 6 | 4 | 0 | 0 | 0 | 0 | 0 |
 AJ Tuitele#9 | 4 | 2 | 0 | 0 | 0 | 1 | 0 |
 Kamar Mothudi#3 | 4 | 1 | 0 | 0 | 0 | 0 | 0 |
| Nate Burrell#98 | 3 | 3 | 1 | 1 | 0 | 0 | 0 |
 Daniel Harris#7 | 3 | 3 | 1 | 1 | 1 | 0 | 0 |
 Khamani Hudson#25 | 3 | 3 | 0 | 0 | 0 | 0 | 0 |
 Isaiah Crosby#23 | 3 | 2 | 0 | 0 | 0 | 0 | 0 |
 Cam Sidney#20 | 2 | 2 | 0 | 0 | 0 | 0 | 0 |
 Aaron Hampton#21 | 2 | 1 | 0 | 0 | 0 | 0 | 0 |
 JD McKinley#33 | 2 | 0 | 0 | 0 | 0 | 0 | 0 |
 Tristan Dunn#22 | 1 | 1 | 0 | 0 | 0 | 0 | 0 |
| Adam Mohammed#24 | 1 | 1 | 0 | 0 | 0 | 0 | 0 |
 Quimari Shemwell#24 | 1 | 1 | 0 | 0 | 0 | 0 | 0 |
 Derek Wilkins#96 | 1 | 0 | 0 | 0 | 2 | 0 | 0 |
 Ricky Fletcher#1 | 1 | 0 | 0 | 0 | 2 | 0 | 0 |
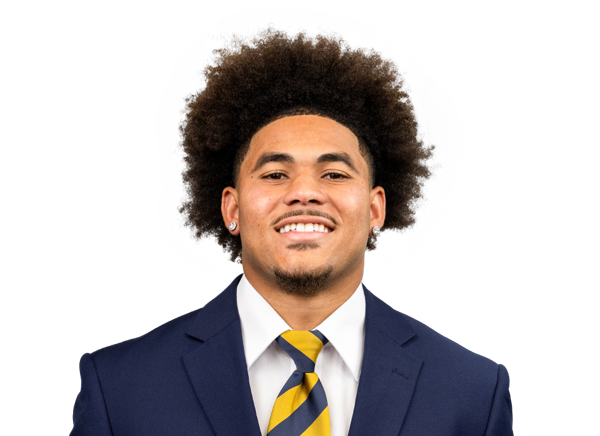 Michael Hurst Jr.#16 | 1 | 0 | 0 | 0 | 0 | 0 | 0 |
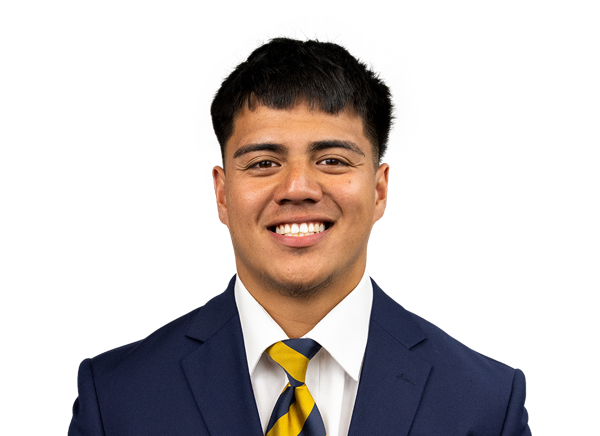 Aiden Manutai#14 | 1 | 0 | 0 | 0 | 0 | 0 | 0 |
UCLA| Player | FUM | LOST | REC |
|---|---|---|---|
| Nico Iamaleava#9 | 1 | 0 | 0 |
 Robert Stafford III#3 | 0 | 0 | 1 |
| Amier Washington#90 | 0 | 0 | 1 |
California| Player | FUM | LOST | REC |
|---|---|---|---|
| Jaron-Keawe Sagapolutele#3 | 1 | 1 | 0 |
| Team | 1 | 0 | 0 |
UCLA| Player | FG | PCT | LONG | XP | PTS |
|---|---|---|---|---|---|
 Mateen Bhaghani#15 | 1/1 | 100.0 | 38 | 6/6 | 9 |
California| Player | FG | PCT | LONG | XP | PTS |
|---|---|---|---|---|---|
 Towns McGough#33 | 1/1 | 100.0 | 28 | 3/3 | 6 |
UCLA| Player | NO | YDS | AVG | TB | In 20 | LONG |
|---|---|---|---|---|---|---|
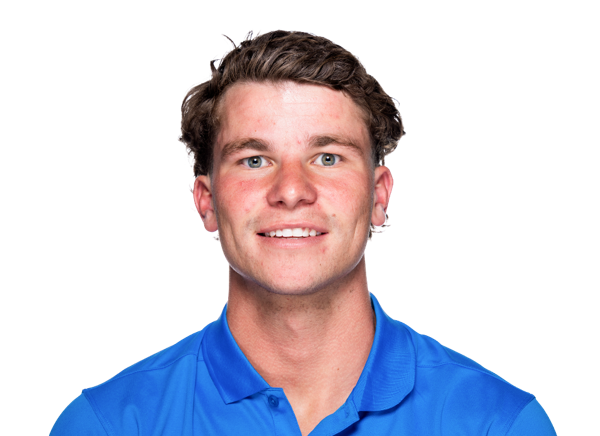 Curtis Gerrand#35 | 5 | 215 | 43.0 | 0 | 3 | 46 |
California| Player | NO | YDS | AVG | TB | In 20 | LONG |
|---|---|---|---|---|---|---|
 Angus Davies#29 | 3 | 138 | 46.0 | 0 | 0 | 52 |
UCLA| Player | NO | YDS | AVG | LONG | TD |
|---|---|---|---|---|---|
| Wayne Knight#3 | 2 | 56 | 28.0 | 29 | 0 |
California| Player | NO | YDS | AVG | LONG | TD |
|---|---|---|---|---|---|
| Niles Davis#26 | 2 | 38 | 19.0 | 20 | 0 |
UCLA| Player | NO | YDS | AVG | LONG | TD |
|---|---|---|---|---|---|
| Mikey Matthews#7 | 1 | 12 | 12.0 | 12 | 0 |
California| Player | NO | YDS | AVG | LONG | TD |
|---|---|---|---|---|---|
| Isaiah Crosby#23 | 1 | 3 | 3.0 | 3 | 0 |
UCLA| Player | INT | YDS | TD |
|---|---|---|---|
| Ta'Shawn James#27 | 2 | 19 | 0 |
California| Player | INT | YDS | TD |
|---|---|---|---|
| Kingston Lopa#2 | 1 | 0 | 0 |
Drive Summary
CAL
Touchdown
75
UCLA
Touchdown
71
CAL
Punt
7
UCLA
Punt
6
CAL
Punt
21
UCLA
Punt
3
CAL
Field Goal
55
UCLA
Touchdown
75
CAL
Punt
-1
UCLA
Touchdown
76
CAL
Fumble
19
UCLA
Interception
24
CAL
Touchdown
79
UCLA
Field Goal
0
CAL
End Of Half
-2
UCLA
Punt
11
CAL
Touchdown
85
UCLA
Punt
14
CAL
Downs
32
UCLA
Punt
-4
CAL
Interception
2
UCLA
Touchdown
31
CAL
Interception
16
UCLA
Touchdown
46
CAL
Downs
28
UCLA
Touchdown
53
CAL
Downs
20
UCLA
End Of Quarter
-2
Injury Report
No current injury report is available for this matchup.
Head-to-Head
Historical meetings are not available for this matchup.
Game Information
StageWeek 1
Season2026
KickoffSat, Sep 5, 10:30 pm
VenueCalifornia Memorial Stadium
LocationBerkeley, CA
SurfaceArtificial Turf
BroadcastESPN
Division Standings
FBS — Big Ten Conference
| Team | W | L | T | Pct | PF | PA | Home | Away | Strk |
|---|---|---|---|---|---|---|---|---|---|
 USC | 7 | 3 | 0 | 0.700 | 305 | 245 | 5-1 | 2-2 | L1 |
 Illinois | 6 | 4 | 0 | 0.600 | 270 | 229 | 4-2 | 2-2 | L1 |
 Indiana | 9 | 1 | 0 | 0.900 | 319 | 125 | 6-1 | 3-0 | W3 |
 Iowa | 8 | 2 | 0 | 0.800 | 278 | 117 | 5-1 | 3-1 | W3 |
 Maryland | 4 | 6 | 0 | 0.400 | 273 | 303 | 2-4 | 2-2 | W2 |
 Michigan | 5 | 5 | 0 | 0.500 | 183 | 177 | 4-3 | 1-2 | L2 |
 Michigan State | 3 | 7 | 0 | 0.300 | 188 | 233 | 2-4 | 1-3 | L1 |
 Minnesota | 5 | 5 | 0 | 0.500 | 236 | 240 | 4-2 | 1-3 | L3 |
 Nebraska | 6 | 4 | 0 | 0.600 | 303 | 149 | 4-2 | 2-2 | W1 |
 Northwestern | 6 | 4 | 0 | 0.600 | 298 | 202 | 5-1 | 1-3 | L3 |
 Ohio State | 7 | 3 | 0 | 0.700 | 349 | 184 | 5-1 | 2-2 | W1 |
 Oregon | 7 | 3 | 0 | 0.700 | 338 | 206 | 5-1 | 2-2 | W3 |
 Penn State | 6 | 4 | 0 | 0.600 | 302 | 188 | 4-2 | 2-2 | W3 |
 Purdue | 3 | 7 | 0 | 0.300 | 272 | 319 | 2-4 | 1-3 | L4 |
| UCLA | 10 | 0 | 0 | 1.000 | 324 | 141 | 6-0 | 4-0 | W10 |
 Washington | 6 | 4 | 0 | 0.600 | 258 | 211 | 3-3 | 3-1 | W1 |
 Wisconsin | 6 | 4 | 0 | 0.600 | 241 | 171 | 5-0 | 1-4 | L1 |
 Rutgers | 2 | 8 | 0 | 0.200 | 232 | 323 | 1-5 | 1-3 | L4 |
FBS — Atlantic Coast Conference
| Team | W | L | T | Pct | PF | PA | Home | Away | Strk |
|---|---|---|---|---|---|---|---|---|---|
 Miami | 9 | 1 | 0 | 0.900 | 441 | 198 | 5-0 | 4-1 | W1 |
 Virginia | 5 | 5 | 0 | 0.500 | 269 | 215 | 5-2 | 0-3 | W1 |
 Duke | 7 | 3 | 0 | 0.700 | 322 | 153 | 4-1 | 3-2 | L1 |
 Florida State | 5 | 5 | 0 | 0.500 | 292 | 265 | 3-2 | 2-3 | W2 |
 North Carolina | 5 | 5 | 0 | 0.500 | 258 | 221 | 1-4 | 4-1 | L1 |
 Pittsburgh | 6 | 4 | 0 | 0.600 | 297 | 194 | 5-2 | 1-2 | L1 |
 Syracuse | 5 | 5 | 0 | 0.500 | 298 | 260 | 2-3 | 3-2 | W1 |
 Virginia Tech | 6 | 4 | 0 | 0.600 | 330 | 255 | 3-2 | 3-2 | L2 |
 Wake Forest | 9 | 1 | 0 | 0.900 | 439 | 150 | 4-1 | 5-0 | W7 |
 Louisville | 7 | 3 | 0 | 0.700 | 383 | 247 | 4-1 | 3-2 | W5 |
 SMU | 7 | 3 | 0 | 0.700 | 340 | 255 | 6-1 | 1-2 | L1 |
 Boston College | 4 | 6 | 0 | 0.400 | 204 | 284 | 3-2 | 1-4 | L3 |
| California | 3 | 7 | 0 | 0.300 | 204 | 320 | 2-3 | 1-4 | L4 |
 Clemson | 6 | 4 | 0 | 0.600 | 210 | 206 | 3-3 | 3-1 | L1 |
 Georgia Tech | 3 | 7 | 0 | 0.300 | 235 | 296 | 2-4 | 1-3 | W1 |
 Stanford | 5 | 5 | 0 | 0.500 | 223 | 358 | 4-1 | 1-4 | W1 |
 NC State | 4 | 6 | 0 | 0.400 | 291 | 282 | 4-3 | 0-3 | L2 |
UCLA
1st in Big Ten
VS
California
16th in ACC
Quarterbacks & Specialists
#35
Curtis Gerrand
#9
Nico Iamaleava
Receivers & Backs
#11
Landon Ellis
#3
Wayne Knight
#19
Harry Lodge
#7
Mikey Matthews
#4
Semaj Morgan
#2
Brian Rowe Jr.
#21
Jaivian Thomas
#6
Anthony Woods
Defensive Line & Linebackers
#24
Cole Cogshell
#11
Nico Davillier
#92
Darold DeNgohe
#95
Tyson Ford
#55
A.J. Fuimaono
#97
Aiden Gobaira
#25
Trent Hendrick
#10
Sammy Omosigho
Donavyn Pellot
#39
Anthony Sacca
#20
Scott Taylor
#41
Jewelous Walls
#90
Amier Washington
#15
Sahir West
#9
Jalen Woods
Defensive Backs
#32
Derrick Barksdale
#18
Osiris Gilbert
#12
Malik Hartford
#1
Scooter Jackson
#27
Ta'Shawn James
#6
Tao Johnson
#22
Ty Lee
#4
Cole Martin
#2
Rodrick Pleasant
#28
Mason Rivera
#3
Robert Stafford III
Other
#15
Mateen Bhaghani
Quarterbacks & Specialists
#11
Jackson Brousseau
#29
Angus Davies
#3
Jaron-Keawe Sagapolutele
Receivers & Backs
#20
Ashten Emory
#7
Chase Hendricks
#4
Jordan King
#25
Anthony League
#85
Mason Mini
#24
Adam Mohammed
#10
Cooper Perry
#9
Ian Strong
#1
Carter Vargas
Defensive Line & Linebackers
#98
Nate Burrell
#21
Aaron Hampton
#32
Tristan Jernigan
#33
JD McKinley
#3
Kamar Mothudi
#9
AJ Tuitele
#96
Derek Wilkins
Defensive Backs
#23
Isaiah Crosby
#26
Niles Davis
#22
Tristan Dunn
#1
Ricky Fletcher
#7
Daniel Harris
#25
Khamani Hudson
#16
Michael Hurst Jr.
#2
Kingston Lopa
#14
Aiden Manutai
#24
Quimari Shemwell
#20
Cam Sidney
Other
#33
Towns McGough
UCLA
1st in Big Ten
VS
California
15th in ACC
Passing
59.2
Completion Percentage
64.8
155
Completions
273
3.10
Interception Percentage
2.10
8
Interceptions
9
83
Longest Pass
91
2,221
Net Passing Yards
2,637
222.1
Net Passing Yards Per Game
263.7
262
Passing Attempts
421
4.60
Passing Touchdown %
3.30
12
Passing Touchdowns
14
139.5
Passer Rating
124.5
13
Total Sacks
22
104
Sack Yards Lost
154
8.5
Yards Per Pass Attempt
6.3
2,221
Passing Yards
2,637
0
Passing Fumbles Lost
0
10
Team Games Played
10
424.8
Yards Per Game
342.4
32.4
Total Points Per Game
20.4
324
Total Points
204
41
Total Touchdowns
25
222.1
Passing Yards Per Game
263.7
155-262
Comp-Att
273-421
13-104
Sacks-Yards Lost
22-154
Rushing
396
Rushing Attempts
272
2,027
Rushing Yards
787
5.1
Yards Per Rush Attempt
2.9
63
Long Rushing
29
0
20+ Yard Rushing Plays
0
26
Rushing Touchdowns
9
202.7
Rushing Yards Per Game
78.7
0
Rushing Fumbles
0
0
Rushing Fumbles Lost
0
97
Rushing 1st downs
47
10
Team Games Played
10
4,248
Total Yards
3,424
671
Total Offensive Plays
715
32.4
Total Points Per Game
20.4
324
Total Points
204
41
Total Touchdowns
25
Receiving
155
Receptions
273
0
Receiving Targets
0
2,221
Receiving Yards
2,637
2,221
Receiving Yards
2,637
12
Receiving Touchdowns
14
83
Long Reception
91
0
20+ Yard Receiving Plays
0
222.1
Receiving Yards Per Game
263.7
0
Receiving Fumbles
0
0
Receiving Fumbles Lost
0
1104
Receiving Yards After Catch
1525
80
Receiving First Downs
115
10
Team Games Played
10
14.3
Yards Per Reception
9.7
32.4
Total Points Per Game
20.4
324
Total Points
204
41
Total Touchdowns
25
Miscellaneous
201
Total 1st downs
193
97
Rushing 1st downs
47
80
Passing 1st downs
115
24
1st downs by penalty
30
62
Third Down Conversions
55
138
Third Down Attempts
153
44.93
3rd down %
35.95
2
Fourth Down Conversions
7
10
First Downs Attempts
25
20.00
4th down %
28.00
78
Total Penalties
85
707
Total Penalty Yards
796
19347
Possession Time Seconds
17866
0.00
Red Zone Field Goal Percentage
0.00
0.00
Red Zone Scoring Percentage
0.00
0.00
Red Zone Efficiency Percentage
0.00
0.00
Red Zone Touchdown Percentage
0.00
18
Total Takeaways
14
14
Total Giveaways
12
4
Turnover Ratio
2
0
Fumbles Lost
0
62-138
3rd down efficiency
55-153
2-10
4th down efficiency
7-25
78-707
Total-Yards
85-796
Defense
324
Solo Tackles
323
264
Assist Tackles
326
588
Total Tackles
649
22
Sacks
15
151
Sack Yards
100
85
Stuffs
61
39
Passes Defended
32
17.7
Average Interception Yards
14.9
67
Long Interception
53
0
Miscellaneous Touchdowns
0
3
Kicks Blocked
2
42
Tackles For Loss
33
10
Team Games Played
10
Defensive Interceptions
20
Interceptions
7
353
Interception Yards
104
3
Interception Touchdowns
1
20-353
INT: Total
7-104
General
11
Fumbles
8
10
Forced Fumbles
4
10
Fumbles Recovered
5
0
Fumbles Touchdowns
1
10
Games Played
10
11-0
Fumbles-Lost
8-0
Returning
12
Kick Returns
17
227
Kick Return Yards
337
18.9
Yards Per Kick Return
19.8
29
Long Kick Return
46
0
Kick Return Touchdowns
0
18
Punt Returns
14
159
Punt Return Yards
79
8.8
Yards Per Punt Return
5.6
25
Long Punt Return
24
0
Punt Return Touchdowns
0
0
Punt Return Fair Catches
0
0
Kick Return Fumbles Lost
0
0
Punt Return Fumbles Lost
0
10
Team Games Played
10
18-159
Punt: Total
14-79
Kicking
12
Field Goal Made
10
16
Field Goal Attempts
15
75.0
Field Goal Percentage
66.7
40
Long Field Goal Made
41
0
Field Goal Attempts 1-19
0
5
Field Goal Attempts 20-29
2
7
Field Goal Attempts 30-39
8
2
Field Goal Attempts 40-49
3
2
Field Goal Attempts 50+
2
40
Extra Points Made
20
40
Extra Point Attempts
20
100.0
Extra Point Percentage
100.0
0
Field Goals Made 1-19
0
4
Field Goals Made 20-29
2
7
Field Goals Made 30-39
7
1
Field Goals Made 40-49
1
0
Field Goals Made 50+
0
76
Total Kicking Points
50
10
Team Games Played
10
68
Touchback Percentage
40
0.0
Average Kickoff Return Yards
0.0
0
Kickoff Return Yards
0
0
Kickoff Returns
0
0-0
Kickoffs: Total
0-0
12-16
FG: Good-Attempts
10-15
Punting
42
Punts
53
1,839
Punt Yards
2,284
58
Long Punt
66
43.8
Gross Average Punt Yards
43.1
43.8
Net Average Punt Yards
43.1
0
Punts Blocked
0
19
Punts Inside 20
15
2
Touchbacks
1
14
Fair Catches
15
18
Punt Returns
18
0
Punt Return Yards
0
0.0
Average Punt Return Yards
0.0
10
Team Games Played
10
42-1,839
Punt: Total Yards
53-2,284
Scoring
26
Rushing Touchdowns
9
12
Receiving Touchdowns
14
0
Return Touchdowns
0
38
Total Touchdowns
24
12
Field Goals
10
40
Kick Extra Points
20
0
Total Two Point Conversions
2
324
Total Points
204
32.4
Total Points Per Game
20.4