

UConn vs Miami (OH) Live Score (26 Sep, 2026)
Score by Quarter
| Team | Q1 | Q2 | Q3 | Q4 | Final |
|---|---|---|---|---|---|
 UConn |
14 | 0 | 7 | 0 | 21 |
 Miami (OH) |
0 | 14 | 7 | 3 | 24 |
Scoring Plays
Q1
11:04
11:04
Javon Brown 7 Yd pass from Kalieb Osborne (Jack O'Connor Kick)
Passing Touchdown
7 – 0
Q1
6:23
6:23
Kalieb Osborne 38 Yd Run (Jack O'Connor Kick)
Rushing Touchdown
14 – 0
Q2
6:08
6:08
David McComb 10 Yd Run (Kellan McLaughlin Kick)
Rushing Touchdown
14 – 7
Q2
1:50
1:50
Brendan Loftus 57 Yd pass from David McComb (Kellan McLaughlin Kick)
Passing Touchdown
14 – 14
Q3
3:48
3:48
Scoop Smith 11 Yd pass from David McComb (Kellan McLaughlin Kick)
Passing Touchdown
14 – 21
Q3
0:49
0:49
Cyncir Bowers 1 Yd Run (Jack O'Connor Kick)
Rushing Touchdown
21 – 21
Q4
1:58
1:58
Brady Stidham 33 Yd Field Goal
Field Goal Good
21 – 24
Game Leaders
UConnMiami (OH)
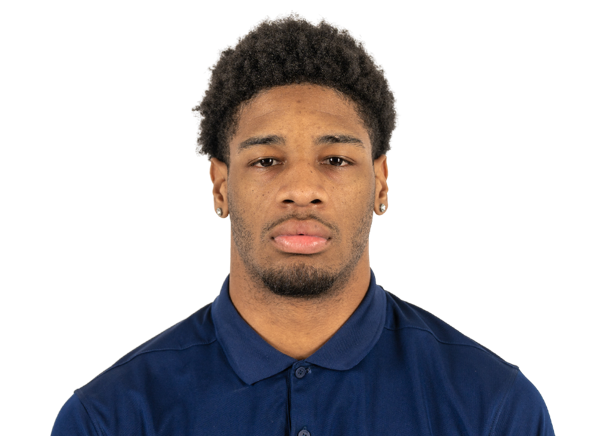 K. Osborne QB
Passing Yards
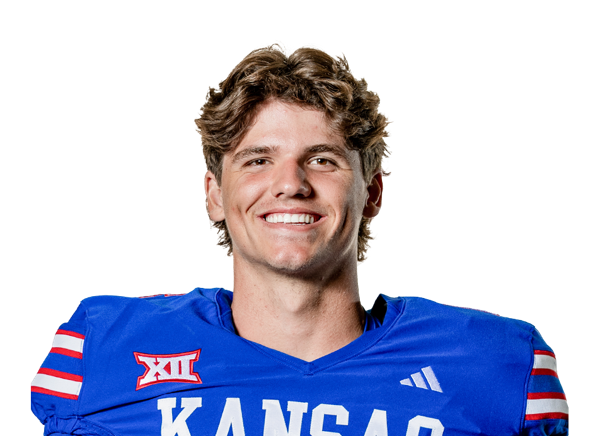 D. McComb QBK. Osborne QB
Rushing Yards
D. McComb QB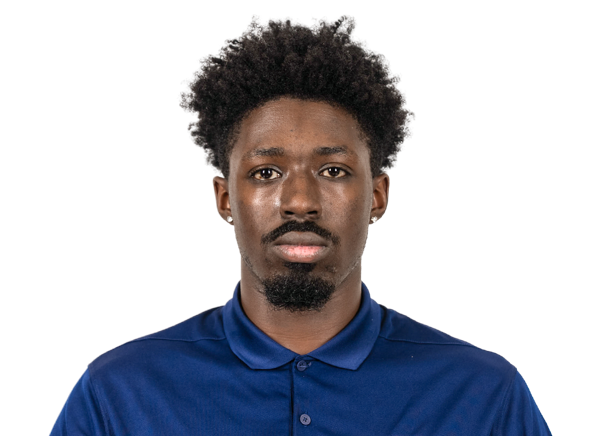 S. Porter WR
Receiving Yards
 B. Loftus TE
 K. Sherman LB
Sacks
 Z. Scott DL
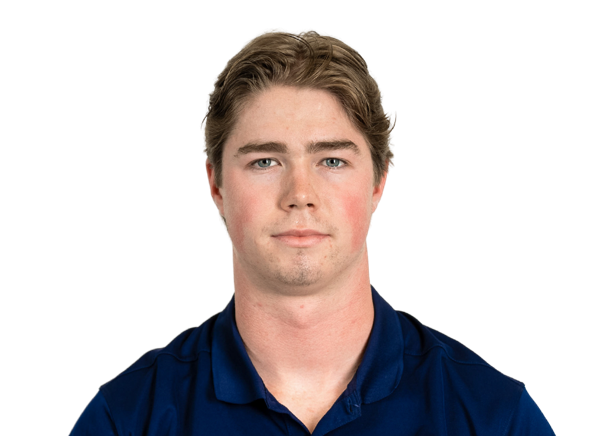 H. Pegg LB
Tackles
 M. McCain LB
Player Box Score
UConn| Player | C/ATT | YDS | AVG | TD | INT |
|---|---|---|---|---|---|
| Kalieb Osborne#7 | 17/32 | 215 | 6.7 | 1 | 1 |
Miami (OH)| Player | C/ATT | YDS | AVG | TD | INT |
|---|---|---|---|---|---|
| David McComb#16 | 19/29 | 312 | 10.8 | 2 | 0 |
| Caleb Heavner#6 | 3/3 | 13 | 4.3 | 0 | 0 |
UConn| Player | CAR | YDS | AVG | TD | LONG |
|---|---|---|---|---|---|
| Kalieb Osborne#7 | 13 | 84 | 6.5 | 1 | 38 |
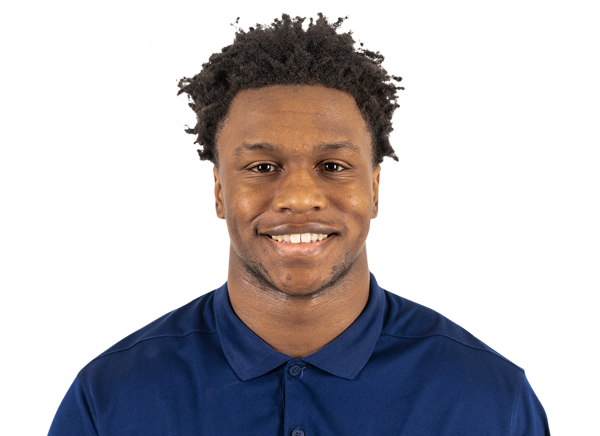 Cyncir Bowers#23 | 7 | 48 | 6.9 | 1 | 26 |
 Kenji Christian#3 | 6 | 26 | 4.3 | 0 | 8 |
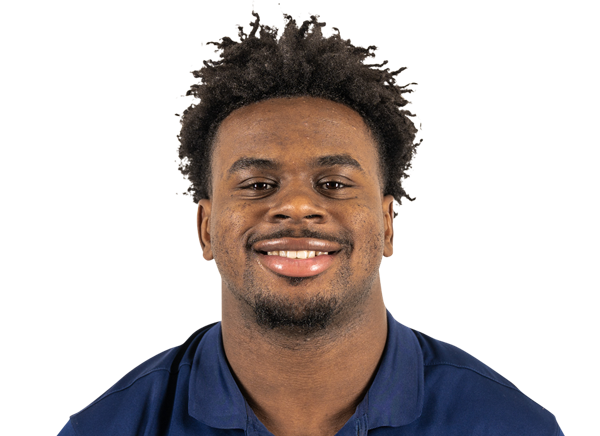 Trey Cornist#6 | 4 | 4 | 1.0 | 0 | 3 |
Miami (OH)| Player | CAR | YDS | AVG | TD | LONG |
|---|---|---|---|---|---|
| David McComb#16 | 3 | 33 | 11.0 | 1 | 32 |
 Rodney Nelson | 12 | 29 | 2.4 | 0 | 6 |
 Lazaro Rogers#21 | 6 | 15 | 2.5 | 0 | 7 |
| Scoop Smith#24 | 1 | 5 | 5.0 | 0 | 5 |
| Caleb Heavner#6 | 2 | 4 | 2.0 | 0 | 3 |
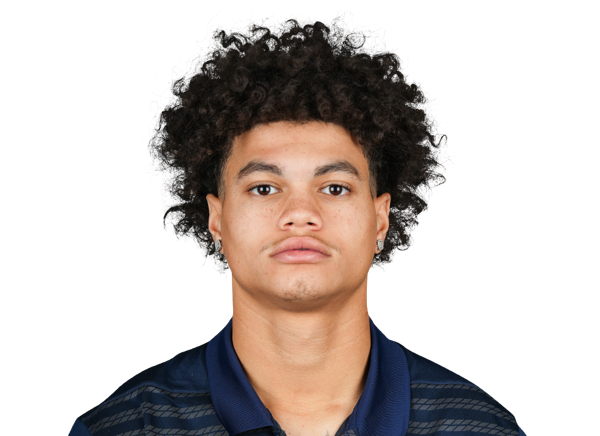 Devin Hyatt#4 | 1 | 2 | 2.0 | 0 | 2 |
 D'Shawntae Jones#9 | 3 | 2 | 0.7 | 0 | 3 |
| Team | 1 | -1 | -1.0 | 0 | 0 |
UConn| Player | REC | YDS | AVG | TD | LONG |
|---|---|---|---|---|---|
| Shamar Porter#5 | 2 | 61 | 30.5 | 0 | 53 |
 Javon Brown#19 | 4 | 44 | 11.0 | 1 | 20 |
 Matt Ragan#86 | 4 | 38 | 9.5 | 0 | 13 |
 Ryder Treadway#11 | 2 | 27 | 13.5 | 0 | 24 |
 Cam Abshire#14 | 1 | 25 | 25.0 | 0 | 25 |
| Cyncir Bowers#23 | 2 | 13 | 6.5 | 0 | 11 |
 JD Willoughby#2 | 1 | 4 | 4.0 | 0 | 4 |
| Kenji Christian#3 | 1 | 3 | 3.0 | 0 | 3 |
Miami (OH)| Player | REC | YDS | AVG | TD | LONG |
|---|---|---|---|---|---|
| Brendan Loftus#81 | 3 | 72 | 24.0 | 1 | 57 |
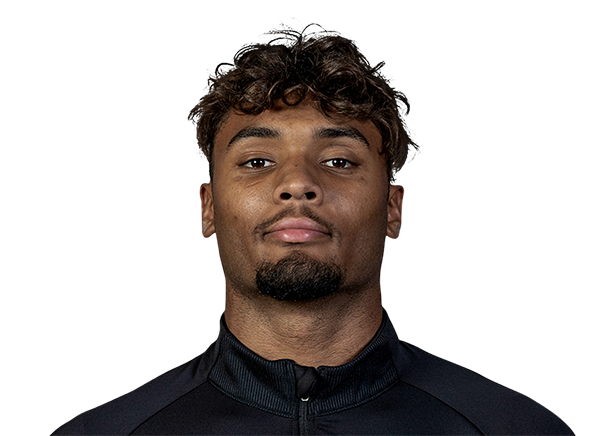 Braylon Isom#18 | 4 | 66 | 16.5 | 0 | 35 |
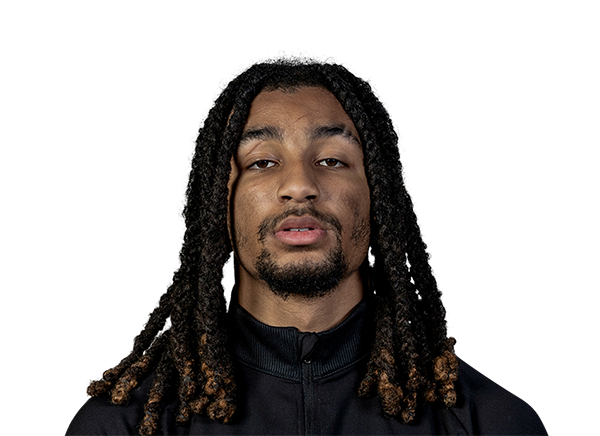 Lynel Billups-Williams#10 | 5 | 41 | 8.2 | 0 | 15 |
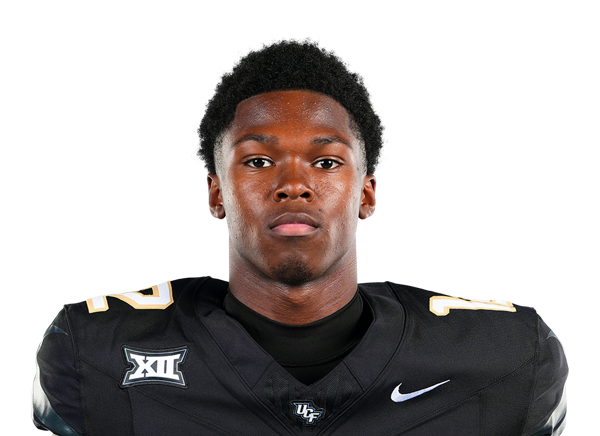 Carl Jenkins#2 | 1 | 38 | 38.0 | 0 | 38 |
| Scoop Smith#24 | 6 | 34 | 5.7 | 1 | 11 |
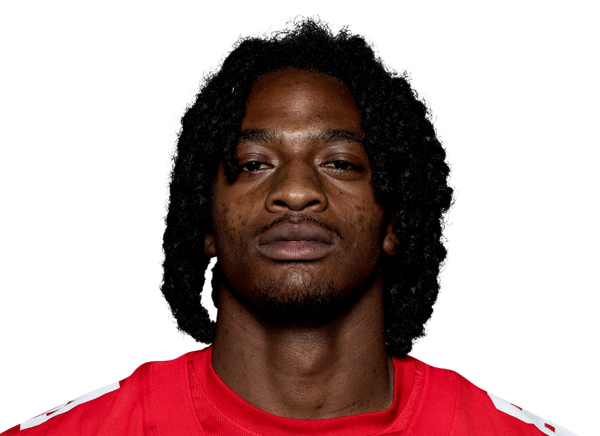 Damarion Witten#8 | 1 | 31 | 31.0 | 0 | 31 |
| Rodney Nelson | 1 | 23 | 23.0 | 0 | 23 |
 Maleek Huggins#1 | 1 | 20 | 20.0 | 0 | 20 |
UConn| Player | TOT | SOLO | SACKS | TFL | PD | QB HUR | TD |
|---|---|---|---|---|---|---|---|
| Hayden Pegg#37 | 8 | 0 | 0 | 0 | 1 | 0 | 0 |
 Braedyn Moore#4 | 7 | 3 | 0 | 0 | 0 | 0 | 0 |
 Jayden Price#13 | 5 | 5 | 0 | 0 | 0 | 0 | 0 |
 Tahjae Mullix#2 | 5 | 1 | 0 | 1 | 0 | 0 | 0 |
| K'Von Sherman | 4 | 2 | 1 | 2 | 0 | 0 | 0 |
 Anas Luqman#15 | 3 | 2 | 0 | 0 | 0 | 0 | 0 |
 John Lista#44 | 3 | 2 | 0 | 0 | 0 | 0 | 0 |
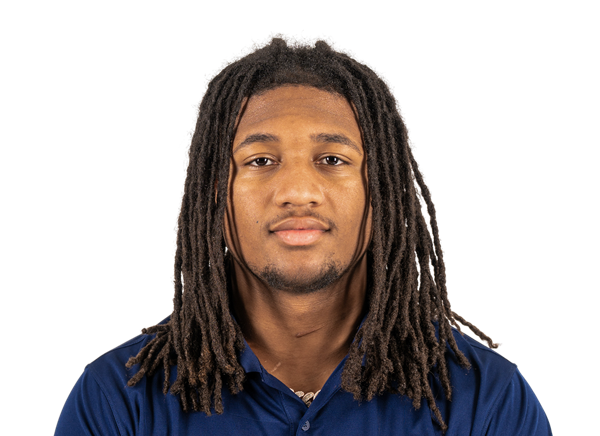 Zakaih Saez#9 | 3 | 2 | 0 | 0 | 0 | 0 | 0 |
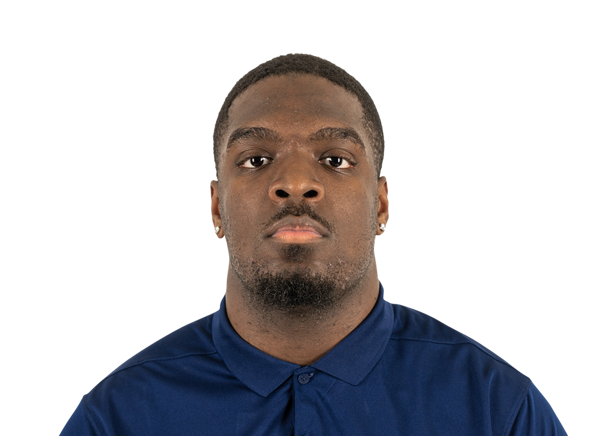 Desmond Aladuge#14 | 2 | 2 | 0 | 0 | 0 | 0 | 0 |
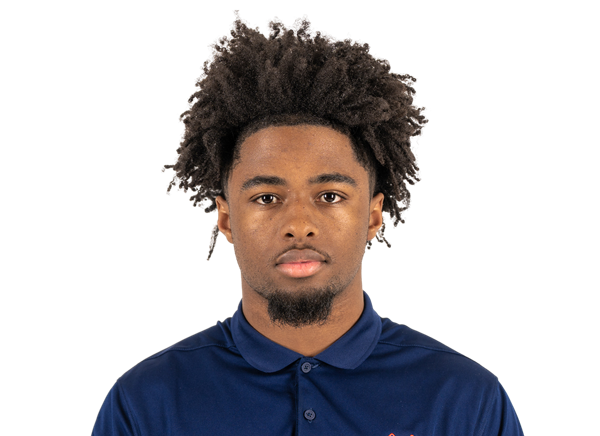 Ty McKinstry#7 | 2 | 2 | 0 | 0 | 0 | 0 | 0 |
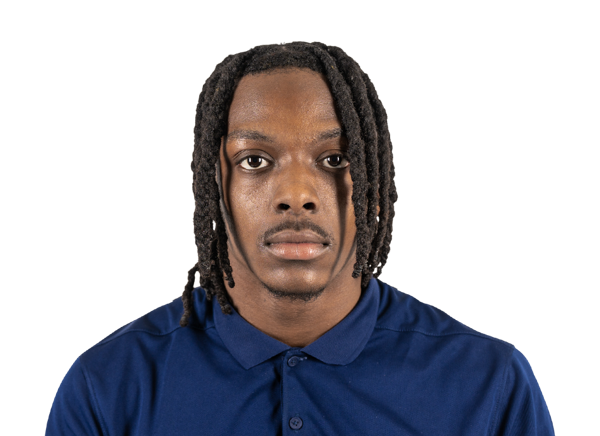 Renick Dorilas#6 | 2 | 2 | 0 | 1 | 0 | 0 | 0 |
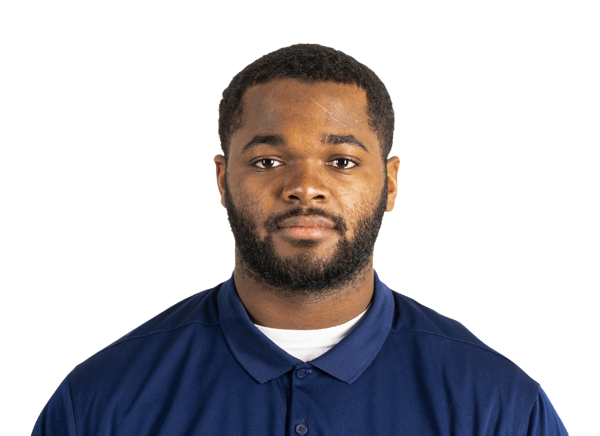 Esean Carter#3 | 2 | 1 | 0 | 1 | 0 | 1 | 0 |
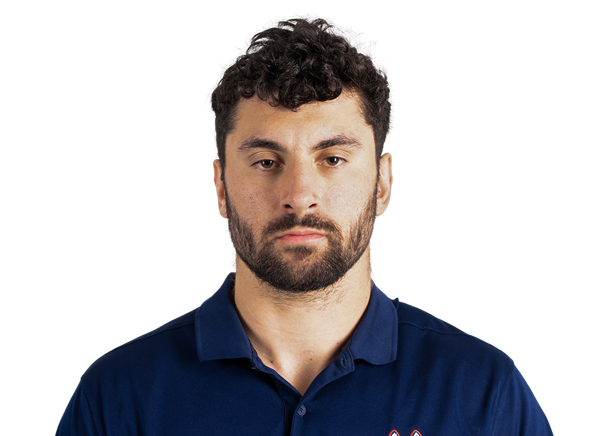 Luke Murphy#20 | 2 | 1 | 0 | 0 | 0 | 0 | 0 |
 Jayden Davis#10 | 2 | 1 | 0 | 0 | 0 | 0 | 0 |
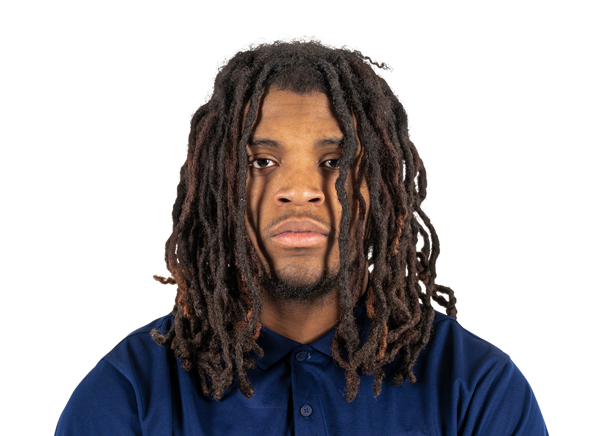 Rickey Williams#5 | 2 | 1 | 0 | 1 | 0 | 0 | 0 |
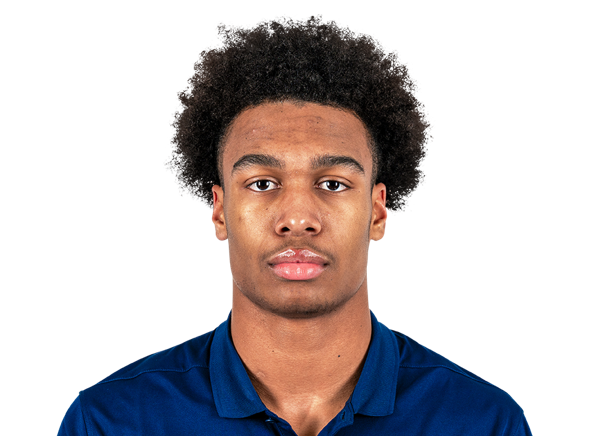 Saxton Suchanic#12 | 2 | 1 | 0 | 0 | 1 | 0 | 0 |
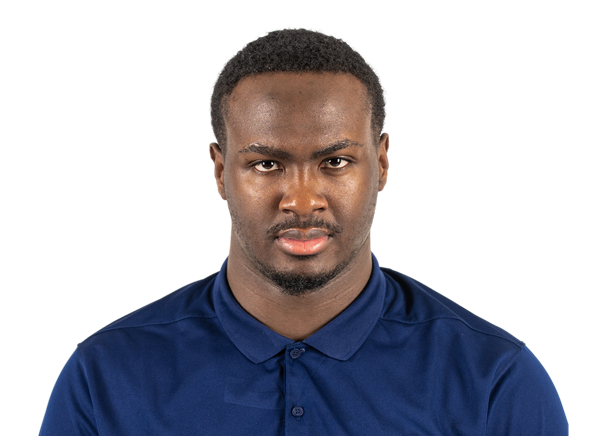 Joshua Mickens#52 | 1 | 1 | 0 | 0 | 0 | 0 | 0 |
 Jalil Martin#22 | 1 | 1 | 0 | 0 | 0 | 0 | 0 |
 Zy'marion Lang#8 | 1 | 1 | 0 | 1 | 0 | 0 | 0 |
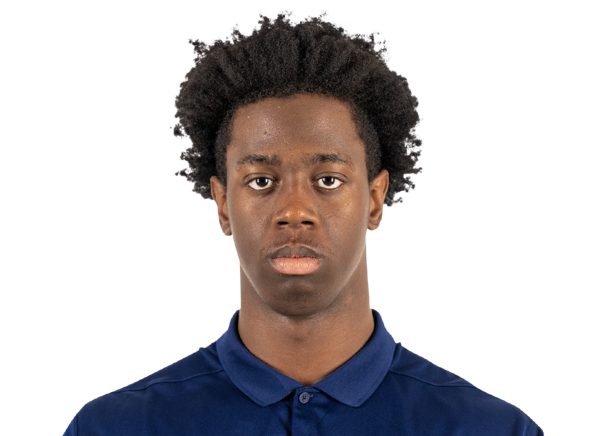 Chamberlain Campbell#97 | 1 | 1 | 0 | 0 | 0 | 0 | 0 |
 Melvin Hills III#95 | 1 | 1 | 0 | 0 | 0 | 0 | 0 |
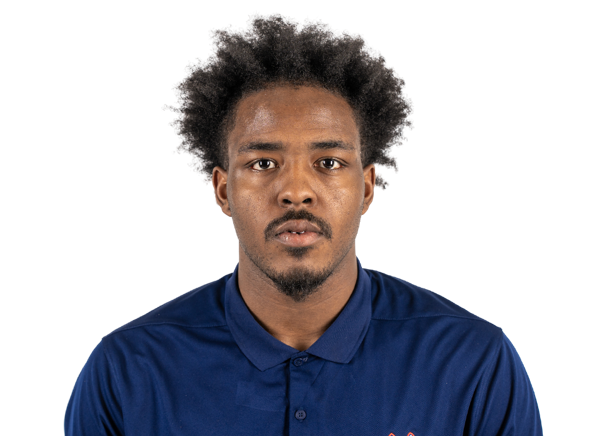 Shamar Riser-Pressley#17 | 1 | 1 | 0 | 0 | 0 | 0 | 0 |
Miami (OH)| Player | TOT | SOLO | SACKS | TFL | PD | QB HUR | TD |
|---|---|---|---|---|---|---|---|
| Malcolm McCain#3 | 9 | 5 | 0 | 0 | 0 | 0 | 0 |
 Blayne Myrick#15 | 5 | 4 | 0 | 0 | 0 | 0 | 0 |
 Kaleb Martin#12 | 4 | 4 | 0 | 0 | 1 | 0 | 0 |
 Dillon Tatum#1 | 4 | 3 | 0 | 0 | 0 | 0 | 0 |
 Grant Lyons#43 | 4 | 3 | 0 | 0 | 0 | 2 | 0 |
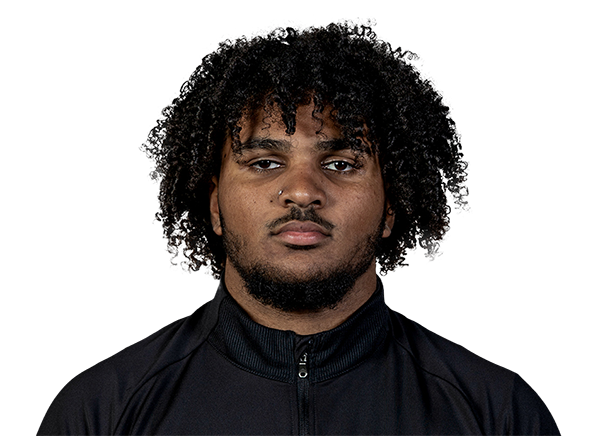 Roosevelt Andrews III#92 | 4 | 2 | 0.5 | 1 | 0 | 0 | 0 |
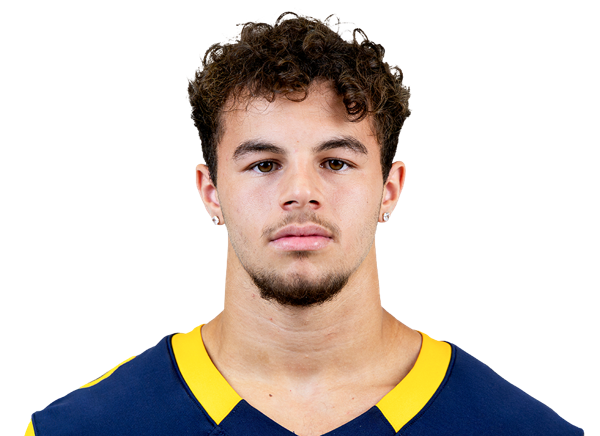 CJ Young#8 | 4 | 1 | 0 | 0.5 | 1 | 0 | 0 |
| Zhaiylen Scott#20 | 3 | 3 | 1 | 1 | 0 | 0 | 0 |
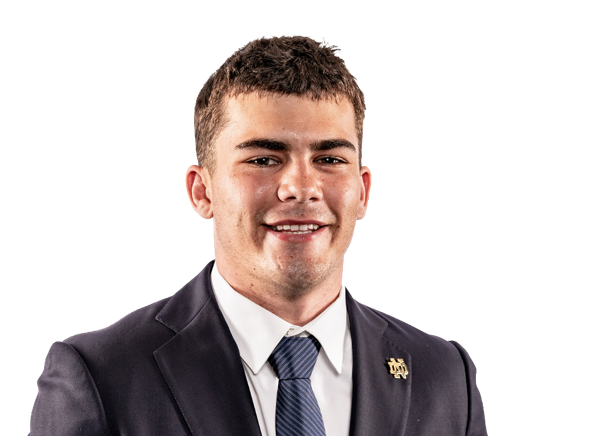 Ben Minich#17 | 3 | 3 | 0 | 0 | 0 | 0 | 0 |
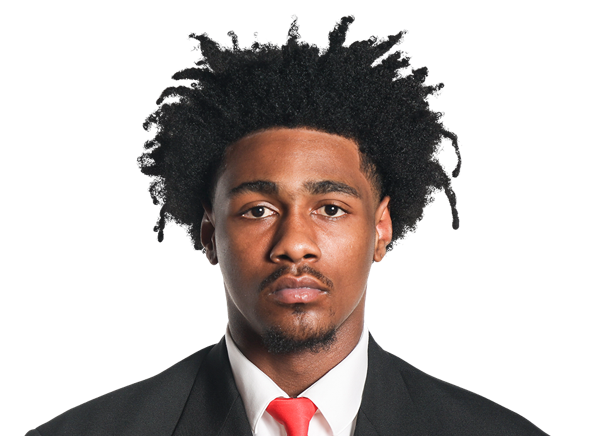 Amariyun Knighten | 2 | 2 | 0 | 0 | 0 | 0 | 0 |
 Eli Coppess#26 | 2 | 1 | 0 | 0 | 0 | 0 | 0 |
| Desmon Yharbrough#13 | 2 | 1 | 0 | 0 | 0 | 0 | 0 |
 Tyler Dikos#35 | 1 | 1 | 0 | 0 | 0 | 0 | 0 |
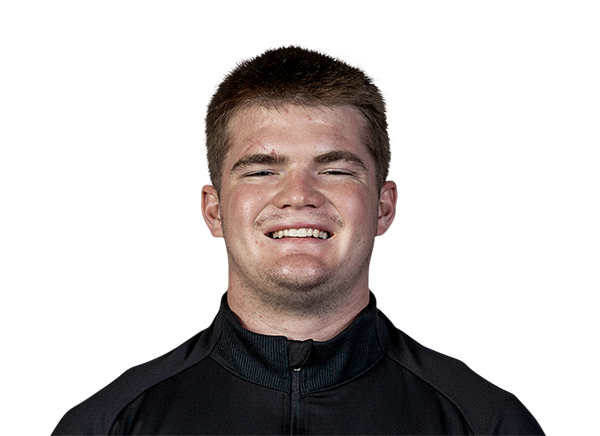 Brach Rice#4 | 1 | 1 | 0 | 0 | 0 | 0 | 0 |
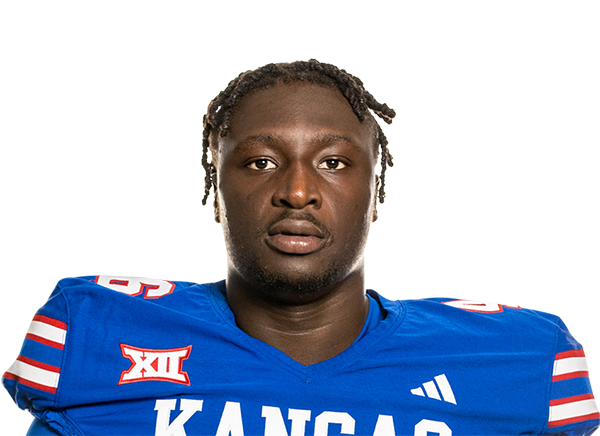 Bai Jobe#22 | 1 | 0 | 0 | 0 | 0 | 0 | 0 |
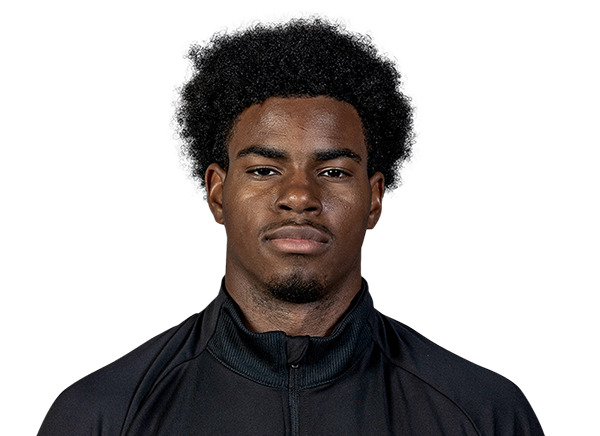 Mychal Yharbrough#24 | 1 | 0 | 0 | 0 | 0 | 0 | 0 |
 Kellan McLaughlin#38 | 1 | 0 | 0 | 0 | 0 | 0 | 0 |
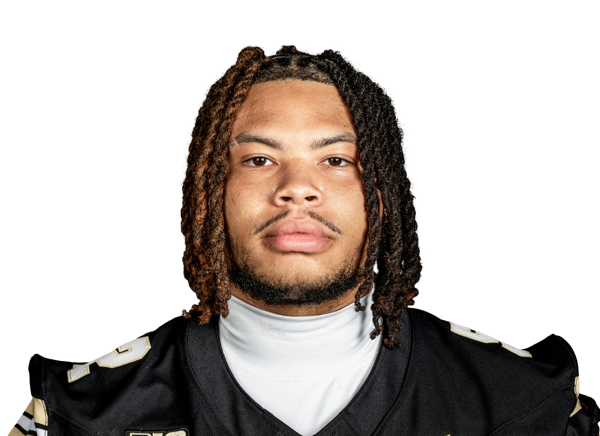 Marcus Moore#52 | 1 | 0 | 0.5 | 0.5 | 0 | 0 | 0 |
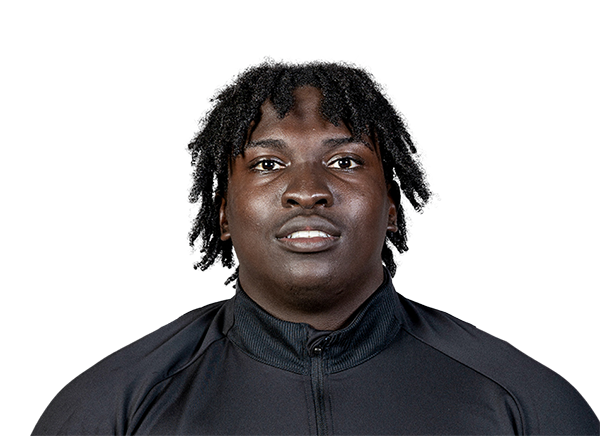 OJ Alexander#99 | 0 | 0 | 0 | 0 | 0 | 1 | 0 |
UConn| Player | FUM | LOST | REC |
|---|---|---|---|
| Kalieb Osborne#7 | 1 | 1 | 0 |
| Zy'marion Lang#8 | 0 | 0 | 1 |
Miami (OH)| Player | FUM | LOST | REC |
|---|---|---|---|
| Amariyun Knighten | 1 | 1 | 1 |
UConn| Player | FG | PCT | LONG | XP | PTS |
|---|---|---|---|---|---|
 Jack O'Connor#9 | 0/1 | 0.0 | 0 | 3/3 | 3 |
Miami (OH)| Player | FG | PCT | LONG | XP | PTS |
|---|---|---|---|---|---|
| Kellan McLaughlin#38 | 0/2 | 0.0 | 0 | 3/3 | 3 |
| Brady Stidham#31 | 1/1 | 100.0 | 33 | 0/0 | 3 |
UConn| Player | NO | YDS | AVG | TB | In 20 | LONG |
|---|---|---|---|---|---|---|
 Tommy Warner#49 | 4 | 159 | 39.8 | 0 | 3 | 48 |
Miami (OH)| Player | NO | YDS | AVG | TB | In 20 | LONG |
|---|---|---|---|---|---|---|
 Pierse Stainton#34 | 2 | 89 | 44.5 | 1 | 1 | 45 |
UConn| Player | NO | YDS | AVG | LONG | TD |
|---|---|---|---|---|---|
| Kenji Christian#3 | 1 | 32 | 32.0 | 32 | 0 |
 Julian Allen#9 | 1 | 8 | 8.0 | 8 | 0 |
Miami (OH)| Player | INT | YDS | TD |
|---|---|---|---|
| CJ Young#8 | 1 | 0 | 0 |
Drive Summary
CONN
Touchdown
75
M-OH
Punt
4
CONN
Touchdown
84
M-OH
Downs
48
CONN
Fumble
8
CONN
Punt
28
M-OH
Touchdown
90
CONN
Punt
32
M-OH
Touchdown
87
M-OH
Touchdown
57
CONN
Missed FG
47
M-OH
Missed FG
49
CONN
Punt
9
M-OH
Touchdown
83
CONN
Touchdown
64
M-OH
Missed FG
48
CONN
Punt
-2
M-OH
Punt
8
CONN
Interception
0
M-OH
Field Goal
28
CONN
Downs
37
M-OH
End of Game
-1
Injury Report
No current injury report is available for this matchup.
Head-to-Head
Historical meetings are not available for this matchup.
Game Information
StageWeek 4
Season2026
KickoffSat, Sep 26, 3:30 pm
VenueYager Stadium
LocationOxford, OH
SurfaceArtificial Turf
BroadcastESPN+
Attendance18,180
Division Standings
FBS — FBS Independents
| Team | W | L | T | Pct | PF | PA | Home | Away | Strk |
|---|---|---|---|---|---|---|---|---|---|
 Notre Dame | 9 | 1 | 0 | 0.900 | 395 | 138 | 6-0 | 3-1 | W3 |
| UConn | 5 | 5 | 0 | 0.500 | 342 | 262 | 3-3 | 2-2 | W1 |
FBS — Mid-American Conference
| Team | W | L | T | Pct | PF | PA | Home | Away | Strk |
|---|---|---|---|---|---|---|---|---|---|
 Kent State | 3 | 8 | 0 | 0.273 | 160 | 328 | 3-2 | 0-6 | L3 |
 Eastern Michigan | 4 | 7 | 0 | 0.364 | 226 | 300 | 2-3 | 2-4 | L4 |
 Massachusetts | 5 | 6 | 0 | 0.455 | 276 | 257 | 3-3 | 2-3 | L2 |
 Toledo | 8 | 2 | 0 | 0.800 | 343 | 220 | 5-1 | 3-1 | W4 |
 Central Michigan | 5 | 6 | 0 | 0.455 | 227 | 261 | 4-2 | 1-4 | L1 |
 Buffalo | 8 | 3 | 0 | 0.727 | 283 | 262 | 5-1 | 3-2 | W6 |
| Miami (OH) | 7 | 4 | 0 | 0.636 | 301 | 260 | 4-2 | 3-2 | W2 |
 Ohio | 8 | 3 | 0 | 0.727 | 317 | 257 | 5-0 | 3-3 | W1 |
 Western Michigan | 8 | 3 | 0 | 0.727 | 312 | 214 | 4-1 | 4-2 | W3 |
 Akron | 2 | 9 | 0 | 0.182 | 220 | 365 | 1-4 | 1-5 | W1 |
 Bowling Green | 3 | 7 | 0 | 0.300 | 193 | 289 | 2-3 | 1-4 | W1 |
 Ball State | 3 | 8 | 0 | 0.273 | 241 | 376 | 2-2 | 1-6 | L3 |
 Sacramento State | 2 | 9 | 0 | 0.182 | 177 | 321 | 2-4 | 0-5 | L2 |
UConn
2nd in FBS Indep.
VS
Miami (OH)
5th in MAC
Quarterbacks & Specialists
#7
Kalieb Osborne
#49
Tommy Warner
Receivers & Backs
#14
Cam Abshire
#9
Julian Allen
#23
Cyncir Bowers
#19
Javon Brown
#3
Kenji Christian
#6
Trey Cornist
#8
Zy'marion Lang
#5
Shamar Porter
#86
Matt Ragan
#11
Ryder Treadway
#2
JD Willoughby
Defensive Line & Linebackers
#14
Desmond Aladuge
#97
Chamberlain Campbell
#3
Esean Carter
#95
Melvin Hills III
#44
John Lista
#15
Anas Luqman
#52
Joshua Mickens
#2
Tahjae Mullix
#20
Luke Murphy
#37
Hayden Pegg
#17
Shamar Riser-Pressley
#9
Zakaih Saez
K'Von Sherman
#5
Rickey Williams
Defensive Backs
#10
Jayden Davis
#6
Renick Dorilas
#22
Jalil Martin
#7
Ty McKinstry
#4
Braedyn Moore
#13
Jayden Price
#12
Saxton Suchanic
Other
#9
Jack O'Connor
Quarterbacks & Specialists
#6
Caleb Heavner
#16
David McComb
#34
Pierse Stainton
Receivers & Backs
#10
Lynel Billups-Williams
#1
Maleek Huggins
#4
Devin Hyatt
#18
Braylon Isom
#2
Carl Jenkins
#9
D'Shawntae Jones
#81
Brendan Loftus
Rodney Nelson
#21
Lazaro Rogers
#24
Scoop Smith
#8
Damarion Witten
Defensive Line & Linebackers
#99
OJ Alexander
#92
Roosevelt Andrews III
#26
Eli Coppess
#35
Tyler Dikos
#22
Bai Jobe
#43
Grant Lyons
#3
Malcolm McCain
#52
Marcus Moore
#15
Blayne Myrick
#4
Brach Rice
#20
Zhaiylen Scott
#8
CJ Young
Defensive Backs
Amariyun Knighten
#12
Kaleb Martin
#17
Ben Minich
#1
Dillon Tatum
#13
Desmon Yharbrough
#24
Mychal Yharbrough
Other
#38
Kellan McLaughlin
#31
Brady Stidham
UConn
VS
Miami (OH)
5th in MAC
Passing
59.2
Completion Percentage
56.3
155
Completions
143
1.90
Interception Percentage
2.00
5
Interceptions
5
60
Longest Pass
75
2,220
Net Passing Yards
2,043
246.7
Net Passing Yards Per Game
204.3
262
Passing Attempts
254
6.50
Passing Touchdown %
4.70
17
Passing Touchdowns
12
148.2
Passer Rating
135.1
28
Total Sacks
26
162
Sack Yards Lost
183
8.5
Yards Per Pass Attempt
8.0
2,220
Passing Yards
2,043
0
Passing Fumbles Lost
0
9
Team Games Played
10
429.9
Yards Per Game
357.6
32.9
Total Points Per Game
28.1
296
Total Points
281
41
Total Touchdowns
34
246.7
Passing Yards Per Game
204.3
155-262
Comp-Att
143-254
28-162
Sacks-Yards Lost
26-183
Rushing
318
Rushing Attempts
340
1,649
Rushing Yards
1,533
5.2
Yards Per Rush Attempt
4.5
71
Long Rushing
69
0
20+ Yard Rushing Plays
0
22
Rushing Touchdowns
17
183.2
Rushing Yards Per Game
153.3
0
Rushing Fumbles
0
0
Rushing Fumbles Lost
0
71
Rushing 1st downs
86
9
Team Games Played
10
3,869
Total Yards
3,576
608
Total Offensive Plays
620
32.9
Total Points Per Game
28.1
296
Total Points
281
41
Total Touchdowns
34
Receiving
155
Receptions
143
0
Receiving Targets
0
2,220
Receiving Yards
2,043
2,220
Receiving Yards
2,043
17
Receiving Touchdowns
12
60
Long Reception
75
0
20+ Yard Receiving Plays
0
246.7
Receiving Yards Per Game
204.3
0
Receiving Fumbles
0
0
Receiving Fumbles Lost
0
870
Receiving Yards After Catch
819
99
Receiving First Downs
85
9
Team Games Played
10
14.3
Yards Per Reception
14.3
32.9
Total Points Per Game
28.1
296
Total Points
281
41
Total Touchdowns
34
Miscellaneous
191
Total 1st downs
193
71
Rushing 1st downs
86
100
Passing 1st downs
85
19
1st downs by penalty
22
45
Third Down Conversions
41
111
Third Down Attempts
121
40.54
3rd down %
33.88
8
Fourth Down Conversions
8
21
First Downs Attempts
11
38.10
4th down %
72.73
71
Total Penalties
73
647
Total Penalty Yards
649
14727
Possession Time Seconds
18142
0.00
Red Zone Field Goal Percentage
0.00
0.00
Red Zone Scoring Percentage
0.00
0.00
Red Zone Efficiency Percentage
0.00
0.00
Red Zone Touchdown Percentage
0.00
11
Total Takeaways
10
10
Total Giveaways
8
1
Turnover Ratio
2
0
Fumbles Lost
0
45-111
3rd down efficiency
41-121
8-21
4th down efficiency
8-11
71-647
Total-Yards
73-649
Defense
310
Solo Tackles
313
368
Assist Tackles
322
678
Total Tackles
635
15
Sacks
21
72
Sack Yards
123
54
Stuffs
75
43
Passes Defended
40
15.4
Average Interception Yards
17.6
29
Long Interception
58
0
Miscellaneous Touchdowns
0
2
Kicks Blocked
2
32
Tackles For Loss
31
9
Team Games Played
10
Defensive Interceptions
5
Interceptions
8
77
Interception Yards
141
1
Interception Touchdowns
2
5-77
INT: Total
8-141
General
11
Fumbles
9
6
Forced Fumbles
6
6
Fumbles Recovered
5
0
Fumbles Touchdowns
0
9
Games Played
10
11-0
Fumbles-Lost
9-0
Returning
18
Kick Returns
18
390
Kick Return Yards
403
21.7
Yards Per Kick Return
22.4
48
Long Kick Return
98
0
Kick Return Touchdowns
1
10
Punt Returns
14
97
Punt Return Yards
141
9.7
Yards Per Punt Return
10.1
49
Long Punt Return
38
1
Punt Return Touchdowns
2
0
Punt Return Fair Catches
0
0
Kick Return Fumbles Lost
0
0
Punt Return Fumbles Lost
0
9
Team Games Played
10
10-97
Punt: Total
14-141
Kicking
4
Field Goal Made
14
8
Field Goal Attempts
20
50.0
Field Goal Percentage
70.0
46
Long Field Goal Made
47
0
Field Goal Attempts 1-19
1
3
Field Goal Attempts 20-29
7
0
Field Goal Attempts 30-39
4
5
Field Goal Attempts 40-49
8
0
Field Goal Attempts 50+
0
38
Extra Points Made
33
40
Extra Point Attempts
33
95.0
Extra Point Percentage
100.0
0
Field Goals Made 1-19
1
3
Field Goals Made 20-29
7
0
Field Goals Made 30-39
3
1
Field Goals Made 40-49
3
0
Field Goals Made 50+
0
50
Total Kicking Points
75
9
Team Games Played
10
69
Touchback Percentage
60
0.0
Average Kickoff Return Yards
0.0
0
Kickoff Return Yards
0
0
Kickoff Returns
0
0-0
Kickoffs: Total
0-0
4-8
FG: Good-Attempts
14-20
Punting
32
Punts
47
1,379
Punt Yards
2,072
56
Long Punt
68
43.1
Gross Average Punt Yards
44.1
43.1
Net Average Punt Yards
44.1
0
Punts Blocked
0
13
Punts Inside 20
23
1
Touchbacks
9
14
Fair Catches
25
3
Punt Returns
7
0
Punt Return Yards
0
0.0
Average Punt Return Yards
0.0
9
Team Games Played
10
32-1,379
Punt: Total Yards
47-2,072
Scoring
22
Rushing Touchdowns
17
17
Receiving Touchdowns
12
1
Return Touchdowns
3
40
Total Touchdowns
32
4
Field Goals
14
38
Kick Extra Points
33
0
Total Two Point Conversions
1
296
Total Points
281
32.9
Total Points Per Game
28.1