

UNLV vs Hawai'i Live Score (6 Sep, 2026)
Score by Quarter
| Team | Q1 | Q2 | Q3 | Q4 | Final |
|---|---|---|---|---|---|
 UNLV | 7 | 7 | 0 | 7 | 21 |
 Hawai'i | 0 | 3 | 3 | 0 | 6 |
Scoring Plays
Q1
9:33
9:33
J. Arnold run for 7 yds, for a TD (R. Villela KICK)
Rushing Touchdown
7 – 0
Q2
14:09
14:09
S. Olvera-Harle 39 yd FG GOOD
Field Goal Good
7 – 3
Q2
1:33
1:33
J. Arnold run for 2 yds, for a TD (R. Villela KICK)
Rushing Touchdown
14 – 3
Q3
1:32
1:32
S. Olvera-Harle 33 yd FG GOOD
Field Goal Good
14 – 6
Q4
4:51
4:51
J. Thomas run for 50 yds, for a TD (R. Villela KICK)
Rushing Touchdown
21 – 6
Game Leaders
UNLVHawai'i
 J. Arnold QB
Passing Yards
 M. Alejado QB
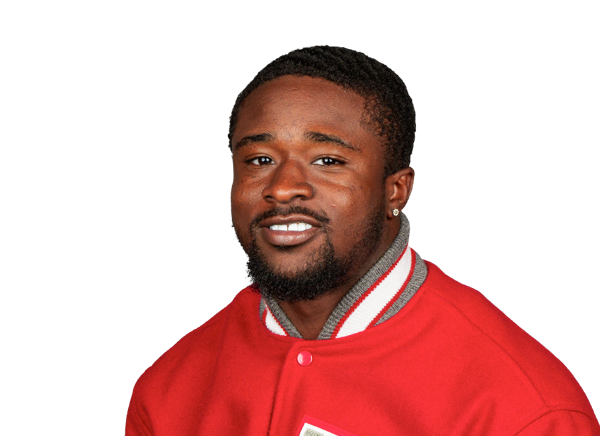 J. Thomas RB
Rushing Yards
 D. Rice RB
 K. Burnett TE
Receiving Yards
D. Rice RB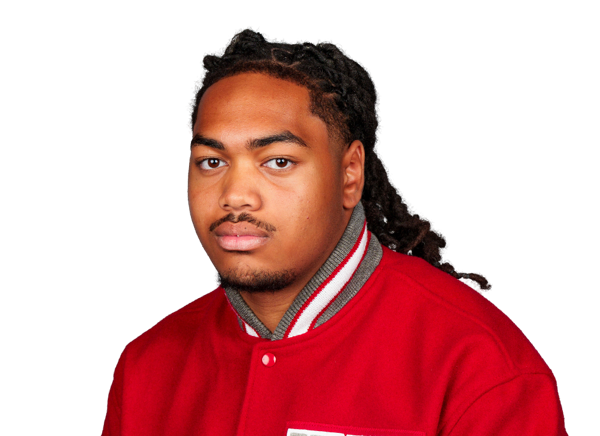 K. Togafau DL
Sacks
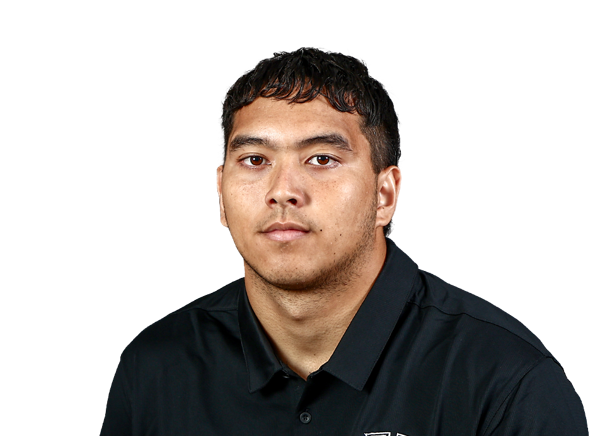 K. Akana DL
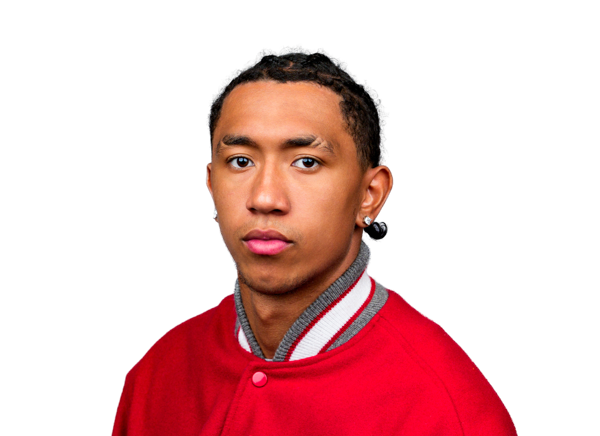 T. Fulton DB
Tackles
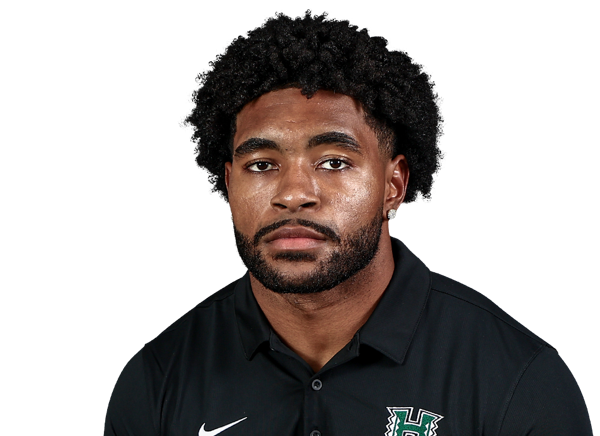 J. Otis LB
Player Box Score
UNLV| Player | C/ATT | YDS | AVG | TD | INT |
|---|---|---|---|---|---|
| Jackson Arnold#11 | 8/18 | 116 | 6.4 | 0 | 0 |
Hawai'i| Player | C/ATT | YDS | AVG | TD | INT |
|---|---|---|---|---|---|
| Micah Alejado#12 | 17/41 | 176 | 4.3 | 0 | 1 |
 Bjorn Jurgensen#10 | 0/2 | 0 | 0.0 | 0 | 0 |
UNLV| Player | CAR | YDS | AVG | TD | LONG |
|---|---|---|---|---|---|
| Jai'Den Thomas#9 | 20 | 143 | 7.2 | 1 | 50 |
| Jackson Arnold#11 | 16 | 89 | 5.6 | 2 | 17 |
 Jaylon Glover | 5 | 16 | 3.2 | 0 | 8 |
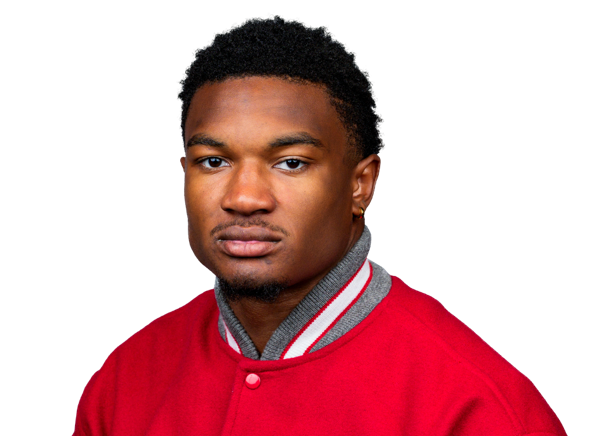 Alex Orji#1 | 1 | 2 | 2.0 | 0 | 2 |
 Team | 1 | -2 | -2.0 | 0 | 2 |
Hawai'i| Player | CAR | YDS | AVG | TD | LONG |
|---|---|---|---|---|---|
| DeVon Rice#1 | 15 | 73 | 4.9 | 0 | 16 |
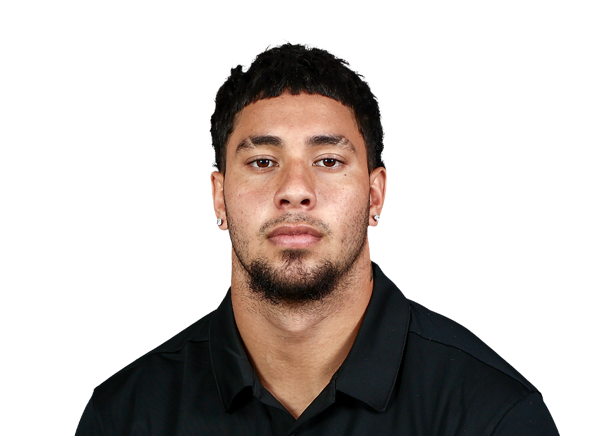 Sitani Mikaele#26 | 9 | 39 | 4.3 | 0 | 11 |
| Micah Alejado#12 | 9 | 6 | 0.7 | 0 | 15 |
UNLV| Player | REC | YDS | AVG | TD | LONG |
|---|---|---|---|---|---|
| Keyan Burnett#84 | 3 | 55 | 18.3 | 0 | 25 |
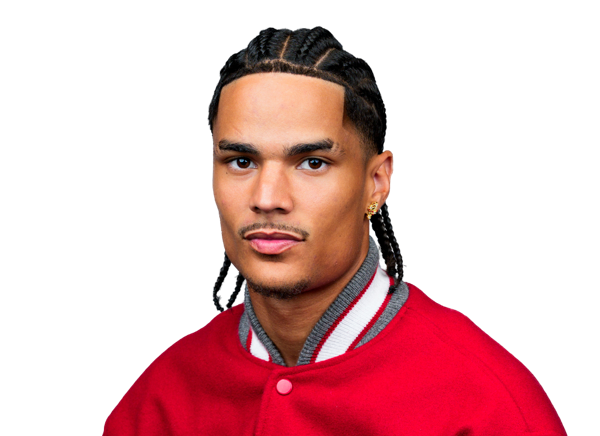 Kayden McGee#6 | 1 | 44 | 44.0 | 0 | 44 |
 Taeshaun Lyons#8 | 2 | 11 | 5.5 | 0 | 6 |
 Velltray Jefferson#88 | 1 | 8 | 8.0 | 0 | 8 |
| Jai'Den Thomas#9 | 1 | -2 | -2.0 | 0 | 0 |
Hawai'i| Player | REC | YDS | AVG | TD | LONG |
|---|---|---|---|---|---|
| DeVon Rice#1 | 4 | 27 | 6.8 | 0 | 16 |
 Kainoa Carvalho#6 | 1 | 26 | 26.0 | 0 | 26 |
 Josiah Fetui#83 | 2 | 24 | 12.0 | 0 | 12 |
 Blaze Kamoku#18 | 3 | 24 | 8.0 | 0 | 12 |
 Nick Delgadillo#17 | 2 | 23 | 11.5 | 0 | 14 |
 Devin Alves#11 | 1 | 19 | 19.0 | 0 | 19 |
 Audric Harris#2 | 1 | 16 | 16.0 | 0 | 16 |
 Titan Lacaden#22 | 2 | 9 | 4.5 | 0 | 7 |
 Carson Brown#3 | 1 | 8 | 8.0 | 0 | 8 |
UNLV| Player | TOT | SOLO | SACKS | TFL | PD | QB HUR | TD |
|---|---|---|---|---|---|---|---|
| Tre Fulton#10 | 12 | 8 | 1 | 1 | 1 | 0 | 0 |
 Kamuela Ka'aihue#8 | 9 | 5 | 0 | 0.5 | 0 | 0 | 0 |
 Jake Pope#7 | 6 | 2 | 0 | 0 | 0 | 1 | 0 |
 Quandarius Keyes#5 | 5 | 3 | 0 | 0 | 1 | 1 | 0 |
 Tony-Louis Nkuba#4 | 4 | 4 | 0 | 0 | 1 | 0 | 0 |
 Lucas Conti#94 | 3 | 2 | 0 | 1.5 | 0 | 1 | 0 |
| Kal-El Togafau#44 | 2 | 2 | 2 | 2 | 0 | 0 | 0 |
 Kenji Scanlan#32 | 2 | 2 | 1 | 1 | 0 | 0 | 0 |
 Denver Harris#2 | 2 | 2 | 0 | 0 | 0 | 0 | 0 |
 Landyn Cleveland#20 | 2 | 2 | 0 | 0 | 0 | 0 | 0 |
 Blesyng Alualu-Tuiolemotu#15 | 2 | 1 | 0 | 0 | 0 | 0 | 0 |
 Elias Rudolph#91 | 1 | 1 | 1 | 1 | 0 | 0 | 0 |
 Avery Helm#24 | 1 | 1 | 0 | 0 | 0 | 0 | 0 |
 Dee Crayton#3 | 1 | 1 | 0 | 0 | 1 | 0 | 0 |
 Cam Santee#23 | 1 | 1 | 0 | 0 | 0 | 0 | 0 |
 Joshua Tuchek#21 | 1 | 1 | 0 | 0 | 0 | 0 | 0 |
 Mumu Bin-Wahad#1 | 0 | 0 | 0 | 0 | 1 | 0 | 0 |
 Andre Porter#42 | 0 | 0 | 0 | 0 | 2 | 1 | 0 |
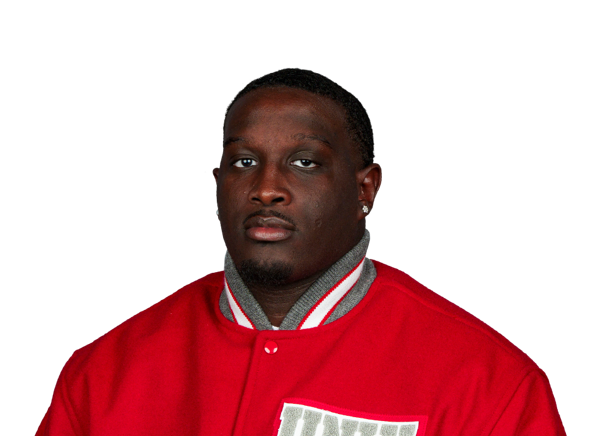 Mohamed Altayeb#16 | 0 | 0 | 0 | 0 | 0 | 1 | 0 |
Hawai'i| Player | TOT | SOLO | SACKS | TFL | PD | QB HUR | TD |
|---|---|---|---|---|---|---|---|
| Jamih Otis#11 | 12 | 7 | 0 | 0 | 0 | 0 | 0 |
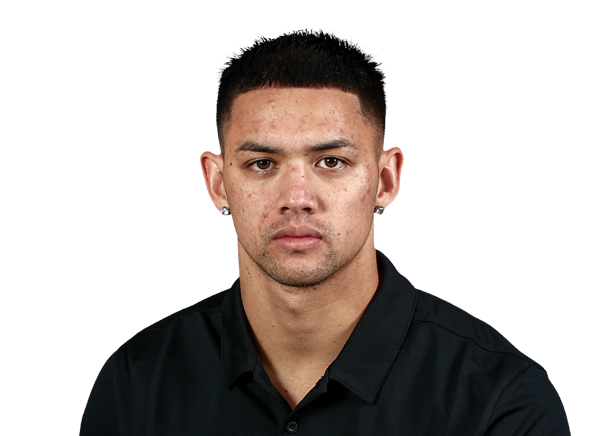 Kona Moore#2 | 10 | 6 | 0 | 0 | 1 | 0 | 0 |
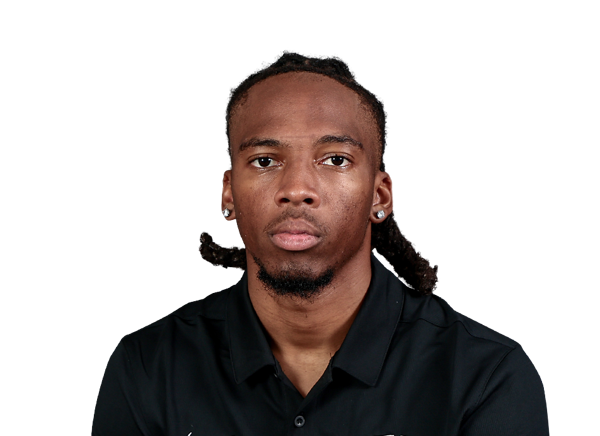 Jeremiah Hughes | 4 | 4 | 0 | 0 | 0 | 0 | 0 |
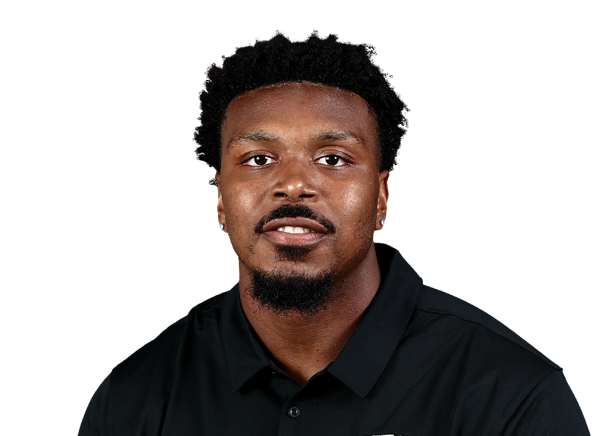 Geoffrey Speight Jr.#95 | 4 | 2 | 0 | 0 | 0 | 0 | 0 |
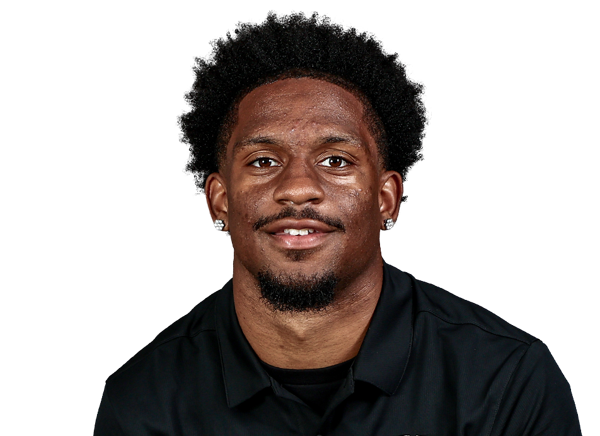 Jaylon Edmond#5 | 4 | 2 | 0 | 0 | 0 | 0 | 0 |
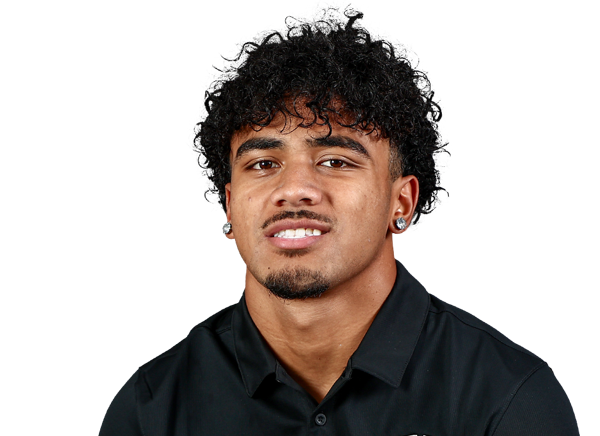 Aisiah Paogofie#31 | 3 | 2 | 0 | 1 | 0 | 0 | 0 |
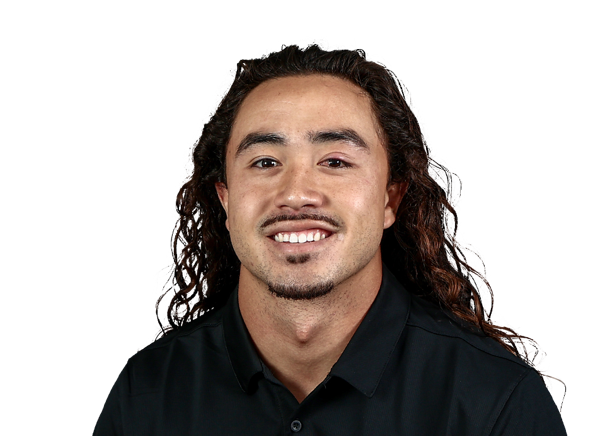 Matagi Thompson#25 | 3 | 1 | 0 | 0 | 2 | 0 | 0 |
| Ka'eo Akana#10 | 2 | 1 | 1 | 1 | 0 | 0 | 0 |
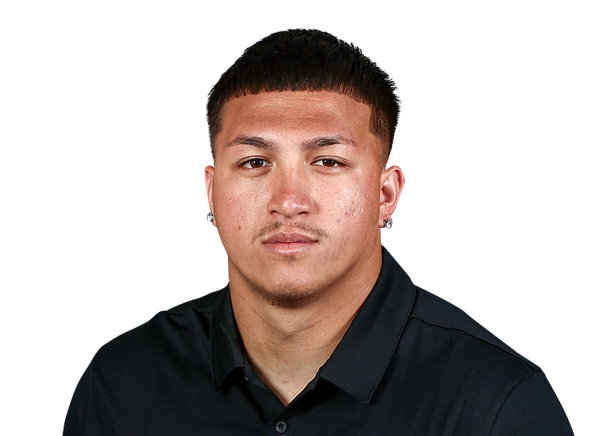 Wynden Ho'ohuli#12 | 2 | 1 | 0 | 0.5 | 0 | 0 | 0 |
 Ozzy Pollard#99 | 2 | 1 | 0 | 0.5 | 0 | 0 | 0 |
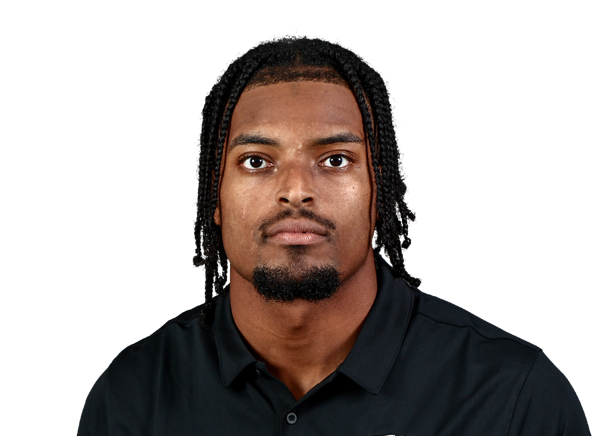 Luther McCoy#52 | 2 | 0 | 0 | 0 | 2 | 0 | 0 |
 Elijah Palmer#4 | 1 | 1 | 0 | 0 | 0 | 0 | 0 |
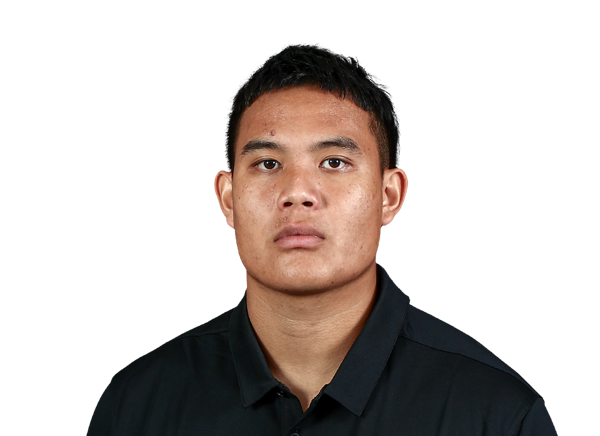 Ha'aheo Dela Cruz#90 | 1 | 1 | 0 | 0 | 0 | 0 | 0 |
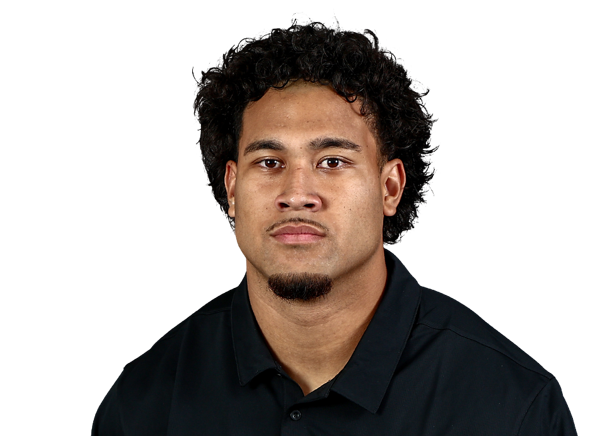 Iosefa Letuli#96 | 1 | 1 | 0 | 0 | 0 | 0 | 0 |
 Adam Tomczyk#9 | 1 | 0 | 0 | 0 | 0 | 0 | 0 |
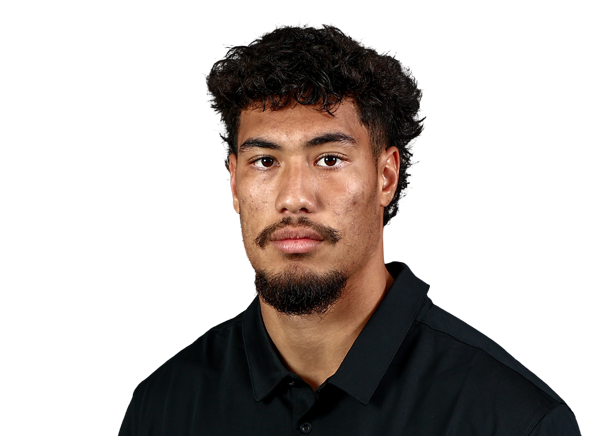 Zaden Mariteragi#18 | 1 | 0 | 0 | 0 | 0 | 0 | 0 |
 Jordan Lynch#97 | 1 | 0 | 0 | 0 | 0 | 0 | 0 |
 Josh Sagapolutele#91 | 0 | 0 | 0 | 0 | 0 | 1 | 0 |
Hawai'i| Player | FUM | LOST | REC |
|---|---|---|---|
| Devin Alves#11 | 1 | 0 | 0 |
| DeVon Rice#1 | 1 | 0 | 0 |
UNLV| Player | FG | PCT | LONG | XP | PTS |
|---|---|---|---|---|---|
 Ramon Villela#32 | 0/0 | 0.0 | 0 | 3/3 | 3 |
Hawai'i| Player | FG | PCT | LONG | XP | PTS |
|---|---|---|---|---|---|
 Sean Olvera-Harle#98 | 2/3 | 66.7 | 39 | 0/0 | 6 |
UNLV| Player | NO | YDS | AVG | TB | In 20 | LONG |
|---|---|---|---|---|---|---|
 Matt Choules#26 | 6 | 272 | 45.3 | 1 | 2 | 64 |
Hawai'i| Player | NO | YDS | AVG | TB | In 20 | LONG |
|---|---|---|---|---|---|---|
 Gehrig Heil#47 | 6 | 256 | 42.7 | 1 | 0 | 65 |
Hawai'i| Player | NO | YDS | AVG | LONG | TD |
|---|---|---|---|---|---|
| Blaze Kamoku#18 | 1 | 11 | 11.0 | 11 | 0 |
UNLV| Player | NO | YDS | AVG | LONG | TD |
|---|---|---|---|---|---|
 DeAngelo Irvin Jr.#4 | 1 | 0 | 0.0 | 0 | 0 |
Hawai'i| Player | NO | YDS | AVG | LONG | TD |
|---|---|---|---|---|---|
 Tama Uiliata#8 | 1 | 0 | 0.0 | 0 | 0 |
UNLV| Player | INT | YDS | TD |
|---|---|---|---|
| Quandarius Keyes#5 | 1 | 0 | 0 |
Drive Summary
UNLV
Punt
6
HAW
Punt
1
UNLV
Touchdown
80
HAW
Punt
7
UNLV
Downs
40
HAW
Field Goal
46
UNLV
Punt
6
HAW
Punt
35
UNLV
Punt
23
HAW
Punt
9
UNLV
Touchdown
74
HAW
Punt
1
UNLV
End Of Half
-2
HAW
Missed FG
52
UNLV
Punt
6
HAW
Field Goal
74
UNLV
Punt
39
HAW
Downs
53
UNLV
Punt
39
HAW
Punt
-7
UNLV
Touchdown
50
HAW
Interception
28
UNLV
End Of Quarter
36
Injury Report
No current injury report is available for this matchup.
Head-to-Head
Historical meetings are not available for this matchup.
Game Information
StageWeek 1
Season2026
KickoffSat, Sep 5, 10:00 pm
VenueClarence T.C. Ching Athletics Complex
LocationHonolulu, HI
SurfaceGrass
BroadcastCW
Division Standings
FBS — Mountain West Conference
| Team | W | L | T | Pct | PF | PA | Home | Away | Strk |
|---|---|---|---|---|---|---|---|---|---|
| UNLV | 5 | 4 | 0 | 0.556 | 235 | 231 | 3-2 | 2-2 | L1 |
 North Dakota State | 7 | 2 | 0 | 0.778 | 253 | 107 | 5-0 | 2-2 | W1 |
 Air Force | 7 | 2 | 0 | 0.778 | 258 | 193 | 4-1 | 3-1 | W2 |
 New Mexico | 8 | 1 | 0 | 0.889 | 311 | 98 | 4-0 | 4-1 | W6 |
 San José State | 5 | 5 | 0 | 0.500 | 209 | 220 | 2-3 | 3-2 | W1 |
 Nevada | 3 | 6 | 0 | 0.333 | 187 | 212 | 2-3 | 1-3 | L2 |
 Northern Illinois | 0 | 9 | 0 | 0.000 | 149 | 331 | 0-3 | 0-6 | L9 |
 UTEP | 1 | 8 | 0 | 0.111 | 127 | 309 | 1-4 | 0-4 | L7 |
 Wyoming | 6 | 3 | 0 | 0.667 | 197 | 195 | 4-0 | 2-3 | W4 |
| Hawai'i | 3 | 6 | 0 | 0.333 | 183 | 210 | 1-3 | 2-3 | W2 |
UNLV
5th in Mountain West
VS
Hawai'i
7th in Mountain West
Quarterbacks & Specialists
#11
Jackson Arnold
#26
Matt Choules
#1
Alex Orji
Receivers & Backs
#84
Keyan Burnett
Jaylon Glover
#4
DeAngelo Irvin Jr.
#88
Velltray Jefferson
#8
Taeshaun Lyons
#6
Kayden McGee
#9
Jai'Den Thomas
Defensive Line & Linebackers
#16
Mohamed Altayeb
#15
Blesyng Alualu-Tuiolemotu
#94
Lucas Conti
#3
Dee Crayton
#8
Kamuela Ka'aihue
#42
Andre Porter
#91
Elias Rudolph
#23
Cam Santee
#32
Kenji Scanlan
#44
Kal-El Togafau
Defensive Backs
#1
Mumu Bin-Wahad
#20
Landyn Cleveland
#10
Tre Fulton
#2
Denver Harris
#24
Avery Helm
#5
Quandarius Keyes
#4
Tony-Louis Nkuba
#7
Jake Pope
#21
Joshua Tuchek
Other
#32
Ramon Villela
Quarterbacks & Specialists
#12
Micah Alejado
#47
Gehrig Heil
#10
Bjorn Jurgensen
Receivers & Backs
#11
Devin Alves
#3
Carson Brown
#6
Kainoa Carvalho
#17
Nick Delgadillo
#83
Josiah Fetui
#2
Audric Harris
#18
Blaze Kamoku
#22
Titan Lacaden
#26
Sitani Mikaele
#1
DeVon Rice
#8
Tama Uiliata
Defensive Line & Linebackers
#10
Ka'eo Akana
#90
Ha'aheo Dela Cruz
#12
Wynden Ho'ohuli
#96
Iosefa Letuli
#97
Jordan Lynch
#18
Zaden Mariteragi
#52
Luther McCoy
#11
Jamih Otis
#31
Aisiah Paogofie
#99
Ozzy Pollard
#91
Josh Sagapolutele
#95
Geoffrey Speight Jr.
#9
Adam Tomczyk
Defensive Backs
#5
Jaylon Edmond
Jeremiah Hughes
#2
Kona Moore
#4
Elijah Palmer
#25
Matagi Thompson
Other
#98
Sean Olvera-Harle
UNLV
4th in Mountain West
VS
Hawai'i
8th in Mountain West
Passing
56.8
Completion Percentage
59.6
138
Completions
232
3.30
Interception Percentage
1.80
8
Interceptions
7
75
Longest Pass
62
1,805
Net Passing Yards
2,509
200.6
Net Passing Yards Per Game
278.8
243
Passing Attempts
389
6.20
Passing Touchdown %
2.80
15
Passing Touchdowns
11
132.7
Passer Rating
119.1
23
Total Sacks
22
175
Sack Yards Lost
147
7.4
Yards Per Pass Attempt
6.4
1,805
Passing Yards
2,509
0
Passing Fumbles Lost
0
9
Team Games Played
9
374.6
Yards Per Game
371.9
26.1
Total Points Per Game
20.3
235
Total Points
183
30
Total Touchdowns
21
200.6
Passing Yards Per Game
278.8
138-243
Comp-Att
232-389
23-175
Sacks-Yards Lost
22-147
Rushing
346
Rushing Attempts
258
1,566
Rushing Yards
838
4.5
Yards Per Rush Attempt
3.2
60
Long Rushing
33
0
20+ Yard Rushing Plays
0
13
Rushing Touchdowns
10
174.0
Rushing Yards Per Game
93.1
0
Rushing Fumbles
0
0
Rushing Fumbles Lost
0
77
Rushing 1st downs
53
9
Team Games Played
9
3,371
Total Yards
3,347
612
Total Offensive Plays
669
26.1
Total Points Per Game
20.3
235
Total Points
183
30
Total Touchdowns
21
Receiving
138
Receptions
232
0
Receiving Targets
0
1,805
Receiving Yards
2,509
1,805
Receiving Yards
2,509
15
Receiving Touchdowns
11
75
Long Reception
62
0
20+ Yard Receiving Plays
0
200.6
Receiving Yards Per Game
278.8
0
Receiving Fumbles
0
0
Receiving Fumbles Lost
0
542
Receiving Yards After Catch
878
77
Receiving First Downs
113
9
Team Games Played
9
13.1
Yards Per Reception
10.8
26.1
Total Points Per Game
20.3
235
Total Points
183
30
Total Touchdowns
21
Miscellaneous
173
Total 1st downs
192
77
Rushing 1st downs
53
77
Passing 1st downs
113
19
1st downs by penalty
27
55
Third Down Conversions
58
129
Third Down Attempts
142
42.64
3rd down %
40.85
8
Fourth Down Conversions
8
18
First Downs Attempts
14
44.44
4th down %
57.14
55
Total Penalties
62
559
Total Penalty Yards
510
15298
Possession Time Seconds
16992
0.00
Red Zone Field Goal Percentage
0.00
0.00
Red Zone Scoring Percentage
0.00
0.00
Red Zone Efficiency Percentage
0.00
0.00
Red Zone Touchdown Percentage
0.00
10
Total Takeaways
15
13
Total Giveaways
11
-3
Turnover Ratio
4
0
Fumbles Lost
0
55-129
3rd down efficiency
58-142
8-18
4th down efficiency
8-14
55-559
Total-Yards
62-510
Defense
288
Solo Tackles
306
364
Assist Tackles
216
652
Total Tackles
522
18
Sacks
13
133
Sack Yards
82
61
Stuffs
55
35
Passes Defended
27
17.2
Average Interception Yards
3.0
53
Long Interception
15
0
Miscellaneous Touchdowns
0
0
Kicks Blocked
4
33
Tackles For Loss
30
9
Team Games Played
9
Defensive Interceptions
10
Interceptions
6
172
Interception Yards
18
2
Interception Touchdowns
0
10-172
INT: Total
6-18
General
14
Fumbles
9
5
Forced Fumbles
8
2
Fumbles Recovered
8
0
Fumbles Touchdowns
0
9
Games Played
9
14-0
Fumbles-Lost
9-0
Returning
13
Kick Returns
7
298
Kick Return Yards
156
22.9
Yards Per Kick Return
22.3
58
Long Kick Return
69
0
Kick Return Touchdowns
0
9
Punt Returns
11
78
Punt Return Yards
50
8.7
Yards Per Punt Return
4.5
27
Long Punt Return
10
0
Punt Return Touchdowns
0
0
Punt Return Fair Catches
0
0
Kick Return Fumbles Lost
0
0
Punt Return Fumbles Lost
0
9
Team Games Played
9
9-78
Punt: Total
11-50
Kicking
8
Field Goal Made
13
10
Field Goal Attempts
18
80.0
Field Goal Percentage
72.2
60
Long Field Goal Made
44
0
Field Goal Attempts 1-19
0
3
Field Goal Attempts 20-29
5
5
Field Goal Attempts 30-39
5
1
Field Goal Attempts 40-49
6
1
Field Goal Attempts 50+
2
29
Extra Points Made
16
29
Extra Point Attempts
18
100.0
Extra Point Percentage
88.9
0
Field Goals Made 1-19
0
3
Field Goals Made 20-29
4
4
Field Goals Made 30-39
5
0
Field Goals Made 40-49
4
1
Field Goals Made 50+
0
53
Total Kicking Points
55
9
Team Games Played
9
42
Touchback Percentage
34
0.0
Average Kickoff Return Yards
0.0
0
Kickoff Return Yards
0
0
Kickoff Returns
0
0-0
Kickoffs: Total
0-0
8-10
FG: Good-Attempts
13-18
Punting
41
Punts
42
1,785
Punt Yards
1,792
64
Long Punt
65
43.5
Gross Average Punt Yards
42.7
43.5
Net Average Punt Yards
42.7
0
Punts Blocked
0
17
Punts Inside 20
18
3
Touchbacks
1
15
Fair Catches
12
14
Punt Returns
16
0
Punt Return Yards
0
0.0
Average Punt Return Yards
0.0
9
Team Games Played
9
41-1,785
Punt: Total Yards
42-1,792
Scoring
13
Rushing Touchdowns
10
15
Receiving Touchdowns
11
0
Return Touchdowns
0
28
Total Touchdowns
21
8
Field Goals
13
29
Kick Extra Points
16
1
Total Two Point Conversions
1
235
Total Points
183
26.1
Total Points Per Game
20.3