

UT Rio Grande Valley vs UTSA Live Score (5 Sep, 2026)
Score by Quarter
| Team | Q1 | Q2 | Q3 | Q4 | Final |
|---|---|---|---|---|---|
 UT Rio Grande Valley |
0 | 6 | 0 | 10 | 16 |
 UTSA |
7 | 24 | 0 | 14 | 45 |
Scoring Plays
Q1
6:51
6:51
O. McCown pass to AJ Wilson Jr. for 36 yds, for a TD (M. Petro KICK)
Passing Touchdown
0 – 7
Q2
13:16
13:16
O. McCown pass to B. Young Jr. for 7 yds, for a TD (M. Petro KICK)
Passing Touchdown
0 – 14
Q2
12:40
12:40
A. Jakobsohn pass intercepted, Ah. Chapman return for 49 yds, for a TD (M. Petro KICK)
Interception Return Touchdown
0 – 21
Q2
7:11
7:11
B. Gardner 44 yd FG GOOD
Field Goal Good
3 – 21
Q2
7:00
7:00
W. Henderson III run for 75 yds, for a TD (M. Petro KICK)
Rushing Touchdown
3 – 28
Q2
0:54
0:54
M. Petro 30 yd FG GOOD
Field Goal Good
3 – 31
Q2
0:02
0:02
B. Gardner 24 yd FG GOOD
Field Goal Good
6 – 31
Q4
10:41
10:41
O. McCown pass to DJ Allen Jr. for 62 yds, for a TD (M. Petro KICK)
Passing Touchdown
6 – 38
Q4
6:15
6:15
B. Gardner 40 yd FG GOOD
Field Goal Good
9 – 38
Q4
2:56
2:56
A. Peterson run for 53 yds, for a TD (M. Petro KICK)
Rushing Touchdown
9 – 45
Q4
0:04
0:04
A. Chavez Jr. run for 1 yd, for a TD (B. Gardner KICK)
Rushing Touchdown
16 – 45
Game Leaders
UT Rio Grande ValleyUTSA
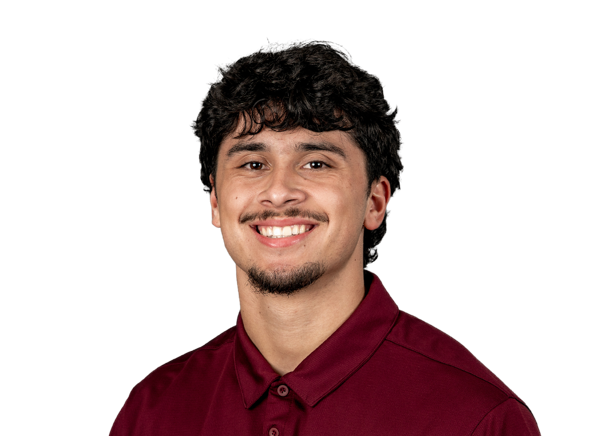 G. Rangel QB
Passing Yards
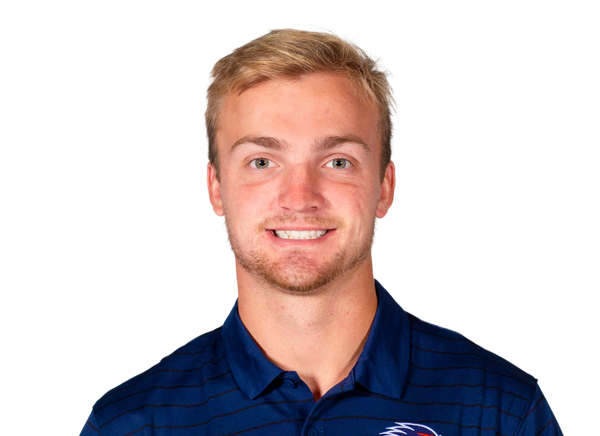 O. McCown QB
 B. Taylor RB
Rushing Yards
 W. Henderson III RB
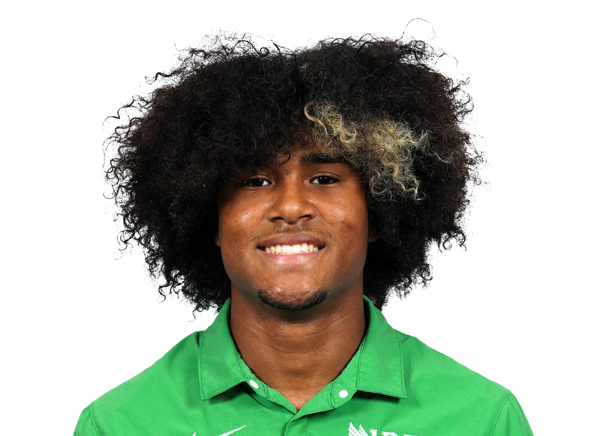 J. Smith WR
Receiving Yards
 D. Allen Jr. WR
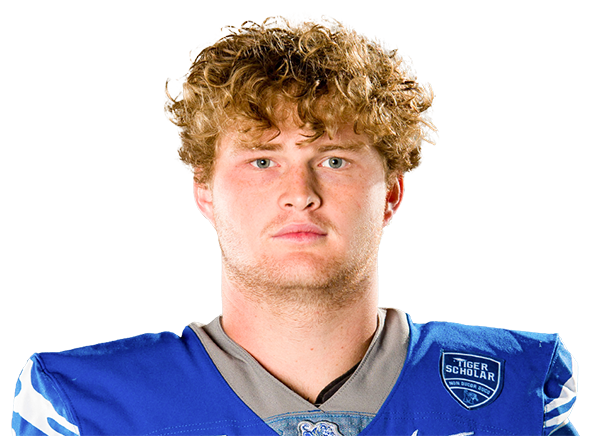 S. Rich LB
Tackles
 J. Rogers S
—
Sacks
 J. Walley Jr. LB
Player Box Score
UT Rio Grande Valley| Player | C/ATT | YDS | AVG | TD | INT |
|---|---|---|---|---|---|
| Garret Rangel#13 | 19/32 | 152 | 4.8 | 0 | 0 |
| Aidan Jakobsohn#3 | 6/11 | 91 | 8.3 | 0 | 2 |
| Atzel Chavez Jr.#2 | 1/4 | 2 | 0.5 | 0 | 0 |
UTSA| Player | C/ATT | YDS | AVG | TD | INT |
|---|---|---|---|---|---|
| Owen McCown#2 | 22/27 | 275 | 10.2 | 3 | 0 |
 Brandon Tennison#11 | 0/2 | 0 | 0.0 | 0 | 0 |
UT Rio Grande Valley| Player | CAR | YDS | AVG | TD | LONG |
|---|---|---|---|---|---|
| Broderick Taylor#26 | 6 | 73 | 12.2 | 0 | 54 |
| Brennan Carroll#6 | 4 | 47 | 11.8 | 0 | 25 |
| TJ Dement#4 | 11 | 32 | 2.9 | 0 | 7 |
| Fabian Garcia#24 | 4 | 11 | 2.8 | 0 | 6 |
| Garret Rangel#13 | 4 | 5 | 1.3 | 0 | 8 |
 Malachi Lane#5 | 3 | 5 | 1.7 | 0 | 6 |
| Aidan Jakobsohn#3 | 1 | 3 | 3.0 | 0 | 3 |
| Atzel Chavez Jr.#2 | 1 | 1 | 1.0 | 1 | 1 |
UTSA| Player | CAR | YDS | AVG | TD | LONG |
|---|---|---|---|---|---|
| Will Henderson III#1 | 9 | 99 | 11.0 | 1 | 75 |
 A'Marion Peterson#28 | 8 | 96 | 12.0 | 1 | 53 |
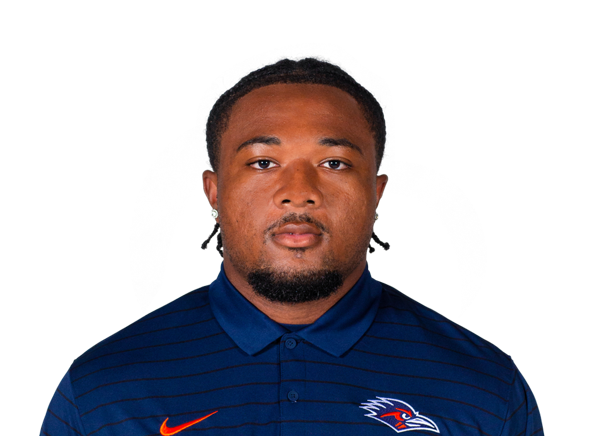 Brandon High Jr.#10 | 8 | 45 | 5.6 | 0 | 14 |
| Owen McCown#2 | 1 | 5 | 5.0 | 0 | 5 |
 AJ Wilson Jr.#84 | 1 | 5 | 5.0 | 0 | 5 |
 Brandon Young Jr.#89 | 1 | 1 | 1.0 | 0 | 1 |
| Team | 1 | -1 | -1.0 | 0 | 1 |
UT Rio Grande Valley| Player | REC | YDS | AVG | TD | LONG |
|---|---|---|---|---|---|
| Jaydon Smith#8 | 2 | 68 | 34.0 | 0 | 53 |
| Corey Holmes#80 | 7 | 68 | 9.7 | 0 | 24 |
| Kyran Lee#12 | 4 | 35 | 8.8 | 0 | 11 |
| Christian Sabsook#81 | 3 | 20 | 6.7 | 0 | 8 |
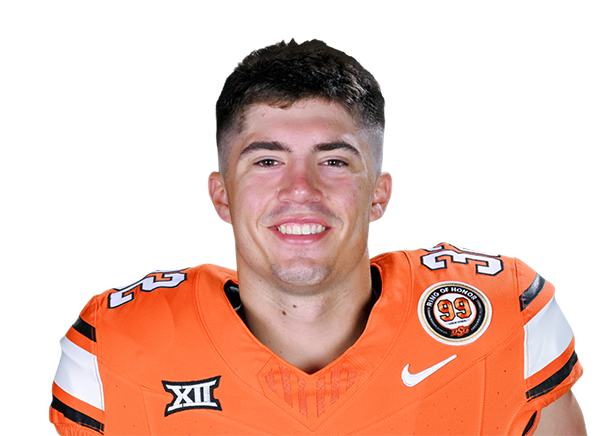 Braden Baize#7 | 2 | 16 | 8.0 | 0 | 10 |
| Tavian Cord#11 | 2 | 14 | 7.0 | 0 | 9 |
 Tyler Day#30 | 1 | 12 | 12.0 | 0 | 12 |
| Fabian Garcia#24 | 1 | 7 | 7.0 | 0 | 7 |
| Keilan Sweeny#18 | 1 | 4 | 4.0 | 0 | 4 |
| Cameron Glenn#10 | 2 | 4 | 2.0 | 0 | 2 |
| Brennan Carroll#6 | 1 | -3 | -3.0 | 0 | 0 |
UTSA| Player | REC | YDS | AVG | TD | LONG |
|---|---|---|---|---|---|
| DJ Allen Jr.#15 | 3 | 116 | 38.7 | 1 | 62 |
| AJ Wilson Jr.#84 | 2 | 42 | 21.0 | 1 | 36 |
 Mekhi Anderson#14 | 7 | 42 | 6.0 | 0 | 17 |
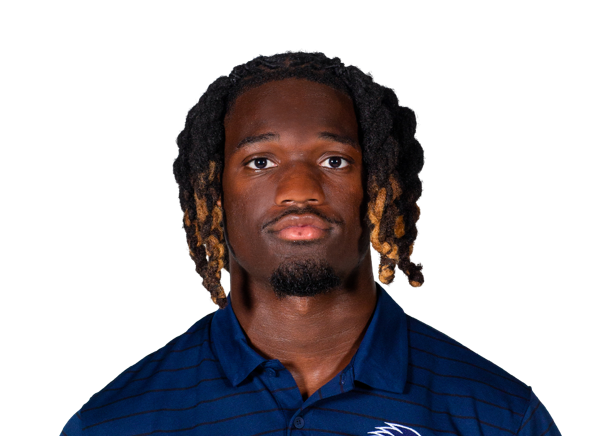 T.J. West#19 | 3 | 27 | 9.0 | 0 | 13 |
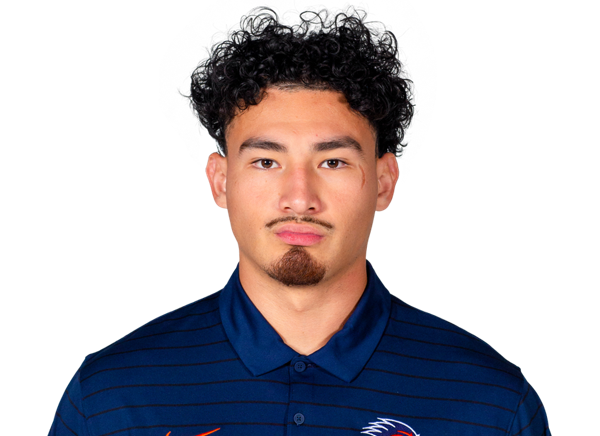 David Amador II | 2 | 18 | 9.0 | 0 | 11 |
 Miles Campbell#81 | 1 | 10 | 10.0 | 0 | 10 |
| Will Henderson III#1 | 2 | 10 | 5.0 | 0 | 6 |
| Brandon Young Jr.#89 | 1 | 7 | 7.0 | 1 | 7 |
 Jamel Hardy Jr.#13 | 1 | 3 | 3.0 | 0 | 3 |
UT Rio Grande Valley| Player | TOT | SOLO | SACKS | TFL | PD | QB HUR | TD |
|---|---|---|---|---|---|---|---|
| Spencer Rich#45 | 10 | 3 | 0 | 0.5 | 0 | 0 | 0 |
| Jaiden Haygood#23 | 7 | 2 | 0 | 1 | 0 | 1 | 0 |
| Alijah Prosser#1 | 6 | 5 | 0 | 0 | 0 | 0 | 0 |
 Jackson Waid#56 | 5 | 0 | 0 | 0 | 0 | 0 | 0 |
| TJ Neal#2 | 4 | 4 | 0 | 0 | 0 | 0 | 0 |
| Jordan Ford#3 | 4 | 3 | 0 | 0 | 0 | 0 | 0 |
| Seyyid Smith#53 | 4 | 2 | 0 | 1 | 1 | 0 | 0 |
| Keion Bryant#6 | 3 | 2 | 0 | 0 | 0 | 0 | 0 |
| Carter Hewitt#22 | 3 | 2 | 0 | 0 | 1 | 1 | 0 |
| Withchiel Filamar#91 | 3 | 0 | 0 | 0 | 0 | 0 | 0 |
| Trey Bright#48 | 2 | 1 | 0 | 0 | 0 | 0 | 0 |
| Connor Carrigan#41 | 2 | 1 | 0 | 0 | 0 | 0 | 0 |
| Percy Jackson III#93 | 2 | 1 | 0 | 0 | 0 | 0 | 0 |
 Nathan Huerta#42 | 2 | 0 | 0 | 0.5 | 0 | 0 | 0 |
 Walker Diharce#25 | 1 | 1 | 0 | 0 | 0 | 0 | 0 |
 Ife Ohalete#19 | 1 | 1 | 0 | 0 | 0 | 0 | 0 |
| Andrew Earls#27 | 1 | 1 | 0 | 0 | 0 | 0 | 0 |
| Abdon Mata#58 | 1 | 1 | 0 | 0 | 0 | 0 | 0 |
| Jaxson Maynard | 1 | 1 | 0 | 0 | 0 | 0 | 0 |
 Dorian Blackwell#9 | 1 | 0 | 0 | 0 | 1 | 0 | 0 |
| Nick Joseph#99 | 1 | 0 | 0 | 0 | 0 | 0 | 0 |
| Connor Cortez#52 | 1 | 0 | 0 | 0 | 0 | 0 | 0 |
| Nicholas Peace#36 | 0 | 0 | 0 | 0 | 1 | 0 | 0 |
UTSA| Player | TOT | SOLO | SACKS | TFL | PD | QB HUR | TD |
|---|---|---|---|---|---|---|---|
| Joel Rogers#14 | 7 | 4 | 0 | 0 | 1 | 0 | 0 |
| James Walley Jr.#34 | 6 | 3 | 1 | 1 | 0 | 0 | 0 |
 Bryce Grays#26 | 5 | 3 | 0 | 0 | 1 | 0 | 0 |
 Brandon Tucker#23 | 5 | 3 | 0 | 0 | 1 | 1 | 0 |
 Darion White#15 | 5 | 1 | 0 | 0 | 0 | 0 | 0 |
 RJ Lester Jr.#13 | 3 | 3 | 0 | 0 | 0 | 0 | 0 |
 Jarvse Duece Dickerson#21 | 3 | 3 | 0 | 0 | 0 | 0 | 0 |
 Elijah Baldwin#32 | 3 | 2 | 0 | 0 | 0 | 0 | 0 |
 Willie Nelson III | 3 | 1 | 0 | 1 | 0 | 1 | 0 |
 Jamarri Vinson#53 | 3 | 1 | 0 | 0 | 0 | 1 | 0 |
 Owen Pewee#2 | 3 | 0 | 0 | 0 | 0 | 0 | 0 |
 Elijah Newell#22 | 2 | 2 | 0 | 0 | 0 | 0 | 0 |
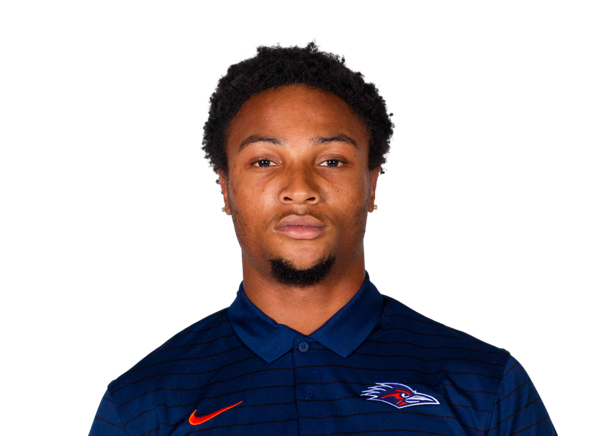 Asaad Chapman#17 | 2 | 2 | 0 | 0 | 1 | 0 | 0 |
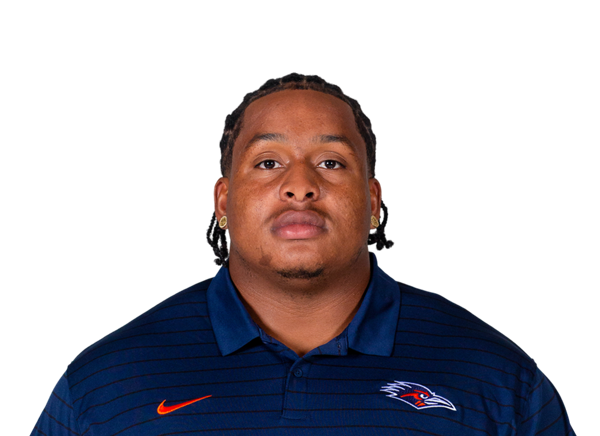 Jusiah Sampleton#91 | 2 | 2 | 0 | 0 | 0 | 1 | 0 |
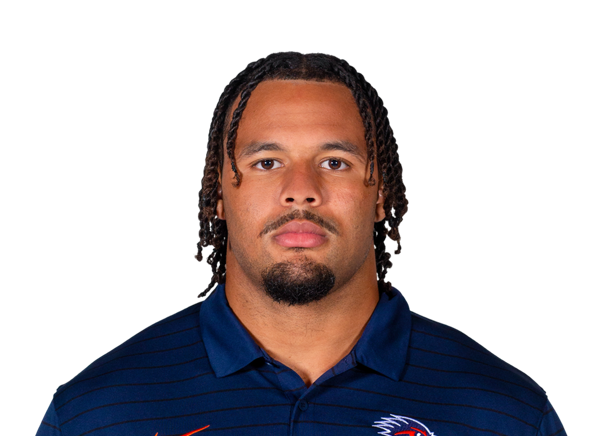 Camron Cooper#1 | 2 | 1 | 0 | 0.5 | 0 | 1 | 0 |
 Jameian Buxton#98 | 2 | 1 | 0 | 0 | 0 | 0 | 0 |
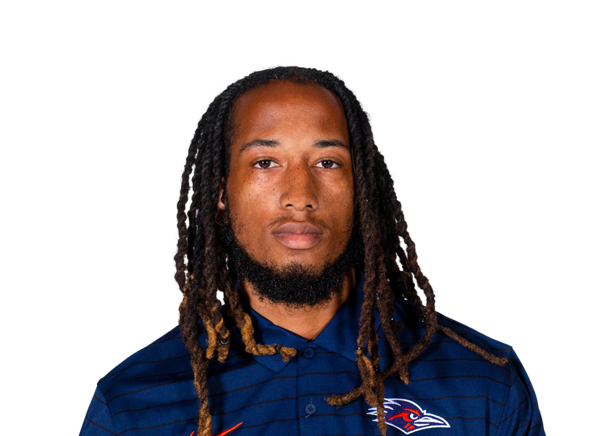 Jakevian Rodgers#27 | 2 | 1 | 0 | 0 | 1 | 0 | 0 |
 Eddy Smith#94 | 2 | 1 | 0 | 0 | 0 | 0 | 0 |
 Nate Robinson Jr.#25 | 2 | 1 | 0 | 0 | 0 | 0 | 0 |
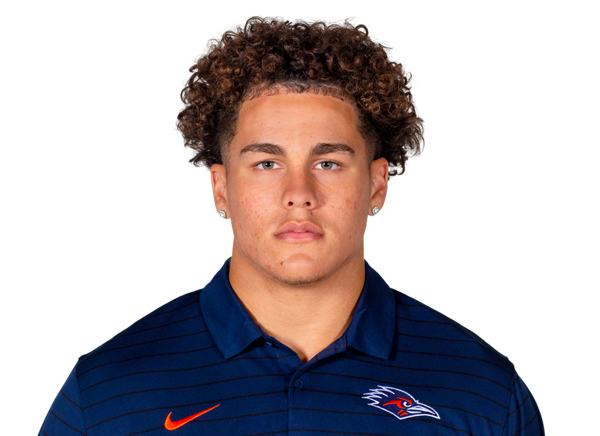 Braeden Lott#35 | 2 | 1 | 0 | 0 | 0 | 0 | 0 |
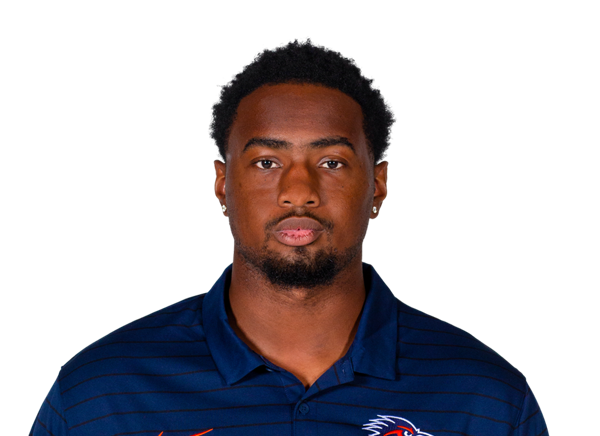 Drenon Fite III#95 | 2 | 0 | 0 | 0 | 0 | 0 | 0 |
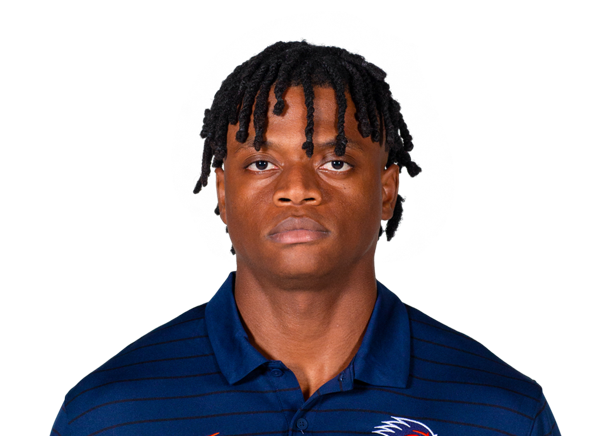 Louie Hogan#28 | 1 | 1 | 0 | 0 | 0 | 0 | 0 |
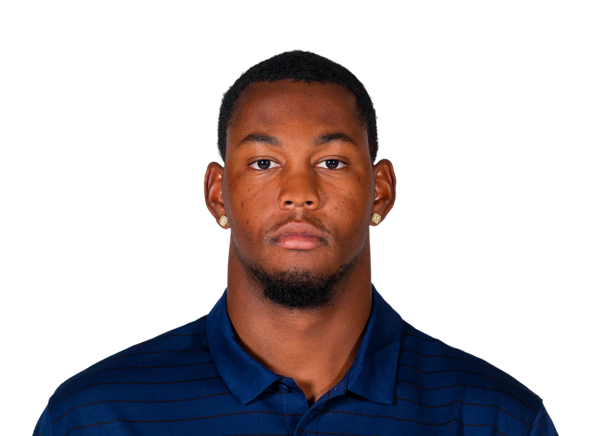 Tai Leonard#99 | 1 | 0 | 0 | 0 | 1 | 2 | 0 |
 Zach Morris#20 | 1 | 0 | 0 | 0.5 | 1 | 0 | 0 |
 Jeremiah Bailey | 1 | 0 | 0 | 0 | 1 | 1 | 0 |
 Donald Quaite Jr.#90 | 1 | 0 | 0 | 0 | 0 | 0 | 0 |
 Cam Upshaw Jr.#11 | 1 | 0 | 0 | 0 | 0 | 0 | 0 |
 Jacob Lopez-Veasey#48 | 1 | 0 | 0 | 0 | 0 | 0 | 0 |
 Ahamad Chapman#18 | 1 | 0 | 0 | 0 | 0 | 0 | 1 |
 Xavier Walton#29 | 1 | 0 | 0 | 0 | 0 | 0 | 0 |
 Collins Acheampong#44 | 0 | 0 | 0 | 0 | 0 | 1 | 0 |
UT Rio Grande Valley| Player | FUM | LOST | REC |
|---|---|---|---|
| TJ Dement#4 | 2 | 0 | 0 |
UT Rio Grande Valley| Player | FG | PCT | LONG | XP | PTS |
|---|---|---|---|---|---|
| Brysen Gardner#39 | 3/4 | 75.0 | 44 | 1/1 | 10 |
UTSA| Player | FG | PCT | LONG | XP | PTS |
|---|---|---|---|---|---|
 Michael Petro#92 | 1/2 | 50.0 | 30 | 6/6 | 9 |
UT Rio Grande Valley| Player | NO | YDS | AVG | TB | In 20 | LONG |
|---|---|---|---|---|---|---|
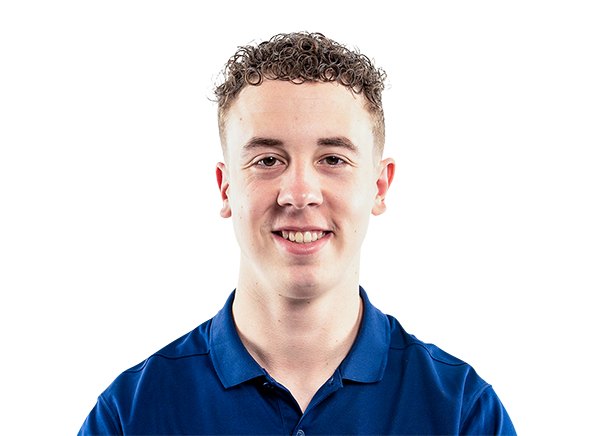 Nathaniel Wallace-Dilling#97 | 4 | 154 | 38.5 | 0 | 1 | 43 |
UTSA| Player | NO | YDS | AVG | TB | In 20 | LONG |
|---|---|---|---|---|---|---|
 Caile Hogan#30 | 3 | 130 | 43.3 | 0 | 2 | 58 |
UT Rio Grande Valley| Player | NO | YDS | AVG | LONG | TD |
|---|---|---|---|---|---|
| Carter Hewitt#22 | 2 | 33 | 16.5 | 20 | 0 |
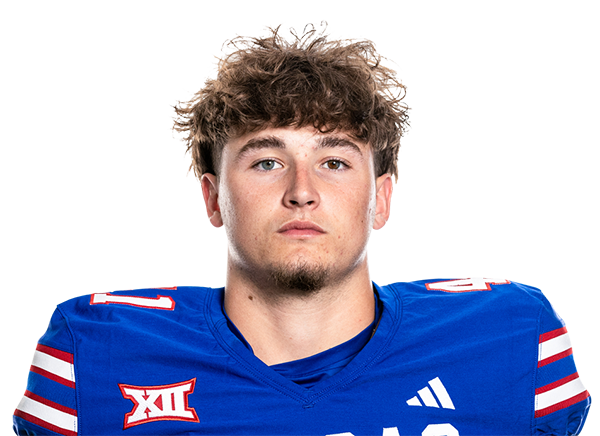 Hunter Luke#15 | 1 | 26 | 26.0 | 26 | 0 |
UTSA| Player | NO | YDS | AVG | LONG | TD |
|---|---|---|---|---|---|
| Brandon High Jr.#10 | 2 | 37 | 18.5 | 20 | 0 |
UTSA| Player | NO | YDS | AVG | LONG | TD |
|---|---|---|---|---|---|
| David Amador II | 2 | 10 | 5.0 | 6 | 0 |
UTSA| Player | INT | YDS | TD |
|---|---|---|---|
| Ahamad Chapman#18 | 1 | 49 | 1 |
| Nate Robinson Jr.#25 | 1 | 0 | 0 |
Drive Summary
RGV
Missed FG
58
UTSA
Touchdown
80
RGV
Punt
6
UTSA
Punt
9
RGV
Fumble
32
UTSA
Touchdown
43
RGV
Interception Touchdown
21
RGV
Field Goal
65
UTSA
Touchdown
90
RGV
Downs
32
UTSA
Field Goal
49
RGV
Field Goal
65
UTSA
Punt
17
RGV
Punt
33
UTSA
Downs
26
RGV
Punt
9
UTSA
Missed FG
66
RGV
Punt
-2
UTSA
Touchdown
61
RGV
Interception
0
UTSA
Punt
2
RGV
Field Goal
47
UTSA
Touchdown
83
RGV
Touchdown
74
UTSA
End Of Quarter
-1
Injury Report
No current injury report is available for this matchup.
Head-to-Head
Historical meetings are not available for this matchup.
Game Information
StageWeek 1
Season2026
KickoffSat, Sep 5, 3:30 pm
VenueAlamodome
LocationSan Antonio, TX
SurfaceArtificial Turf
BroadcastESPN+
Division Standings
FBS — American Conference
| Team | W | L | T | Pct | PF | PA | Home | Away | Strk |
|---|---|---|---|---|---|---|---|---|---|
 Army | 5 | 4 | 0 | 0.556 | 290 | 228 | 3-2 | 2-2 | L2 |
 Memphis | 8 | 2 | 0 | 0.800 | 390 | 253 | 5-0 | 3-2 | W3 |
 Navy | 3 | 6 | 0 | 0.333 | 263 | 274 | 3-2 | 0-4 | W1 |
 Temple | 2 | 9 | 0 | 0.182 | 261 | 322 | 1-6 | 1-3 | L6 |
 Tulsa | 6 | 4 | 0 | 0.600 | 336 | 226 | 3-2 | 3-2 | W2 |
| UTSA | 7 | 2 | 0 | 0.778 | 297 | 268 | 4-0 | 3-2 | L1 |
 Charlotte | 1 | 9 | 0 | 0.100 | 193 | 362 | 0-5 | 1-4 | L3 |
 Florida Atlantic | 6 | 4 | 0 | 0.600 | 383 | 353 | 5-0 | 1-4 | L1 |
 Rice | 2 | 9 | 0 | 0.182 | 239 | 353 | 1-4 | 1-5 | W1 |
 South Florida | 6 | 4 | 0 | 0.600 | 274 | 188 | 4-2 | 2-2 | L2 |
 Tulane | 5 | 5 | 0 | 0.500 | 210 | 280 | 3-2 | 2-3 | W1 |
 East Carolina | 6 | 4 | 0 | 0.600 | 229 | 226 | 4-1 | 2-3 | W3 |
 North Texas | 7 | 2 | 0 | 0.778 | 402 | 278 | 5-0 | 2-2 | W6 |
 UAB | 6 | 4 | 0 | 0.600 | 232 | 224 | 5-0 | 1-4 | W2 |
UT Rio Grande Valley
8th in Southland
VS
UTSA
Quarterbacks & Specialists
#2
Atzel Chavez Jr.
#52
Connor Cortez
#3
Aidan Jakobsohn
#13
Garret Rangel
#97
Nathaniel Wallace-Dilling
Receivers & Backs
#7
Braden Baize
#6
Brennan Carroll
#11
Tavian Cord
#30
Tyler Day
#4
TJ Dement
#24
Fabian Garcia
#10
Cameron Glenn
#80
Corey Holmes
#5
Malachi Lane
#12
Kyran Lee
#15
Hunter Luke
#81
Christian Sabsook
#8
Jaydon Smith
#18
Keilan Sweeny
#26
Broderick Taylor
Defensive Line & Linebackers
#48
Trey Bright
#41
Connor Carrigan
#25
Walker Diharce
#91
Withchiel Filamar
#23
Jaiden Haygood
#42
Nathan Huerta
#93
Percy Jackson III
#99
Nick Joseph
#58
Abdon Mata
Jaxson Maynard
#45
Spencer Rich
#53
Seyyid Smith
#56
Jackson Waid
Defensive Backs
#9
Dorian Blackwell
#6
Keion Bryant
#27
Andrew Earls
#3
Jordan Ford
#22
Carter Hewitt
#2
TJ Neal
#19
Ife Ohalete
#36
Nicholas Peace
#1
Alijah Prosser
Other
#39
Brysen Gardner
Quarterbacks & Specialists
#30
Caile Hogan
#2
Owen McCown
#11
Brandon Tennison
Receivers & Backs
#15
DJ Allen Jr.
David Amador II
#14
Mekhi Anderson
#81
Miles Campbell
#13
Jamel Hardy Jr.
#1
Will Henderson III
#10
Brandon High Jr.
#28
A'Marion Peterson
#19
TJ West
#84
AJ Wilson
#89
Brandon Young Jr.
Defensive Line & Linebackers
#44
Collins Acheampong
Jeremiah Bailey
#32
Elijah Baldwin
#98
Jameian Buxton
#1
Camron Cooper
#95
Drenon Fite III
#26
Bryce Grays
#99
Tai Leonard
#48
Jacob Lopez-Veasey
#58
Braeden Lott
#24
Willie Nelson III
#2
Owen Pewee
#90
Donald Quaite Jr.
#91
Jusiah Sampleton
#94
Eddy Smith
#23
Brandon Tucker
#54
Jamarri Vinson
#34
James Walley Jr.
#44
Darion White
Defensive Backs
#18
Ahamad Chapman
#17
Asaad Chapman
#28
Louie Hogan
#13
RJ Lester Jr.
#20
Zach Morris
#22
Elijah Newell
#25
Nate Robinson Jr.
#27
Jakevian Rodgers
#14
Joel Rogers
#11
Cameron Upshaw Jr.
#29
Xavier Walton
Other
#92
Michael Petro
UT Rio Grande Valley
5th in Southland
VS
UTSA
3rd in American
Passing
56.3
Completion Percentage
67.3
200
Completions
191
3.70
Interception Percentage
1.40
13
Interceptions
4
53
Longest Pass
62
2,383
Net Passing Yards
2,067
238.3
Net Passing Yards Per Game
229.7
355
Passing Attempts
284
3.90
Passing Touchdown %
4.90
14
Passing Touchdowns
14
118.2
Passer Rating
142.1
17
Total Sacks
16
132
Sack Yards Lost
82
6.7
Yards Per Pass Attempt
7.3
2,383
Passing Yards
2,067
0
Passing Fumbles Lost
0
10
Team Games Played
9
393.6
Yards Per Game
410.3
26.6
Total Points Per Game
33.0
266
Total Points
297
31
Total Touchdowns
37
238.3
Passing Yards Per Game
229.7
200-355
Comp-Att
191-284
17-132
Sacks-Yards Lost
16-82
Rushing
320
Rushing Attempts
328
1,553
Rushing Yards
1,626
4.9
Yards Per Rush Attempt
5.0
66
Long Rushing
75
0
20+ Yard Rushing Plays
0
15
Rushing Touchdowns
21
155.3
Rushing Yards Per Game
180.7
0
Rushing Fumbles
0
0
Rushing Fumbles Lost
0
78
Rushing 1st downs
83
10
Team Games Played
9
3,936
Total Yards
3,693
692
Total Offensive Plays
628
26.6
Total Points Per Game
33.0
266
Total Points
297
31
Total Touchdowns
37
Receiving
200
Receptions
191
0
Receiving Targets
0
2,383
Receiving Yards
2,067
2,383
Receiving Yards
2,067
14
Receiving Touchdowns
14
53
Long Reception
62
0
20+ Yard Receiving Plays
0
238.3
Receiving Yards Per Game
229.7
0
Receiving Fumbles
0
0
Receiving Fumbles Lost
0
158
Receiving Yards After Catch
1277
105
Receiving First Downs
92
10
Team Games Played
9
11.9
Yards Per Reception
10.8
26.6
Total Points Per Game
33.0
266
Total Points
297
31
Total Touchdowns
37
Miscellaneous
213
Total 1st downs
191
78
Rushing 1st downs
83
105
Passing 1st downs
92
30
1st downs by penalty
16
56
Third Down Conversions
52
140
Third Down Attempts
127
40.00
3rd down %
40.94
9
Fourth Down Conversions
11
15
First Downs Attempts
15
60.00
4th down %
73.33
73
Total Penalties
75
603
Total Penalty Yards
724
17620
Possession Time Seconds
16055
0.00
Red Zone Field Goal Percentage
0.00
0.00
Red Zone Scoring Percentage
0.00
0.00
Red Zone Efficiency Percentage
0.00
0.00
Red Zone Touchdown Percentage
0.00
19
Total Takeaways
12
18
Total Giveaways
8
1
Turnover Ratio
4
0
Fumbles Lost
0
56-140
3rd down efficiency
52-127
9-15
4th down efficiency
11-15
73-603
Total-Yards
75-724
Defense
328
Solo Tackles
337
376
Assist Tackles
284
704
Total Tackles
621
16
Sacks
10
75
Sack Yards
73
59
Stuffs
67
34
Passes Defended
22
15.8
Average Interception Yards
10.9
90
Long Interception
49
0
Miscellaneous Touchdowns
0
0
Kicks Blocked
0
33
Tackles For Loss
30
10
Team Games Played
9
Defensive Interceptions
15
Interceptions
7
237
Interception Yards
76
2
Interception Touchdowns
1
15-237
INT: Total
7-76
General
12
Fumbles
6
2
Forced Fumbles
4
6
Fumbles Recovered
8
0
Fumbles Touchdowns
0
10
Games Played
9
12-0
Fumbles-Lost
6-0
Returning
31
Kick Returns
13
525
Kick Return Yards
363
16.9
Yards Per Kick Return
27.9
36
Long Kick Return
100
0
Kick Return Touchdowns
1
14
Punt Returns
16
73
Punt Return Yards
115
5.2
Yards Per Punt Return
7.2
23
Long Punt Return
21
0
Punt Return Touchdowns
0
0
Punt Return Fair Catches
0
0
Kick Return Fumbles Lost
0
0
Punt Return Fumbles Lost
0
10
Team Games Played
9
14-73
Punt: Total
16-115
Kicking
17
Field Goal Made
13
24
Field Goal Attempts
16
70.8
Field Goal Percentage
81.3
51
Long Field Goal Made
54
0
Field Goal Attempts 1-19
0
9
Field Goal Attempts 20-29
2
5
Field Goal Attempts 30-39
8
5
Field Goal Attempts 40-49
4
5
Field Goal Attempts 50+
2
29
Extra Points Made
34
29
Extra Point Attempts
35
100.0
Extra Point Percentage
97.1
0
Field Goals Made 1-19
0
8
Field Goals Made 20-29
2
4
Field Goals Made 30-39
6
3
Field Goals Made 40-49
3
2
Field Goals Made 50+
2
80
Total Kicking Points
73
10
Team Games Played
9
40
Touchback Percentage
50
0.0
Average Kickoff Return Yards
0.0
0
Kickoff Return Yards
0
0
Kickoff Returns
0
0-0
Kickoffs: Total
0-0
17-24
FG: Good-Attempts
13-16
Punting
35
Punts
38
1,415
Punt Yards
1,570
53
Long Punt
59
40.4
Gross Average Punt Yards
41.3
40.4
Net Average Punt Yards
41.3
0
Punts Blocked
0
9
Punts Inside 20
11
3
Touchbacks
2
8
Fair Catches
8
14
Punt Returns
14
0
Punt Return Yards
0
0.0
Average Punt Return Yards
0.0
10
Team Games Played
9
35-1,415
Punt: Total Yards
38-1,570
Scoring
15
Rushing Touchdowns
21
14
Receiving Touchdowns
14
0
Return Touchdowns
1
29
Total Touchdowns
36
17
Field Goals
13
29
Kick Extra Points
34
0
Total Two Point Conversions
1
266
Total Points
297
26.6
Total Points Per Game
33.0