

Utah State vs Utah Live Score (19 Sep, 2026)
Score by Quarter
| Team | Q1 | Q2 | Q3 | Q4 | Final |
|---|---|---|---|---|---|
 Utah State |
0 | 0 | 0 | 0 | 0 |
 Utah |
16 | 10 | 7 | 0 | 33 |
Scoring Plays
Q1
10:37
10:37
Braden Pegan 28 Yd pass from Devon Dampier (Dillon Curtis Kick)
Passing Touchdown
0 – 7
Q1
5:38
5:38
Byrd Ficklin 9 Yd Run (Two-Point Run Conversion Failed)
Rushing Touchdown
0 – 13
Q1
0:04
0:04
Dillon Curtis 36 Yd Field Goal
Field Goal Good
0 – 16
Q2
4:48
4:48
Dillon Curtis 54 Yd Field Goal
Field Goal Good
0 – 19
Q2
0:33
0:33
Braden Pegan 37 Yd pass from Devon Dampier (Dillon Curtis Kick)
Passing Touchdown
0 – 26
Q3
5:16
5:16
Daniel Bray 63 Yd Run (Dillon Curtis Kick)
Rushing Touchdown
0 – 33
Game Leaders
Utah StateUtah
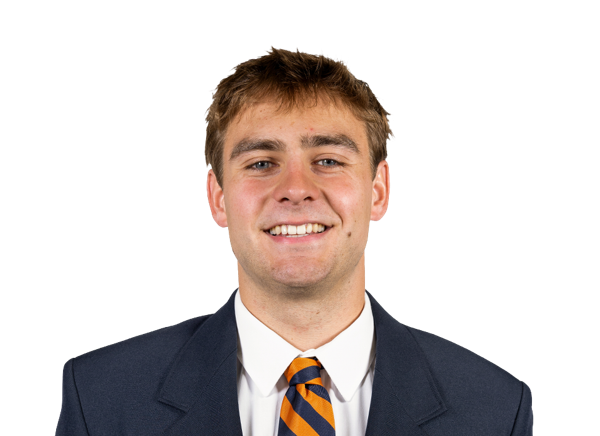 G. Brosterhous QB
Passing Yards
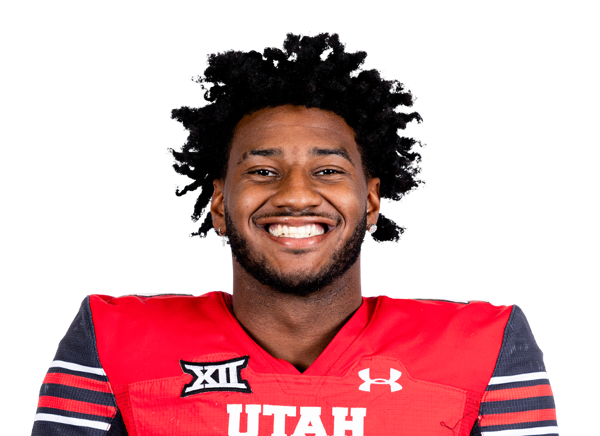 D. Dampier QB
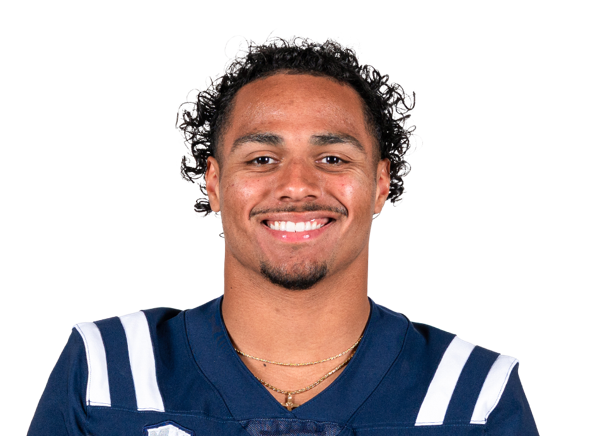 J. Jacobs RB
Rushing Yards
 D. Bray RB
 E. Wood WR
Receiving Yards
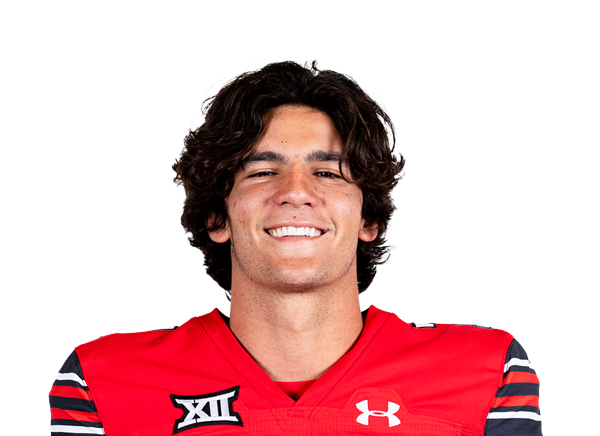 B. Pegan WR
 J. Jennette LB
Sacks
 C. Polu LB
 C. Lewis S
Tackles
 T. Reynolds LB
Player Box Score
Utah State| Player | C/ATT | YDS | AVG | TD | INT | QBR |
|---|---|---|---|---|---|---|
| Grady Brosterhous#9 | 15/29 | 130 | 4.5 | 0 | 1 | 24.7 |
Utah| Player | C/ATT | YDS | AVG | TD | INT | QBR |
|---|---|---|---|---|---|---|
| Devon Dampier#4 | 22/32 | 253 | 7.9 | 2 | 0 | 72.9 |
 Byrd Ficklin#15 | 3/5 | 33 | 6.6 | 0 | 0 | 55.4 |
Utah State| Player | CAR | YDS | AVG | TD | LONG |
|---|---|---|---|---|---|
| Javen Jacobs#8 | 5 | 31 | 6.2 | 0 | 16 |
| Grady Brosterhous#9 | 17 | 17 | 1.0 | 0 | 7 |
 Anthony Garcia#1 | 2 | 8 | 4.0 | 0 | 6 |
 Noah White#23 | 1 | 2 | 2.0 | 0 | 2 |
Utah| Player | CAR | YDS | AVG | TD | LONG |
|---|---|---|---|---|---|
| Daniel Bray#5 | 3 | 82 | 27.3 | 1 | 63 |
| Devon Dampier#4 | 10 | 34 | 3.4 | 0 | 13 |
 Wayshawn Parker#1 | 10 | 30 | 3.0 | 0 | 14 |
| Byrd Ficklin#15 | 5 | 23 | 4.6 | 1 | 9 |
 Steve Chavez-Soto#25 | 3 | 10 | 3.3 | 0 | 5 |
 Mateaki Helu#20 | 2 | 9 | 4.5 | 0 | 7 |
 LaMarcus Bell#26 | 1 | 6 | 6.0 | 0 | 6 |
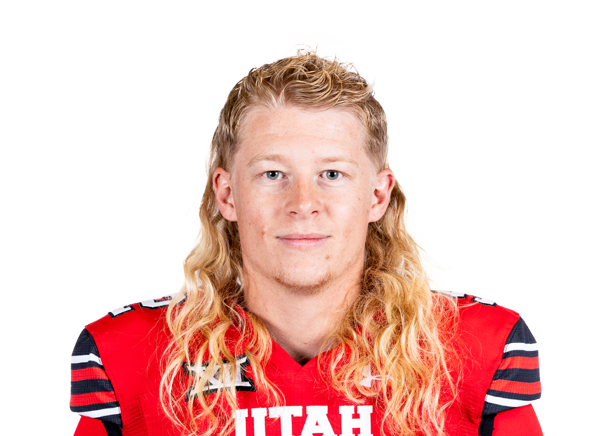 Orion Phillips#92 | 1 | 2 | 2.0 | 0 | 2 |
 Team | 2 | -2 | -1.0 | 0 | 0 |
Utah State| Player | REC | YDS | AVG | TD | LONG |
|---|---|---|---|---|---|
| Eli Wood#7 | 4 | 47 | 11.8 | 0 | 18 |
| Noah White#23 | 2 | 22 | 11.0 | 0 | 19 |
 Demick Starling#6 | 3 | 22 | 7.3 | 0 | 14 |
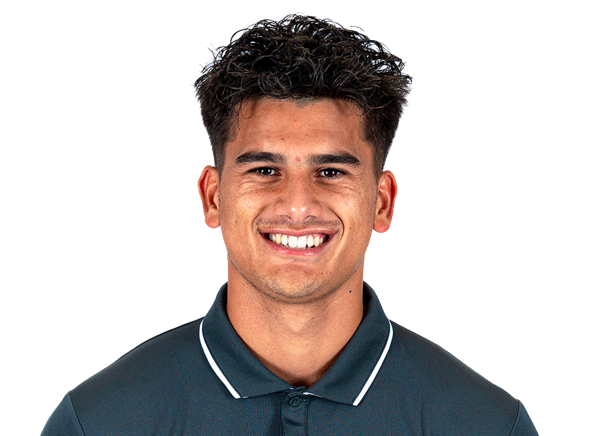 Kaina Watson#12 | 1 | 12 | 12.0 | 0 | 12 |
| Javen Jacobs#8 | 2 | 12 | 6.0 | 0 | 9 |
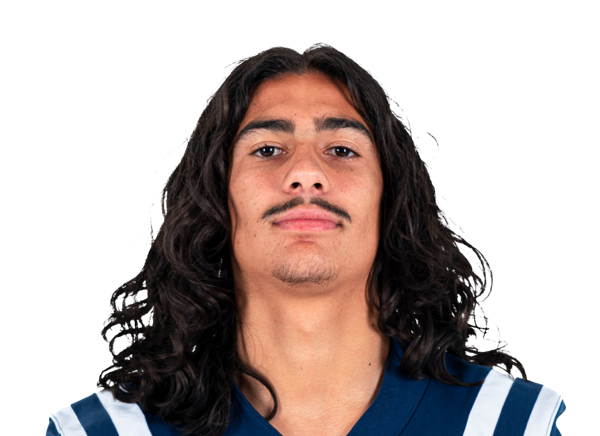 Nikko Boncore#4 | 1 | 10 | 10.0 | 0 | 10 |
| Anthony Garcia#1 | 2 | 5 | 2.5 | 0 | 3 |
Utah| Player | REC | YDS | AVG | TD | LONG |
|---|---|---|---|---|---|
| Braden Pegan#7 | 8 | 122 | 15.3 | 2 | 37 |
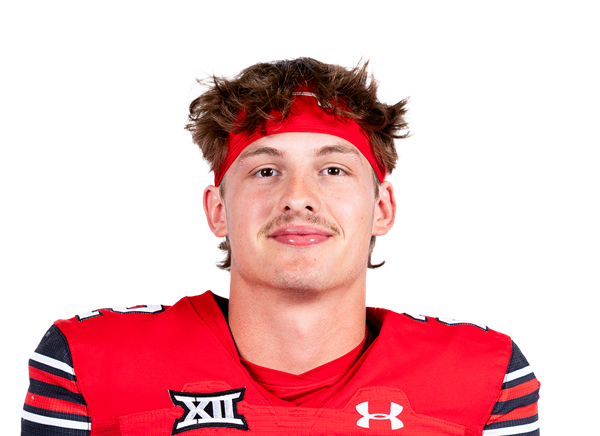 Creed Whittemore#2 | 2 | 43 | 21.5 | 0 | 36 |
 Ricky Johnson#11 | 4 | 43 | 10.8 | 0 | 18 |
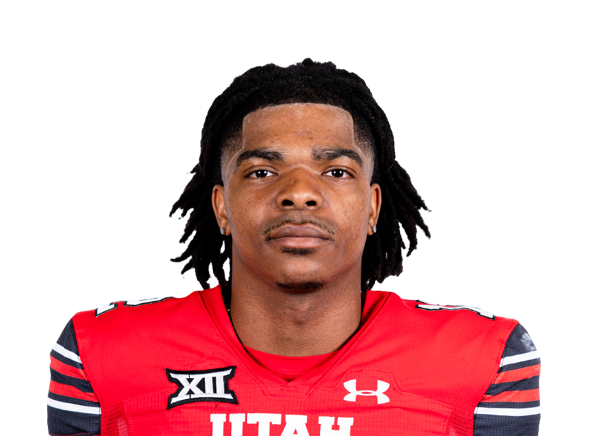 Larry Simmons#12 | 2 | 37 | 18.5 | 0 | 19 |
| Daniel Bray#5 | 4 | 19 | 4.8 | 0 | 8 |
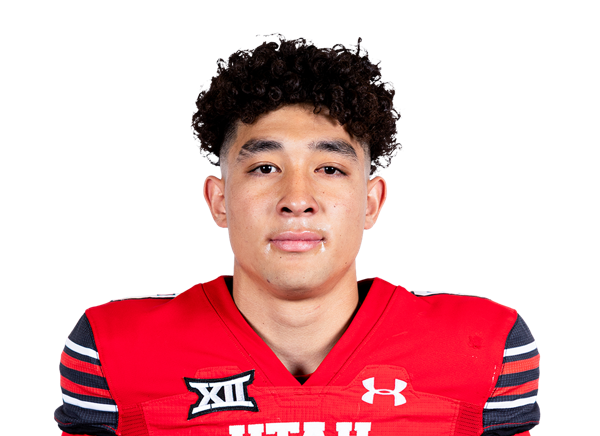 Mana Carvalho#8 | 1 | 15 | 15.0 | 0 | 15 |
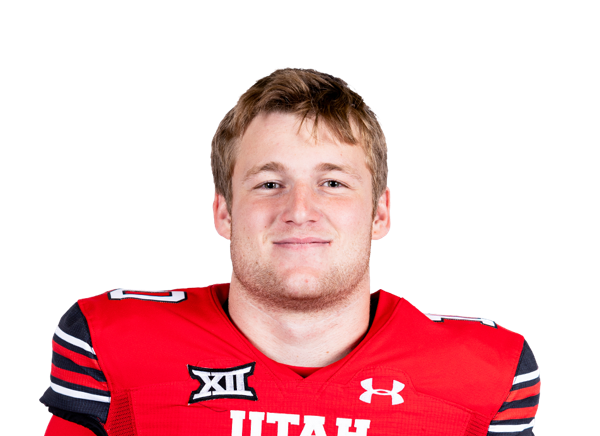 Hunter Andrews#10 | 1 | 6 | 6.0 | 0 | 6 |
| Wayshawn Parker#1 | 2 | 1 | 0.5 | 0 | 2 |
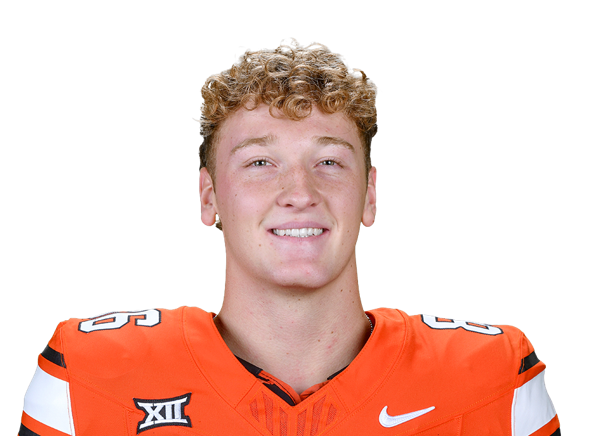 Will Monney#86 | 1 | 0 | 0.0 | 0 | 0 |
Utah State| Player | TOT | SOLO | SACKS | TFL | PD | QB HUR | TD |
|---|---|---|---|---|---|---|---|
| Chapman Lewis#21 | 11 | 5 | 0 | 1 | 0 | 0 | 0 |
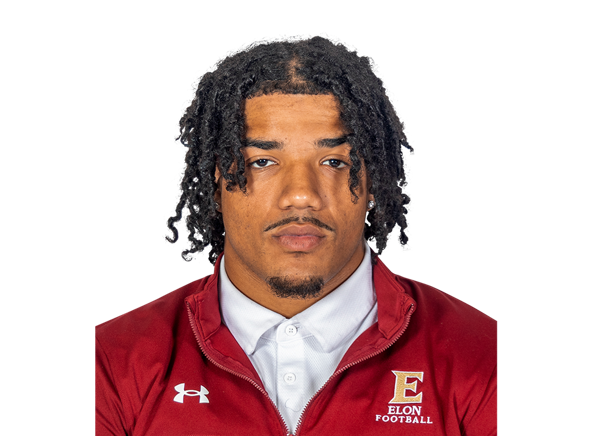 Asher Cunningham#11 | 9 | 3 | 0 | 1 | 1 | 0 | 0 |
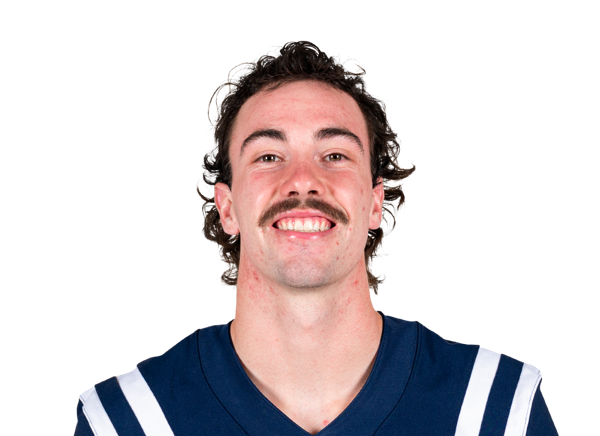 Brevin Hamblin#4 | 9 | 2 | 0 | 0 | 1 | 0 | 0 |
 Kye Stokes#2 | 7 | 2 | 0 | 0.5 | 0 | 0 | 0 |
 Bronson Olevao Jr.#14 | 6 | 2 | 0 | 1 | 0 | 0 | 0 |
| James Jennette#18 | 5 | 2 | 1 | 1 | 0 | 0 | 0 |
 Harrison Taggart | 5 | 0 | 0 | 0 | 0 | 0 | 0 |
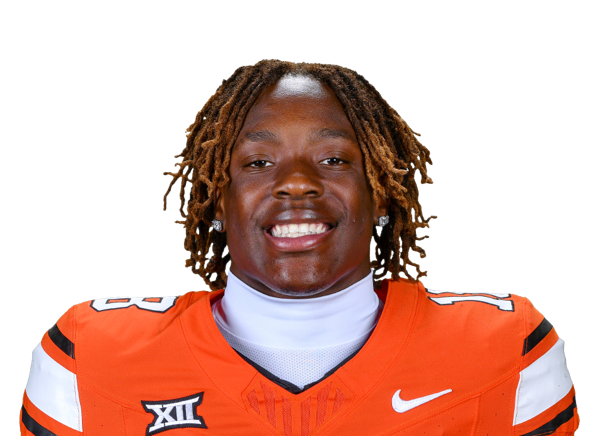 David Kabongo#8 | 5 | 0 | 0 | 0.5 | 0 | 0 | 0 |
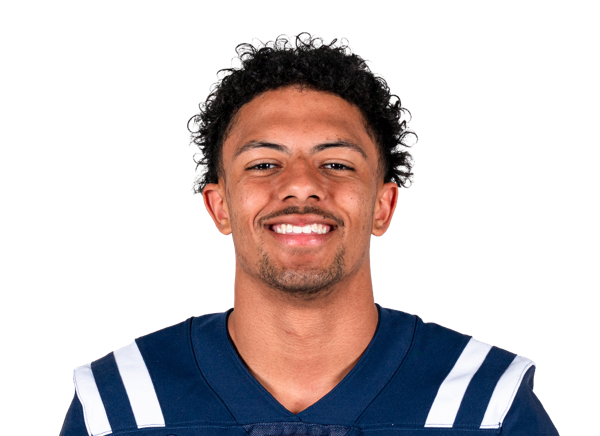 D'Angelo Mayes#15 | 3 | 3 | 0 | 0 | 0 | 0 | 0 |
 Chris Joe#25 | 3 | 3 | 0 | 1 | 0 | 0 | 0 |
 Tyree Morris#9 | 3 | 1 | 0 | 0 | 0 | 0 | 0 |
 Markie Grant#5 | 3 | 1 | 0 | 0 | 1 | 0 | 0 |
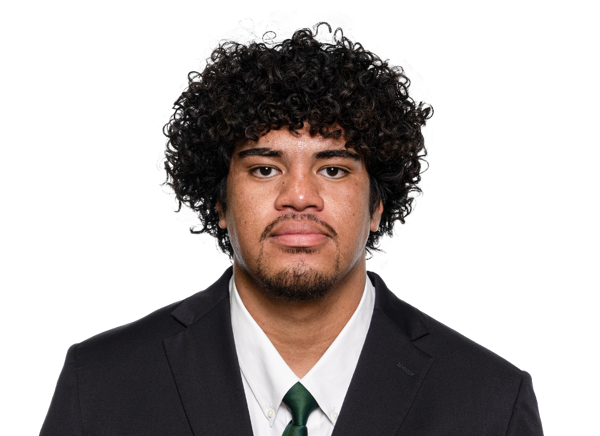 Ronnie Mageo#90 | 3 | 0 | 0 | 0 | 0 | 0 | 0 |
 John Shepard#22 | 3 | 0 | 0 | 0 | 0 | 0 | 0 |
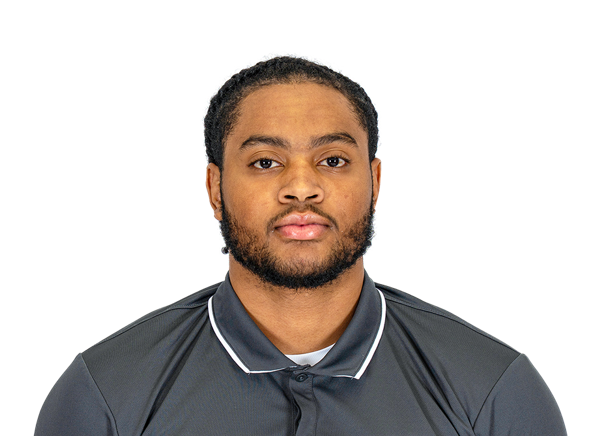 Adonis Jackson#32 | 3 | 0 | 0 | 0 | 0 | 0 | 0 |
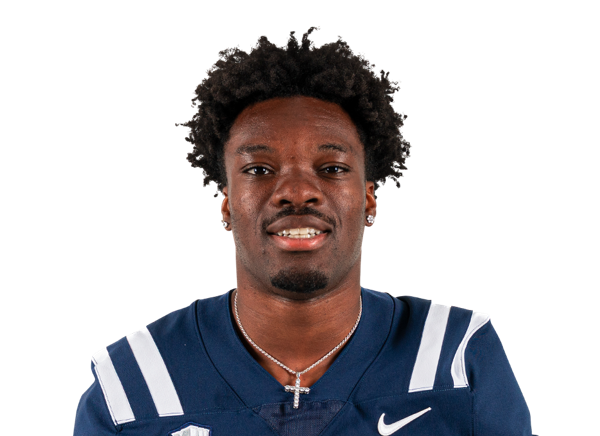 Chika Ebunoha#12 | 2 | 2 | 0 | 0 | 0 | 0 | 0 |
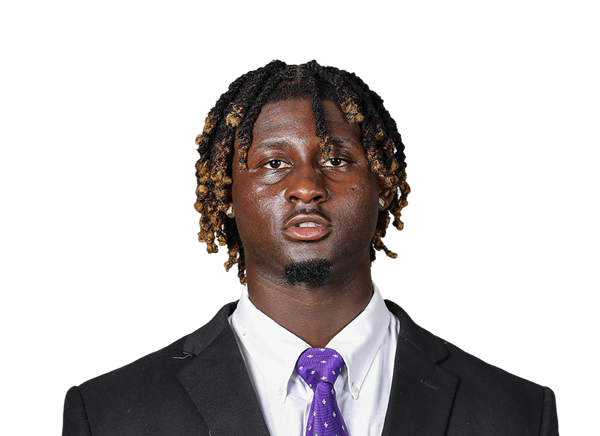 BJ Diakite | 2 | 1 | 0 | 1 | 0 | 0 | 0 |
 Ta'avili Tuitama#51 | 2 | 0 | 0 | 0 | 1 | 0 | 0 |
 Jordan Pendleton#17 | 1 | 1 | 0 | 0 | 0 | 0 | 0 |
 Charger Doty#3 | 1 | 0 | 0 | 0 | 0 | 0 | 0 |
 Carson Tujague#28 | 1 | 0 | 0 | 0 | 1 | 0 | 0 |
 Hyrum Hatch#55 | 1 | 0 | 0 | 0 | 0 | 0 | 0 |
Utah| Player | TOT | SOLO | SACKS | TFL | PD | QB HUR | TD |
|---|---|---|---|---|---|---|---|
| Trey Reynolds#10 | 10 | 6 | 0 | 0 | 0 | 0 | 0 |
 Nate Ritchie#6 | 6 | 4 | 1 | 1 | 0 | 0 | 0 |
 Elijah Elliss#83 | 5 | 0 | 0 | 0.5 | 0 | 0 | 0 |
| Cyrus Polu | 4 | 3 | 1.5 | 1.5 | 1 | 0 | 0 |
 Rabbit Evans#1 | 4 | 2 | 1 | 1 | 0 | 0 | 0 |
 Elijah Davis#9 | 3 | 3 | 0 | 0 | 1 | 0 | 0 |
 Jackson Bennee#23 | 3 | 2 | 0 | 0 | 0 | 0 | 0 |
 Johnathan Hall#7 | 3 | 1 | 0 | 0 | 0 | 0 | 0 |
 Kash Dillon#93 | 3 | 1 | 0 | 0 | 0 | 0 | 0 |
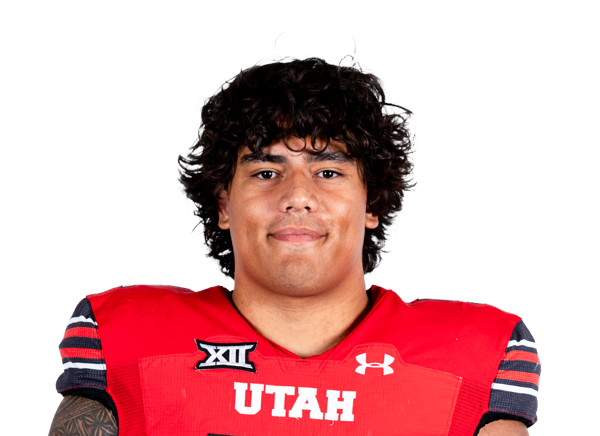 Karson Kaufusi#51 | 3 | 1 | 0 | 0 | 0 | 0 | 0 |
 Lance Holtzclaw#15 | 3 | 0 | 0 | 0.5 | 0 | 0 | 0 |
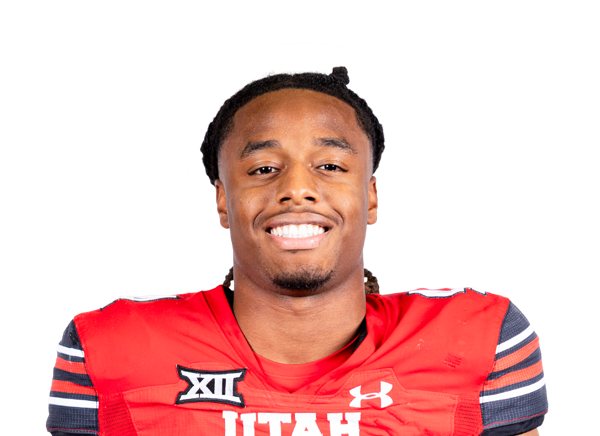 JC Hart#4 | 2 | 2 | 0 | 0 | 0 | 0 | 0 |
 Elijah Reed#11 | 2 | 1 | 0 | 0 | 1 | 0 | 0 |
 James Chenault Jr.#5 | 1 | 1 | 0 | 0 | 1 | 0 | 0 |
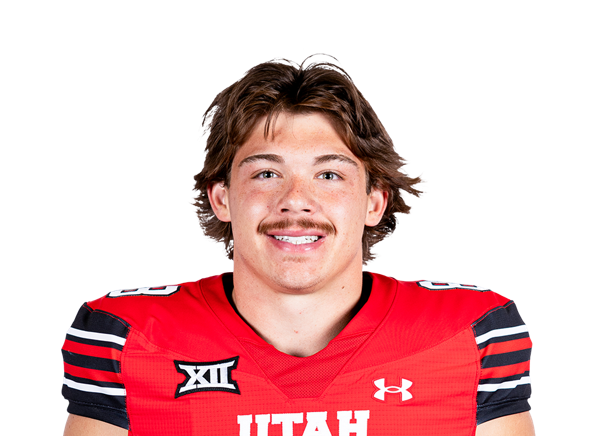 Ethan Day#8 | 1 | 1 | 0 | 0 | 0 | 0 | 0 |
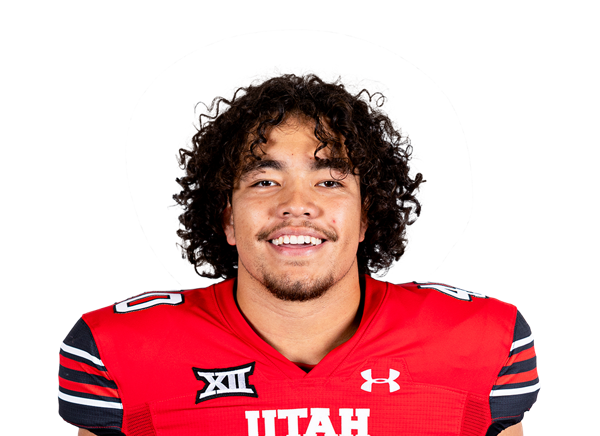 Paul Fitzgerald#40 | 1 | 0 | 0 | 0 | 0 | 0 | 0 |
 Lucas Samsula#97 | 1 | 0 | 0.5 | 0.5 | 0 | 0 | 0 |
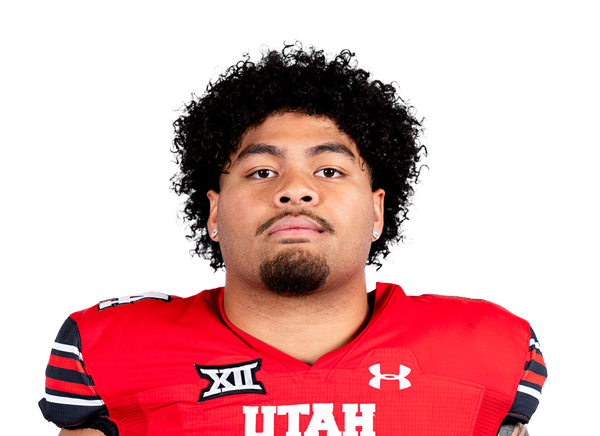 Sione Motuapuaka#44 | 1 | 0 | 0 | 0 | 0 | 0 | 0 |
Utah State| Player | FUM | LOST | REC |
|---|---|---|---|
| Bronson Olevao Jr.#14 | 0 | 0 | 1 |
Utah| Player | FUM | LOST | REC |
|---|---|---|---|
| Devon Dampier#4 | 1 | 1 | 0 |
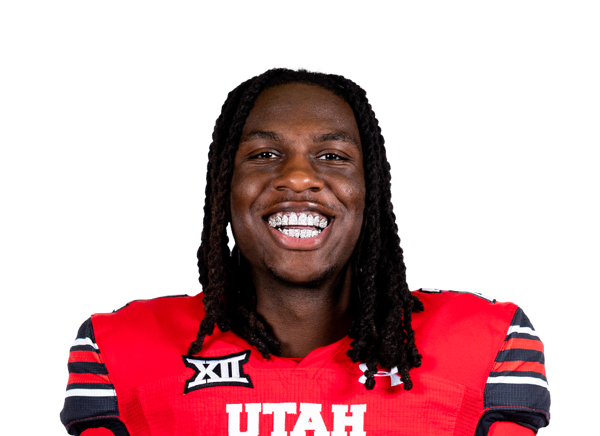 Nate Tilmon#21 | 0 | 0 | 1 |
Utah| Player | FG | PCT | LONG | XP | PTS |
|---|---|---|---|---|---|
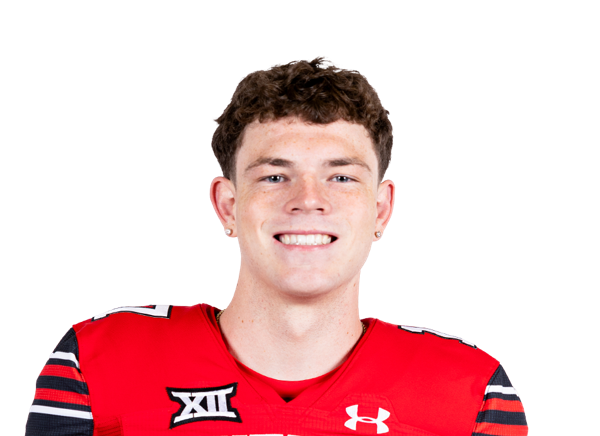 Dillon Curtis#17 | 2/2 | 100.0 | 54 | 3/3 | 9 |
Utah State| Player | NO | YDS | AVG | TB | In 20 | LONG |
|---|---|---|---|---|---|---|
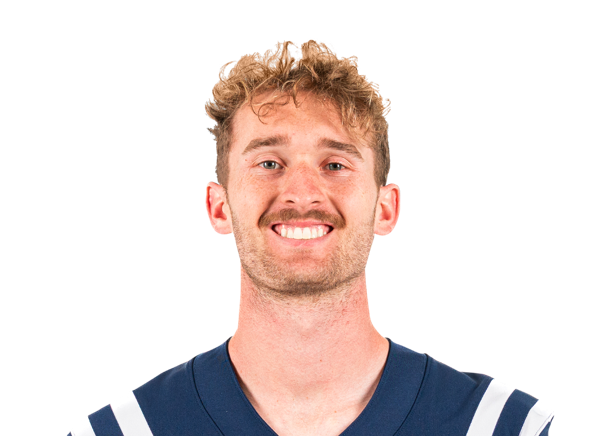 Landon Rehkow#3 | 8 | 334 | 41.8 | 1 | 3 | 56 |
Utah| Player | NO | YDS | AVG | TB | In 20 | LONG |
|---|---|---|---|---|---|---|
| Orion Phillips#92 | 2 | 94 | 47.0 | 0 | 0 | 56 |
Utah State| Player | NO | YDS | AVG | LONG | TD |
|---|---|---|---|---|---|
| Noah White#23 | 1 | 21 | 21.0 | 21 | 0 |
Utah State| Player | NO | YDS | AVG | LONG | TD |
|---|---|---|---|---|---|
| Javen Jacobs#8 | 1 | 0 | 0.0 | 0 | 0 |
| Team | 1 | -1 | -1.0 | -1 | 0 |
Utah| Player | NO | YDS | AVG | LONG | TD |
|---|---|---|---|---|---|
| Mana Carvalho#8 | 2 | 6 | 3.0 | 4 | 0 |
| Creed Whittemore#2 | 1 | 5 | 5.0 | 5 | 0 |
Utah| Player | INT | YDS | TD |
|---|---|---|---|
| Rabbit Evans#1 | 1 | 0 | 0 |
Drive Summary
UTAH
Touchdown
75
USU
Punt
6
UTAH
Touchdown
75
USU
Punt
-1
UTAH
Field Goal
57
USU
Punt
37
UTAH
Field Goal
63
USU
Punt
38
UTAH
Punt
7
UTAH
Touchdown
39
USU
End of Half
5
USU
Punt
-7
UTAH
Downs
4
USU
Punt
7
UTAH
Fumble
22
USU
Interception
20
UTAH
Touchdown
80
USU
Downs
67
UTAH
Punt
8
USU
Punt
12
UTAH
Downs
25
USU
Punt
-1
UTAH
End of Half
35
Injury Report
No current injury report is available for this matchup.
Head-to-Head
Historical meetings are not available for this matchup.
Game Information
StageWeek 3
Season2026
KickoffSat, Sep 19, 3:30 pm
VenueRice-Eccles Stadium
LocationSalt Lake City, UT
SurfaceArtificial Turf
BroadcastFOX
Attendance51,455
Division Standings
FBS — Pac-12 Conference
| Team | W | L | T | Pct | PF | PA | Home | Away | Strk |
|---|---|---|---|---|---|---|---|---|---|
 Boise State | 9 | 1 | 0 | 0.900 | 397 | 268 | 5-0 | 4-1 | W9 |
 Colorado State | 3 | 6 | 0 | 0.333 | 322 | 403 | 3-3 | 0-3 | L2 |
 Fresno State | 5 | 5 | 0 | 0.500 | 276 | 222 | 3-1 | 2-4 | L2 |
 Oregon State | 5 | 5 | 0 | 0.500 | 383 | 288 | 3-2 | 2-3 | L3 |
 San Diego State | 4 | 5 | 0 | 0.444 | 238 | 309 | 4-1 | 0-4 | W1 |
 Texas State | 6 | 4 | 0 | 0.600 | 384 | 312 | 5-1 | 1-3 | W2 |
 Washington State | 1 | 8 | 0 | 0.111 | 171 | 247 | 1-3 | 0-5 | L6 |
| Utah State | 4 | 5 | 0 | 0.444 | 152 | 185 | 4-1 | 0-4 | W2 |
FBS — Big 12 Conference
| Team | W | L | T | Pct | PF | PA | Home | Away | Strk |
|---|---|---|---|---|---|---|---|---|---|
 BYU | 8 | 2 | 0 | 0.800 | 307 | 185 | 6-0 | 2-2 | W1 |
 Texas Tech | 8 | 1 | 0 | 0.889 | 338 | 217 | 6-0 | 2-1 | W2 |
 Arizona State | 6 | 4 | 0 | 0.600 | 282 | 259 | 4-1 | 2-3 | W2 |
 Cincinnati | 5 | 5 | 0 | 0.500 | 310 | 306 | 5-1 | 0-4 | L3 |
 Kansas State | 4 | 6 | 0 | 0.400 | 292 | 261 | 4-2 | 0-4 | L4 |
| Utah | 9 | 0 | 0 | 1.000 | 339 | 147 | 6-0 | 3-0 | W9 |
 West Virginia | 5 | 5 | 0 | 0.500 | 349 | 348 | 3-3 | 2-2 | L2 |
 Baylor | 6 | 4 | 0 | 0.600 | 294 | 181 | 4-1 | 2-3 | L1 |
 Colorado | 4 | 6 | 0 | 0.400 | 220 | 287 | 3-2 | 1-4 | W1 |
 Iowa State | 5 | 5 | 0 | 0.500 | 304 | 273 | 5-1 | 0-4 | W1 |
 Oklahoma State | 6 | 3 | 0 | 0.667 | 395 | 245 | 4-0 | 2-3 | W1 |
 TCU | 5 | 5 | 0 | 0.500 | 234 | 152 | 4-3 | 1-2 | W1 |
 UCF | 5 | 5 | 0 | 0.500 | 284 | 260 | 4-2 | 1-3 | L1 |
 Arizona | 7 | 2 | 0 | 0.778 | 308 | 179 | 5-0 | 2-2 | W1 |
 Houston | 7 | 3 | 0 | 0.700 | 351 | 234 | 5-0 | 2-3 | L1 |
 Kansas | 4 | 6 | 0 | 0.400 | 302 | 237 | 3-3 | 1-3 | W1 |
Utah State
5th in Pac-12
VS
Utah
1st in Big 12
Quarterbacks & Specialists
#9
Grady Brosterhous
#55
Hyrum Hatch
#3
Landon Rehkow
Receivers & Backs
#4
Nikko Boncore
#1
Anthony Garcia
#8
Javen Jacobs
#6
Demick Starling
#12
Kaina Watson
#23
Noah White
#7
Eli Wood
Defensive Line & Linebackers
#11
Asher Cunningham
BJ Diakite
#32
Adonis Jackson
#18
James Jennette
#25
Chris Joe
#90
Ronnie Mageo
#9
Tyree Morris
#14
Bronson Olevao Jr.
#17
Jordan Pendleton
Harrison Taggart
#51
Ta'avili Tuitama
#28
Carson Tujague
Defensive Backs
#3
Charger Doty
#12
Chika Ebunoha
#5
Markie Grant
#4
Brevin Hamblin
#8
David Kabongo
#21
Chapman Lewis
#15
D'Angelo Mayes
#22
John Shepard
#2
Kye Stokes
Quarterbacks & Specialists
#4
Devon Dampier
#15
Byrd Ficklin
#92
Orion Phillips
Receivers & Backs
#10
Hunter Andrews
#26
LaMarcus Bell
#5
Daniel Bray
#8
Mana Carvalho
#25
Steve Chavez-Soto
#20
Mateaki Helu
#11
Ricky Johnson
#86
Will Monney
#44
Sione Motuapuaka
#1
Wayshawn Parker
#7
Braden Pegan
#12
Larry Simmons
#2
Creed Whittemore
Defensive Line & Linebackers
#8
Ethan Day
#93
Kash Dillon
#83
Elijah Elliss
#40
Paul Fitzgerald
#7
Johnathan Hall
#15
Lance Holtzclaw
#51
Karson Kaufusi
Cyrus Polu
#10
Trey Reynolds
#97
Lucas Samsula
Defensive Backs
#23
Jackson Bennee
#5
James Chenault Jr.
#9
Elijah Davis
#1
Rabbit Evans
#4
JC Hart
#11
Elijah Reed
#6
Nate Ritchie
#21
Nate Tilmon
Other
#17
Dillon Curtis
Utah State
4th in Pac-12
VS
Utah
1st in Big 12
Passing
55.7
Completion Percentage
65.9
161
Completions
197
3.50
Interception Percentage
2.70
10
Interceptions
8
78
Longest Pass
70
1,824
Net Passing Yards
2,478
182.4
Net Passing Yards Per Game
247.8
289
Passing Attempts
299
4.20
Passing Touchdown %
8.00
12
Passing Touchdowns
24
115.3
Passer Rating
156.7
28
Total Sacks
15
144
Sack Yards Lost
70
6.3
Yards Per Pass Attempt
8.3
1,824
Passing Yards
2,478
0
Passing Fumbles Lost
0
10
Team Games Played
10
307.8
Yards Per Game
471.3
16.5
Total Points Per Game
37.9
165
Total Points
379
20
Total Touchdowns
51
182.4
Passing Yards Per Game
247.8
161-289
Comp-Att
197-299
28-144
Sacks-Yards Lost
15-70
Rushing
335
Rushing Attempts
386
1,254
Rushing Yards
2,235
3.7
Yards Per Rush Attempt
5.8
64
Long Rushing
90
0
20+ Yard Rushing Plays
0
8
Rushing Touchdowns
25
125.4
Rushing Yards Per Game
223.5
0
Rushing Fumbles
0
0
Rushing Fumbles Lost
0
60
Rushing 1st downs
113
10
Team Games Played
10
3,078
Total Yards
4,713
652
Total Offensive Plays
700
16.5
Total Points Per Game
37.9
165
Total Points
379
20
Total Touchdowns
51
Receiving
161
Receptions
197
0
Receiving Targets
0
1,824
Receiving Yards
2,478
1,824
Receiving Yards
2,478
12
Receiving Touchdowns
24
78
Long Reception
70
0
20+ Yard Receiving Plays
0
182.4
Receiving Yards Per Game
247.8
0
Receiving Fumbles
0
0
Receiving Fumbles Lost
0
716
Receiving Yards After Catch
1207
81
Receiving First Downs
112
10
Team Games Played
10
11.3
Yards Per Reception
12.6
16.5
Total Points Per Game
37.9
165
Total Points
379
20
Total Touchdowns
51
Miscellaneous
171
Total 1st downs
245
60
Rushing 1st downs
113
81
Passing 1st downs
112
30
1st downs by penalty
20
49
Third Down Conversions
66
133
Third Down Attempts
125
36.84
3rd down %
52.80
4
Fourth Down Conversions
6
15
First Downs Attempts
14
26.67
4th down %
42.86
67
Total Penalties
56
571
Total Penalty Yards
463
17052
Possession Time Seconds
19042
0.00
Red Zone Field Goal Percentage
0.00
0.00
Red Zone Scoring Percentage
0.00
0.00
Red Zone Efficiency Percentage
0.00
0.00
Red Zone Touchdown Percentage
0.00
16
Total Takeaways
12
13
Total Giveaways
15
3
Turnover Ratio
-3
0
Fumbles Lost
0
49-133
3rd down efficiency
66-125
4-15
4th down efficiency
6-14
67-571
Total-Yards
56-463
Defense
309
Solo Tackles
301
390
Assist Tackles
294
699
Total Tackles
595
17
Sacks
21
105
Sack Yards
160
78
Stuffs
71
42
Passes Defended
53
29.8
Average Interception Yards
11.0
33
Long Interception
39
0
Miscellaneous Touchdowns
0
0
Kicks Blocked
0
40
Tackles For Loss
31
10
Team Games Played
10
Defensive Interceptions
4
Interceptions
14
119
Interception Yards
154
0
Interception Touchdowns
1
4-119
INT: Total
14-154
General
7
Fumbles
15
7
Forced Fumbles
2
6
Fumbles Recovered
4
0
Fumbles Touchdowns
1
10
Games Played
10
7-0
Fumbles-Lost
15-0
Returning
12
Kick Returns
10
225
Kick Return Yards
152
18.8
Yards Per Kick Return
15.2
30
Long Kick Return
36
0
Kick Return Touchdowns
0
21
Punt Returns
18
132
Punt Return Yards
103
6.3
Yards Per Punt Return
5.7
21
Long Punt Return
25
0
Punt Return Touchdowns
0
0
Punt Return Fair Catches
0
0
Kick Return Fumbles Lost
0
0
Punt Return Fumbles Lost
0
10
Team Games Played
10
21-132
Punt: Total
18-103
Kicking
8
Field Goal Made
8
13
Field Goal Attempts
11
61.5
Field Goal Percentage
72.7
48
Long Field Goal Made
54
0
Field Goal Attempts 1-19
0
5
Field Goal Attempts 20-29
5
1
Field Goal Attempts 30-39
4
7
Field Goal Attempts 40-49
0
0
Field Goal Attempts 50+
2
17
Extra Points Made
47
17
Extra Point Attempts
48
100.0
Extra Point Percentage
97.9
0
Field Goals Made 1-19
0
4
Field Goals Made 20-29
4
0
Field Goals Made 30-39
2
4
Field Goals Made 40-49
0
0
Field Goals Made 50+
2
41
Total Kicking Points
71
10
Team Games Played
10
49
Touchback Percentage
78
0.0
Average Kickoff Return Yards
0.0
0
Kickoff Return Yards
0
0
Kickoff Returns
0
0-0
Kickoffs: Total
0-0
8-13
FG: Good-Attempts
8-11
Punting
51
Punts
30
2,101
Punt Yards
1,316
60
Long Punt
84
41.2
Gross Average Punt Yards
43.9
41.2
Net Average Punt Yards
43.9
0
Punts Blocked
0
21
Punts Inside 20
13
2
Touchbacks
1
21
Fair Catches
10
14
Punt Returns
6
0
Punt Return Yards
0
0.0
Average Punt Return Yards
0.0
10
Team Games Played
10
51-2,101
Punt: Total Yards
30-1,316
Scoring
8
Rushing Touchdowns
25
12
Receiving Touchdowns
24
0
Return Touchdowns
0
20
Total Touchdowns
50
8
Field Goals
8
17
Kick Extra Points
47
2
Total Two Point Conversions
1
165
Total Points
379
16.5
Total Points Per Game
37.9