

Utah vs Iowa State Live Score (26 Sep, 2026)
Score by Quarter
| Team | Q1 | Q2 | Q3 | Q4 | Final |
|---|---|---|---|---|---|
 Utah |
14 | 10 | 0 | 7 | 31 |
 Iowa State |
0 | 3 | 7 | 7 | 17 |
Scoring Plays
Q1
14:44
14:44
Wayshawn Parker 54 Yd Run (Dillon Curtis Kick)
Rushing Touchdown
7 – 0
Q1
2:32
2:32
D. Dampier pass to B. Pegan for 24 yds, for a TD (D. Curtis KICK)
Passing Touchdown
14 – 0
Q2
10:14
10:14
Dillon Curtis 27 Yd Field Goal
Field Goal Good
17 – 0
Q2
3:50
3:50
Kyle Konrardy 47 Yd Field Goal
Field Goal Good
17 – 3
Q2
1:35
1:35
Wayshawn Parker 1 Yd Run (Dillon Curtis Kick)
Rushing Touchdown
24 – 3
Q3
8:00
8:00
J. Raynor run for 8 yds, for a TD (K. Konrardy KICK)
Rushing Touchdown
24 – 10
Q4
10:48
10:48
J. Raynor pass to D. Overby for 22 yds, for a TD (K. Konrardy KICK)
Passing Touchdown
24 – 11
Q4
2:58
2:58
Wayshawn Parker 13 Yd pass from Devon Dampier (Dillon Curtis Kick)
Passing Touchdown
31 – 17
Game Leaders
UtahIowa State
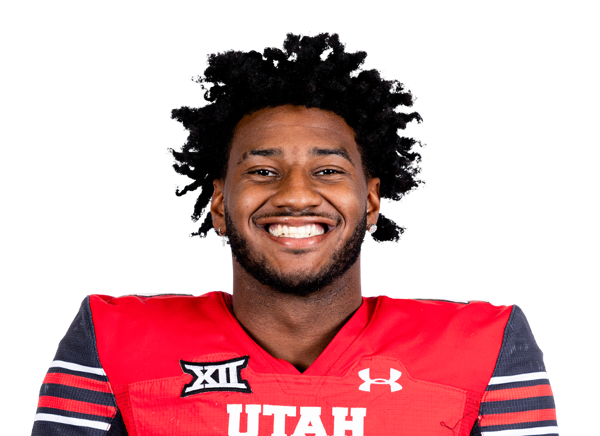 D. Dampier QB
Passing Yards
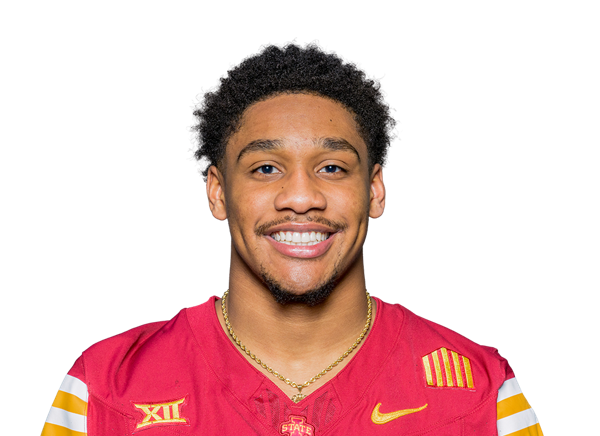 J. Raynor QB
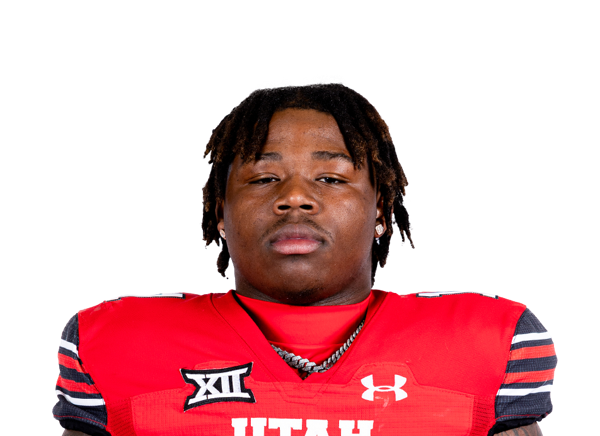 W. Parker RB
Rushing Yards
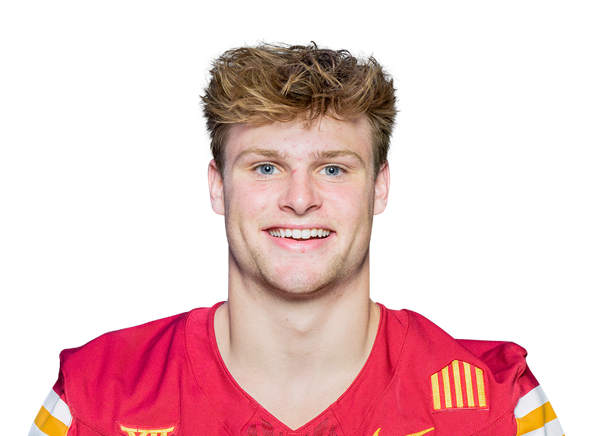 A. Flora RBW. Parker RB
Receiving Yards
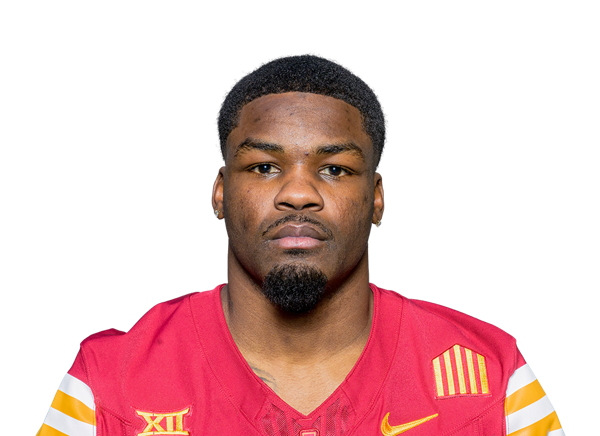 O. Hayes WR
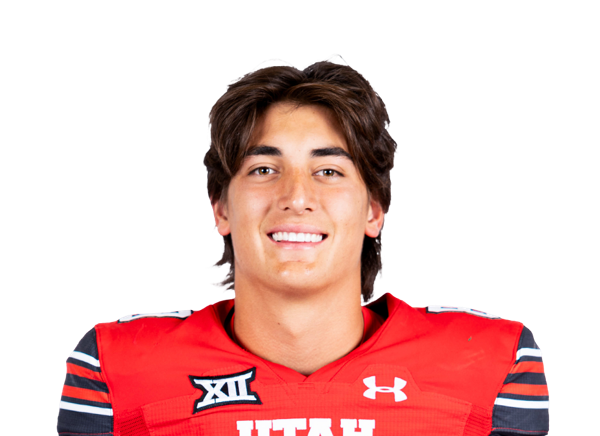 E. Elliss LB
Sacks
 C. Willich LB
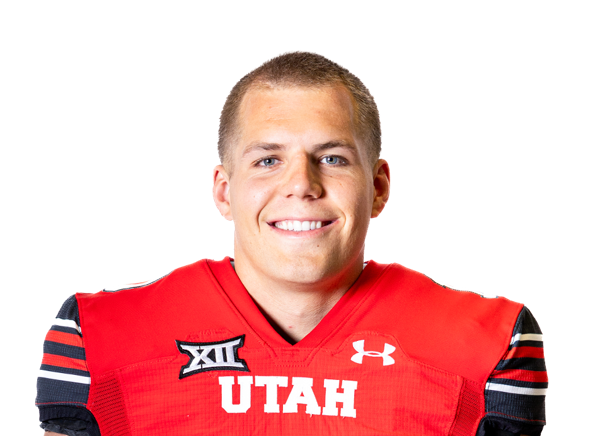 T. Reynolds LB
Tackles
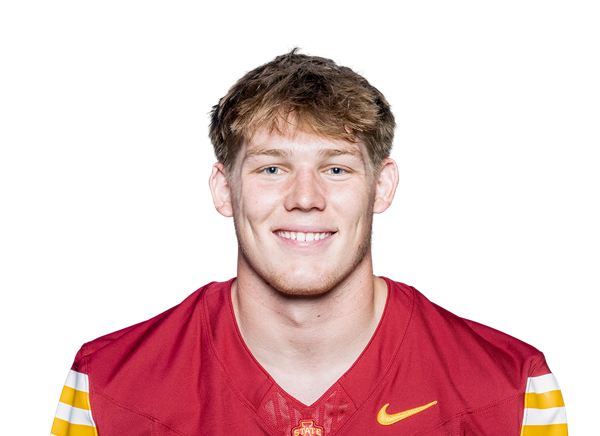 S. Schlimgen LB
Player Box Score
Utah| Player | C/ATT | YDS | AVG | TD | INT | QBR |
|---|---|---|---|---|---|---|
| Devon Dampier#4 | 18/27 | 206 | 7.6 | 2 | 0 | 78.0 |
Iowa State| Player | C/ATT | YDS | AVG | TD | INT | QBR |
|---|---|---|---|---|---|---|
| Jaylen Raynor#1 | 21/40 | 205 | 5.1 | 1 | 2 | 70.8 |
Utah| Player | CAR | YDS | AVG | TD | LONG |
|---|---|---|---|---|---|
| Wayshawn Parker#1 | 18 | 174 | 9.7 | 2 | 54 |
| Devon Dampier#4 | 7 | 21 | 3.0 | 0 | 9 |
 Daniel Bray#5 | 4 | 6 | 1.5 | 0 | 6 |
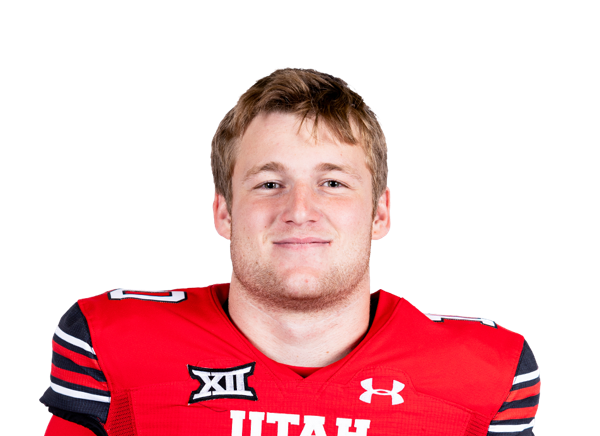 Hunter Andrews#10 | 1 | 4 | 4.0 | 0 | 4 |
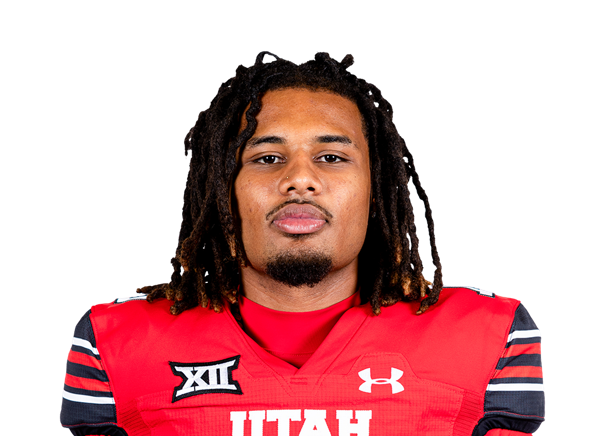 Byrd Ficklin#15 | 1 | 2 | 2.0 | 0 | 2 |
 Team | 2 | -2 | -1.0 | 0 | 0 |
Iowa State| Player | CAR | YDS | AVG | TD | LONG |
|---|---|---|---|---|---|
| Aiden Flora#21 | 13 | 54 | 4.2 | 0 | 18 |
| Jaylen Raynor#1 | 10 | 27 | 2.7 | 1 | 12 |
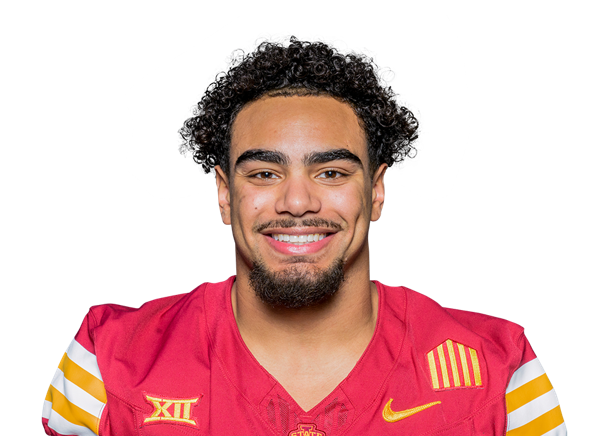 Cameron Pettaway | 4 | 17 | 4.3 | 0 | 11 |
 Connor Moberly#5 | 1 | 7 | 7.0 | 0 | 7 |
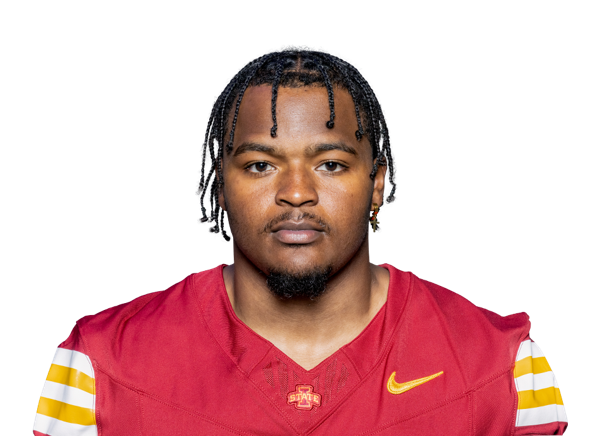 Arnold Barnes III#3 | 3 | 6 | 2.0 | 0 | 4 |
 Easton Miller#25 | 2 | 0 | 0.0 | 0 | 0 |
Utah| Player | REC | YDS | AVG | TD | LONG |
|---|---|---|---|---|---|
| Wayshawn Parker#1 | 5 | 65 | 13.0 | 1 | 22 |
 Creed Whittemore#2 | 3 | 44 | 14.7 | 0 | 30 |
 Braden Pegan#7 | 2 | 29 | 14.5 | 1 | 24 |
| Daniel Bray#5 | 3 | 24 | 8.0 | 0 | 12 |
 Noah Bennee#89 | 2 | 18 | 9.0 | 0 | 11 |
 Ricky Johnson#11 | 2 | 16 | 8.0 | 0 | 15 |
| Hunter Andrews#10 | 1 | 10 | 10.0 | 0 | 10 |
Iowa State| Player | REC | YDS | AVG | TD | LONG |
|---|---|---|---|---|---|
| Omari Hayes#9 | 5 | 55 | 11.0 | 0 | 18 |
| Aiden Flora#21 | 5 | 53 | 10.6 | 0 | 30 |
 Dominic Overby#11 | 3 | 42 | 14.0 | 1 | 22 |
 Cody Jackson#2 | 4 | 31 | 7.8 | 0 | 12 |
| Cameron Pettaway | 1 | 13 | 13.0 | 0 | 13 |
 Ty Claiborne#89 | 1 | 5 | 5.0 | 0 | 5 |
 Tyler Fortenberry#19 | 1 | 4 | 4.0 | 0 | 4 |
 Jamal Polite Jr.#13 | 1 | 2 | 2.0 | 0 | 2 |
Utah| Player | TOT | SOLO | SACKS | TFL | PD | QB HUR | TD |
|---|---|---|---|---|---|---|---|
| Trey Reynolds#10 | 8 | 6 | 0 | 2 | 0 | 0 | 0 |
 Johnathan Hall#7 | 8 | 5 | 0 | 0 | 1 | 0 | 0 |
| Elijah Elliss#83 | 7 | 3 | 1 | 1 | 1 | 0 | 0 |
 Jireh Moe#90 | 6 | 3 | 0 | 1.5 | 0 | 0 | 0 |
 Elijah Davis#9 | 5 | 5 | 0 | 0 | 1 | 0 | 0 |
 Cyrus Polu | 4 | 2 | 0 | 0 | 0 | 0 | 0 |
 Nate Ritchie#6 | 4 | 1 | 0 | 0 | 0 | 0 | 0 |
 Ethan Day#8 | 3 | 1 | 0 | 0 | 1 | 0 | 0 |
 Jackson Bennee#23 | 3 | 1 | 0 | 0 | 1 | 0 | 0 |
 Lance Holtzclaw#15 | 3 | 0 | 0 | 0.5 | 1 | 0 | 0 |
 James Chenault Jr.#5 | 2 | 2 | 0 | 0 | 0 | 0 | 0 |
 Karson Kaufusi#51 | 2 | 2 | 0 | 1 | 0 | 0 | 0 |
 Elijah Reed#11 | 2 | 1 | 0 | 0 | 0 | 0 | 0 |
 Rabbit Evans#1 | 2 | 1 | 0 | 0 | 1 | 0 | 0 |
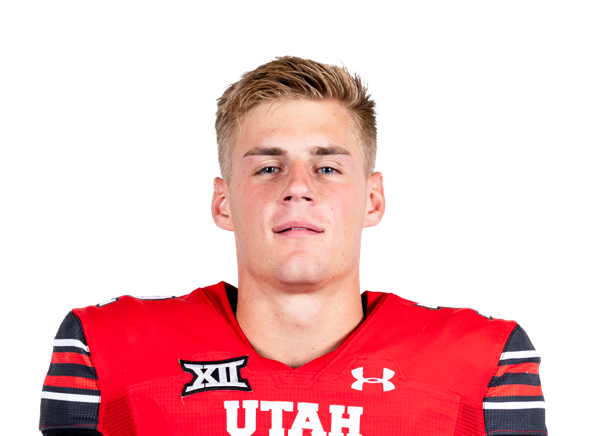 Davis Andrews#12 | 2 | 0 | 0 | 0 | 0 | 0 | 0 |
 Pupu Sepulona#45 | 1 | 1 | 0 | 0 | 0 | 0 | 0 |
 Mateaki Helu#20 | 1 | 1 | 0 | 0 | 0 | 0 | 0 |
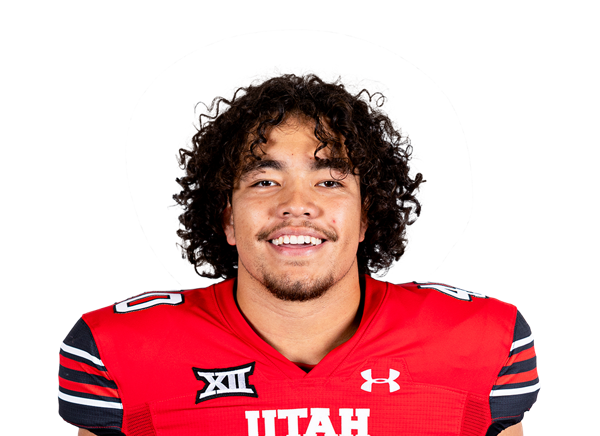 Paul Fitzgerald#40 | 1 | 0 | 0 | 0 | 0 | 0 | 0 |
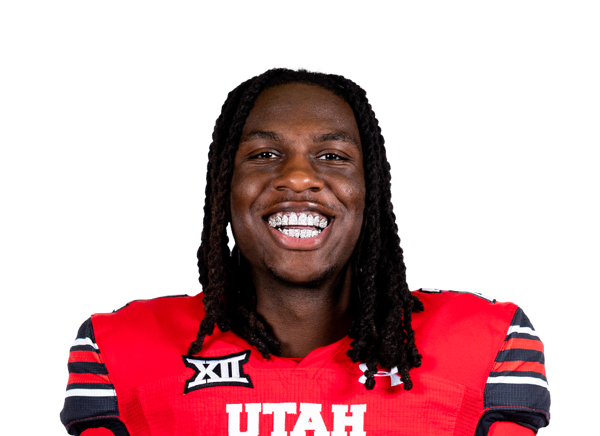 Nate Tilmon#21 | 1 | 0 | 0 | 0 | 0 | 0 | 0 |
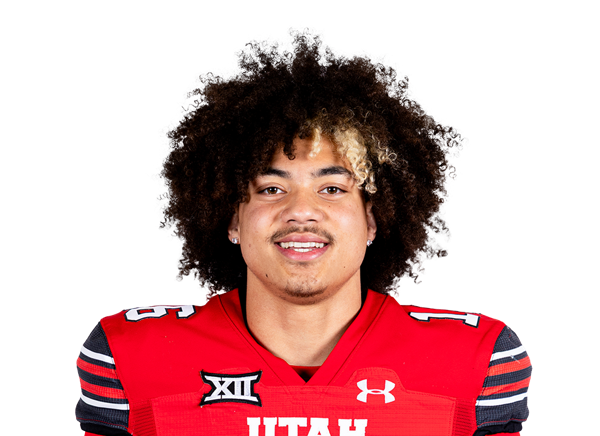 PJ Takitaki#16 | 1 | 0 | 0 | 0 | 0 | 0 | 0 |
 Brock Fonoimoana#53 | 1 | 0 | 0 | 0 | 0 | 0 | 0 |
 Kash Dillon#93 | 0 | 0 | 0 | 0 | 1 | 0 | 0 |
Iowa State| Player | TOT | SOLO | SACKS | TFL | PD | QB HUR | TD |
|---|---|---|---|---|---|---|---|
| Sullivan Schlimgen#7 | 12 | 7 | 0 | 1 | 1 | 0 | 0 |
 Duhron Goodman#21 | 9 | 6 | 0 | 0.5 | 0 | 0 | 0 |
 Brody Miller#24 | 8 | 2 | 0 | 0.5 | 0 | 0 | 0 |
| Carson Willich#10 | 5 | 3 | 1 | 1 | 0 | 0 | 0 |
 David Coffey#18 | 4 | 4 | 0 | 0 | 0 | 0 | 0 |
 Beau Goodwin#34 | 4 | 2 | 0 | 0 | 0 | 0 | 0 |
 Jace Gilbert#55 | 3 | 2 | 0 | 0 | 0 | 1 | 0 |
 Beni Ngoyi#5 | 2 | 2 | 0 | 0 | 0 | 0 | 0 |
 Willie Breland III#11 | 2 | 2 | 0 | 0 | 0 | 0 | 0 |
 Micah Harper#4 | 2 | 0 | 0 | 0 | 0 | 0 | 0 |
 Max Baloun#97 | 1 | 1 | 0 | 0 | 0 | 0 | 0 |
| Omari Hayes#9 | 1 | 1 | 0 | 0 | 0 | 0 | 0 |
 Donovan Fitzmaurice#89 | 1 | 1 | 0 | 1 | 0 | 1 | 0 |
 Tyrone Cotton III#26 | 1 | 1 | 0 | 0 | 0 | 0 | 0 |
 Bradley Esser#36 | 1 | 1 | 0 | 0 | 0 | 0 | 0 |
| Jamal Polite Jr.#13 | 1 | 1 | 0 | 0 | 0 | 0 | 0 |
 Caleb Schmidt#56 | 1 | 1 | 0 | 0 | 0 | 0 | 0 |
 Isaac Terrell#88 | 1 | 0 | 0 | 0 | 0 | 0 | 0 |
 Bryson Lamb#99 | 1 | 0 | 0 | 0 | 0 | 0 | 0 |
 Kyle Konrardy#97 | 1 | 0 | 0 | 0 | 0 | 0 | 0 |
 Jack Janikowski#93 | 1 | 0 | 0 | 0 | 0 | 1 | 0 |
 Keyon Washington#1 | 1 | 0 | 0 | 0 | 0 | 0 | 0 |
 Zaimir Hawk | 0 | 0 | 0 | 0 | 0 | 1 | 0 |
 Seth Johnson#3 | 0 | 0 | 0 | 0 | 1 | 0 | 0 |
Utah| Player | FUM | LOST | REC |
|---|---|---|---|
| Team | 1 | 0 | 0 |
Utah| Player | FG | PCT | LONG | XP | PTS |
|---|---|---|---|---|---|
 Dillon Curtis#17 | 1/2 | 50.0 | 27 | 4/4 | 7 |
Iowa State| Player | FG | PCT | LONG | XP | PTS |
|---|---|---|---|---|---|
| Kyle Konrardy#97 | 1/1 | 100.0 | 47 | 2/2 | 5 |
Utah| Player | NO | YDS | AVG | TB | In 20 | LONG |
|---|---|---|---|---|---|---|
 Orion Phillips#92 | 4 | 155 | 38.8 | 0 | 2 | 43 |
Iowa State| Player | NO | YDS | AVG | TB | In 20 | LONG |
|---|---|---|---|---|---|---|
 Jonah DuPont#99 | 3 | 121 | 40.3 | 0 | 1 | 47 |
 Ethan Gurney#95 | 1 | 30 | 30.0 | 0 | 1 | 30 |
Utah| Player | NO | YDS | AVG | LONG | TD |
|---|---|---|---|---|---|
| Cyrus Polu | 1 | 36 | 36.0 | 36 | 0 |
| Daniel Bray#5 | 1 | 15 | 15.0 | 15 | 0 |
Iowa State| Player | NO | YDS | AVG | LONG | TD |
|---|---|---|---|---|---|
| Cameron Pettaway | 3 | 65 | 21.7 | 24 | 0 |
Utah| Player | NO | YDS | AVG | LONG | TD |
|---|---|---|---|---|---|
 Mana Carvalho#8 | 2 | 9 | 4.5 | 9 | 0 |
Iowa State| Player | NO | YDS | AVG | LONG | TD |
|---|---|---|---|---|---|
| Aiden Flora#21 | 1 | 0 | 0.0 | 0 | 0 |
Utah| Player | INT | YDS | TD |
|---|---|---|---|
| Braden Pegan#7 | 1 | 5 | 0 |
| Jackson Bennee#23 | 1 | 3 | 0 |
Drive Summary
UTAH
Touchdown
54
ISU
Punt
30
UTAH
Punt
19
ISU
Punt
27
UTAH
Touchdown
90
ISU
Downs
23
UTAH
Field Goal
39
ISU
Field Goal
46
UTAH
Touchdown
75
ISU
Interception
32
ISU
Touchdown
82
UTAH
Punt
35
ISU
Punt
30
UTAH
Punt
7
ISU
Touchdown
81
UTAH
Punt
23
ISU
Punt
-4
UTAH
Touchdown
61
ISU
Interception
0
UTAH
Missed FG
25
ISU
Downs
8
UTAH
End of Half
-2
Injury Report
No current injury report is available for this matchup.
Head-to-Head
Historical meetings are not available for this matchup.
Game Information
StageWeek 4
Season2026
KickoffSat, Sep 26, 3:30 pm
VenueJack Trice Stadium
LocationAmes, IA
SurfaceGrass
BroadcastFOX
Attendance52,150
Division Standings
FBS — Big 12 Conference
| Team | W | L | T | Pct | PF | PA | Home | Away | Strk |
|---|---|---|---|---|---|---|---|---|---|
 Cincinnati | 5 | 5 | 0 | 0.500 | 310 | 306 | 5-1 | 0-4 | L3 |
 Texas Tech | 8 | 1 | 0 | 0.889 | 338 | 217 | 6-0 | 2-1 | W2 |
| Utah | 9 | 0 | 0 | 1.000 | 339 | 147 | 6-0 | 3-0 | W9 |
 BYU | 8 | 2 | 0 | 0.800 | 307 | 185 | 6-0 | 2-2 | W1 |
 Baylor | 6 | 4 | 0 | 0.600 | 294 | 181 | 4-1 | 2-3 | L1 |
 Oklahoma State | 6 | 3 | 0 | 0.667 | 395 | 245 | 4-0 | 2-3 | W1 |
 UCF | 5 | 5 | 0 | 0.500 | 284 | 260 | 4-2 | 1-3 | L1 |
 Arizona State | 6 | 4 | 0 | 0.600 | 282 | 259 | 4-1 | 2-3 | W2 |
 Arizona | 7 | 2 | 0 | 0.778 | 308 | 179 | 5-0 | 2-2 | W1 |
 Houston | 7 | 3 | 0 | 0.700 | 351 | 234 | 5-0 | 2-3 | L1 |
 Kansas State | 4 | 6 | 0 | 0.400 | 292 | 261 | 4-2 | 0-4 | L4 |
 West Virginia | 5 | 5 | 0 | 0.500 | 349 | 348 | 3-3 | 2-2 | L2 |
 Colorado | 4 | 6 | 0 | 0.400 | 220 | 287 | 3-2 | 1-4 | W1 |
| Iowa State | 5 | 5 | 0 | 0.500 | 304 | 273 | 5-1 | 0-4 | W1 |
 TCU | 5 | 5 | 0 | 0.500 | 234 | 152 | 4-3 | 1-2 | W1 |
 Kansas | 4 | 6 | 0 | 0.400 | 302 | 237 | 3-3 | 1-3 | W1 |
Utah
1st in Big 12
VS
Iowa State
9th in Big 12
Quarterbacks & Specialists
#4
Devon Dampier
#15
Byrd Ficklin
#92
Orion Phillips
Receivers & Backs
#10
Hunter Andrews
#89
Noah Bennee
#5
Daniel Bray
#8
Mana Carvalho
#20
Mateaki Helu
#11
Ricky Johnson
#1
Wayshawn Parker
#7
Braden Pegan
#2
Creed Whittemore
Defensive Line & Linebackers
#8
Ethan Day
#93
Kash Dillon
#83
Elijah Elliss
#40
Paul Fitzgerald
#53
Brock Fonoimoana
#7
Johnathan Hall
#15
Lance Holtzclaw
#51
Karson Kaufusi
#90
Jireh Moe
Cyrus Polu
#10
Trey Reynolds
#45
Pupu Sepulona
#16
PJ Takitaki
Defensive Backs
#12
Davis Andrews
#23
Jackson Bennee
#5
James Chenault Jr.
#9
Elijah Davis
#1
Rabbit Evans
#11
Elijah Reed
#6
Nate Ritchie
#21
Nate Tilmon
Other
#17
Dillon Curtis
Quarterbacks & Specialists
#99
Jonah DuPont
#95
Ethan Gurney
#5
Connor Moberly
#1
Jaylen Raynor
#56
Caleb Schmidt
Receivers & Backs
#3
Arnold Barnes III
#89
Ty Claiborne
#21
Aiden Flora
#19
Tyler Fortenberry
#9
Omari Hayes
#2
Cody Jackson
#25
Easton Miller
#11
Dominic Overby
Cameron Pettaway
#13
Jamal Polite Jr.
Defensive Line & Linebackers
#97
Max Baloun
#11
Willie Breland III
#36
Bradley Esser
#89
Donovan Fitzmaurice
#55
Jace Gilbert
#34
Beau Goodwin
Zaimir Hawk
#93
Jack Janikowski
#99
Bryson Lamb
#7
Sullivan Schlimgen
#88
Isaac Terrell
#10
Carson Willich
Defensive Backs
#18
David Coffey
#26
Tyrone Cotton III
#21
Duhron Goodman
#4
Micah Harper
#3
Seth Johnson
#24
Brody Miller
#5
Beni Ngoyi
#1
Keyon Washington
Other
#97
Kyle Konrardy
Utah
1st in Big 12
VS
Iowa State
9th in Big 12
Passing
65.9
Completion Percentage
59.5
197
Completions
160
2.70
Interception Percentage
2.20
8
Interceptions
6
70
Longest Pass
70
2,478
Net Passing Yards
2,069
247.8
Net Passing Yards Per Game
206.9
299
Passing Attempts
269
8.00
Passing Touchdown %
5.60
24
Passing Touchdowns
15
156.7
Passer Rating
138.2
15
Total Sacks
20
70
Sack Yards Lost
128
8.3
Yards Per Pass Attempt
7.7
2,478
Passing Yards
2,069
0
Passing Fumbles Lost
0
10
Team Games Played
10
471.3
Yards Per Game
398.3
37.9
Total Points Per Game
30.4
379
Total Points
304
51
Total Touchdowns
37
247.8
Passing Yards Per Game
206.9
197-299
Comp-Att
160-269
15-70
Sacks-Yards Lost
20-128
Rushing
386
Rushing Attempts
380
2,235
Rushing Yards
1,914
5.8
Yards Per Rush Attempt
5.0
90
Long Rushing
77
0
20+ Yard Rushing Plays
0
25
Rushing Touchdowns
20
223.5
Rushing Yards Per Game
191.4
0
Rushing Fumbles
0
0
Rushing Fumbles Lost
0
113
Rushing 1st downs
98
10
Team Games Played
10
4,713
Total Yards
3,983
700
Total Offensive Plays
669
37.9
Total Points Per Game
30.4
379
Total Points
304
51
Total Touchdowns
37
Receiving
197
Receptions
160
0
Receiving Targets
0
2,478
Receiving Yards
2,069
2,478
Receiving Yards
2,069
24
Receiving Touchdowns
15
70
Long Reception
70
0
20+ Yard Receiving Plays
0
247.8
Receiving Yards Per Game
206.9
0
Receiving Fumbles
0
0
Receiving Fumbles Lost
0
1207
Receiving Yards After Catch
1000
112
Receiving First Downs
85
10
Team Games Played
10
12.6
Yards Per Reception
12.9
37.9
Total Points Per Game
30.4
379
Total Points
304
51
Total Touchdowns
37
Miscellaneous
245
Total 1st downs
204
113
Rushing 1st downs
98
112
Passing 1st downs
85
20
1st downs by penalty
21
66
Third Down Conversions
45
125
Third Down Attempts
130
52.80
3rd down %
34.62
6
Fourth Down Conversions
10
14
First Downs Attempts
18
42.86
4th down %
55.56
56
Total Penalties
54
463
Total Penalty Yards
462
19042
Possession Time Seconds
18697
0.00
Red Zone Field Goal Percentage
0.00
0.00
Red Zone Scoring Percentage
0.00
0.00
Red Zone Efficiency Percentage
0.00
0.00
Red Zone Touchdown Percentage
0.00
12
Total Takeaways
15
15
Total Giveaways
9
-3
Turnover Ratio
6
0
Fumbles Lost
0
66-125
3rd down efficiency
45-130
6-14
4th down efficiency
10-18
56-463
Total-Yards
54-462
Defense
301
Solo Tackles
334
294
Assist Tackles
306
595
Total Tackles
640
21
Sacks
16
160
Sack Yards
100
71
Stuffs
66
53
Passes Defended
31
11.0
Average Interception Yards
4.3
39
Long Interception
7
0
Miscellaneous Touchdowns
0
0
Kicks Blocked
0
31
Tackles For Loss
37
10
Team Games Played
10
Defensive Interceptions
14
Interceptions
3
154
Interception Yards
13
1
Interception Touchdowns
0
14-154
INT: Total
3-13
General
15
Fumbles
6
2
Forced Fumbles
9
4
Fumbles Recovered
9
1
Fumbles Touchdowns
0
10
Games Played
10
15-0
Fumbles-Lost
6-0
Returning
10
Kick Returns
14
152
Kick Return Yards
354
15.2
Yards Per Kick Return
25.3
36
Long Kick Return
100
0
Kick Return Touchdowns
1
18
Punt Returns
12
103
Punt Return Yards
156
5.7
Yards Per Punt Return
13.0
25
Long Punt Return
66
0
Punt Return Touchdowns
1
0
Punt Return Fair Catches
0
0
Kick Return Fumbles Lost
0
0
Punt Return Fumbles Lost
0
10
Team Games Played
10
18-103
Punt: Total
12-156
Kicking
8
Field Goal Made
15
11
Field Goal Attempts
20
72.7
Field Goal Percentage
75.0
54
Long Field Goal Made
57
0
Field Goal Attempts 1-19
0
5
Field Goal Attempts 20-29
4
4
Field Goal Attempts 30-39
6
0
Field Goal Attempts 40-49
7
2
Field Goal Attempts 50+
3
47
Extra Points Made
35
48
Extra Point Attempts
35
97.9
Extra Point Percentage
100.0
0
Field Goals Made 1-19
0
4
Field Goals Made 20-29
4
2
Field Goals Made 30-39
5
0
Field Goals Made 40-49
4
2
Field Goals Made 50+
2
71
Total Kicking Points
80
10
Team Games Played
10
78
Touchback Percentage
86
0.0
Average Kickoff Return Yards
0.0
0
Kickoff Return Yards
0
0
Kickoff Returns
0
0-0
Kickoffs: Total
0-0
8-11
FG: Good-Attempts
15-20
Punting
30
Punts
45
1,316
Punt Yards
1,924
84
Long Punt
60
43.9
Gross Average Punt Yards
42.8
43.9
Net Average Punt Yards
42.8
0
Punts Blocked
0
13
Punts Inside 20
12
1
Touchbacks
2
10
Fair Catches
17
6
Punt Returns
16
0
Punt Return Yards
0
0.0
Average Punt Return Yards
0.0
10
Team Games Played
10
30-1,316
Punt: Total Yards
45-1,924
Scoring
25
Rushing Touchdowns
20
24
Receiving Touchdowns
15
0
Return Touchdowns
2
50
Total Touchdowns
37
8
Field Goals
15
47
Kick Extra Points
35
1
Total Two Point Conversions
1
379
Total Points
304
37.9
Total Points Per Game
30.4