

UTEP vs Oklahoma Live Score (5 Sep, 2026)
Score by Quarter
| Team | Q1 | Q2 | Q3 | Q4 | Final |
|---|---|---|---|---|---|
 UTEP | 0 | 0 | 0 | 0 | 0 |
 Oklahoma | 21 | 6 | 17 | 7 | 51 |
Scoring Plays
Q1
9:16
9:16
Lloyd Avant 1 Yd Run (Tate Sandell Kick)
Rushing Touchdown
0 – 7
Q1
7:27
7:27
Isaiah Sategna III 88 Yd Punt Return (Tate Sandell Kick)
Punt Return Touchdown
0 – 14
Q1
1:01
1:01
Rocky Beers 40 Yd pass from John Mateer (Tate Sandell Kick)
Passing Touchdown
0 – 21
Q2
5:00
5:00
Tate Sandell 33 Yd Field Goal
Field Goal Good
0 – 24
Q2
1:42
1:42
Tate Sandell 32 Yd Field Goal
Field Goal Good
0 – 27
Q3
11:47
11:47
Isaiah Sategna III 34 Yd pass from John Mateer (Tate Sandell Kick)
Passing Touchdown
0 – 34
Q3
8:22
8:22
Trell Harris 48 Yd pass from John Mateer (Tate Sandell Kick)
Pass Reception
0 – 41
Q3
3:15
3:15
Liam Evans 34 Yd Field Goal
Field Goal Good
0 – 44
Q4
12:11
12:11
Whitt Newbauer 3 Yd Run (Liam Evans Kick)
Rushing Touchdown
0 – 51
Game Leaders
UTEPOklahoma
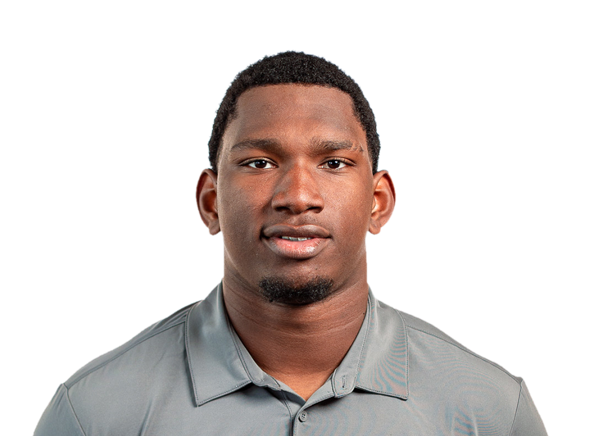 E. Colson Jr. QB
Passing Yards
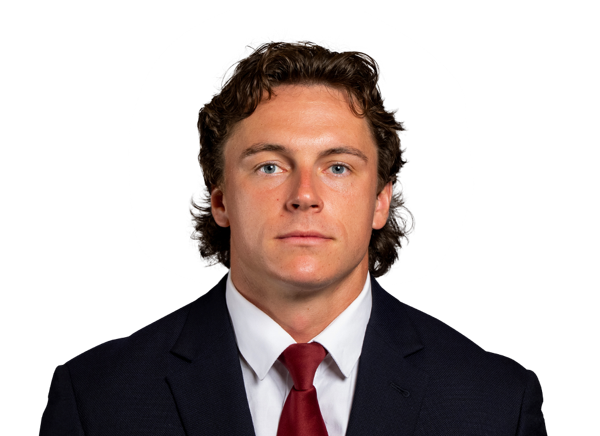 J. Mateer QB
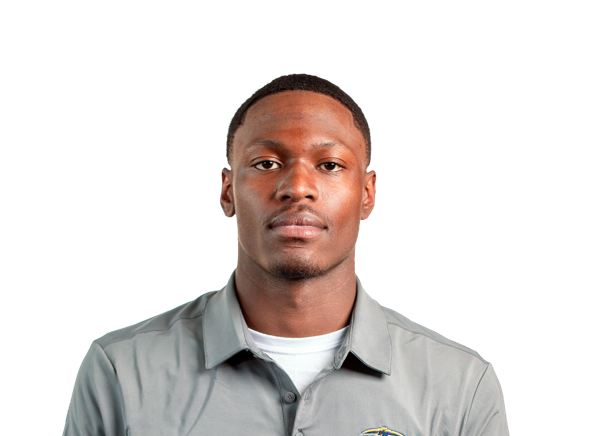 R. Moore III QB
Rushing Yards
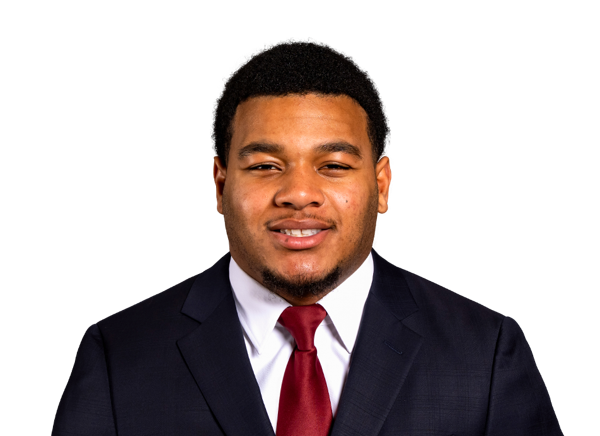 L. Avant RB
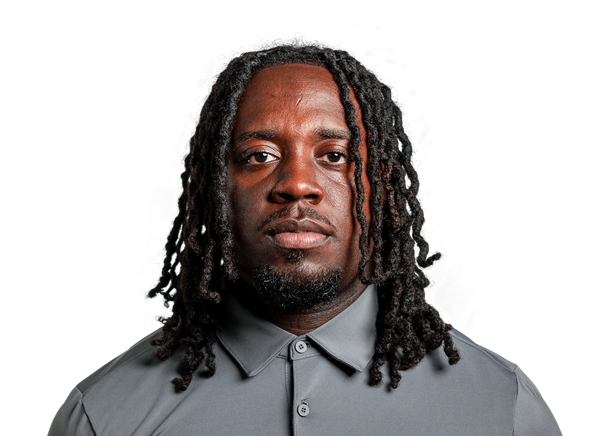 T. Jones RB
Receiving Yards
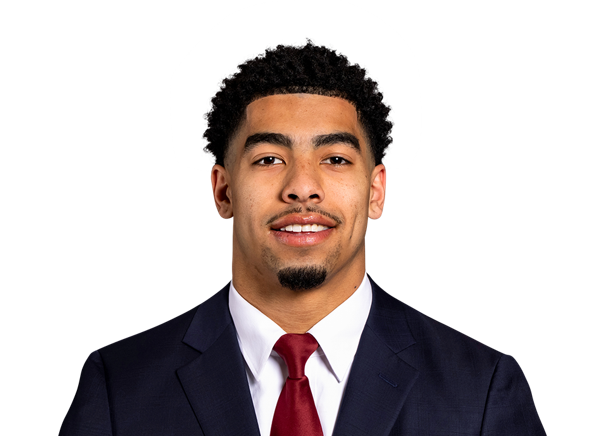 I. Sategna III WR
 D. Burns DL
Sacks
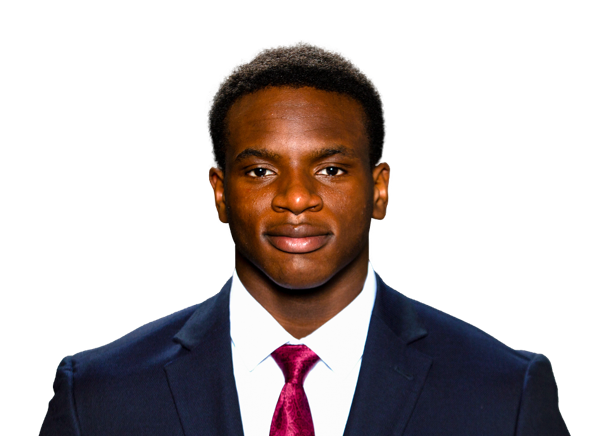 A. Adebawore DL
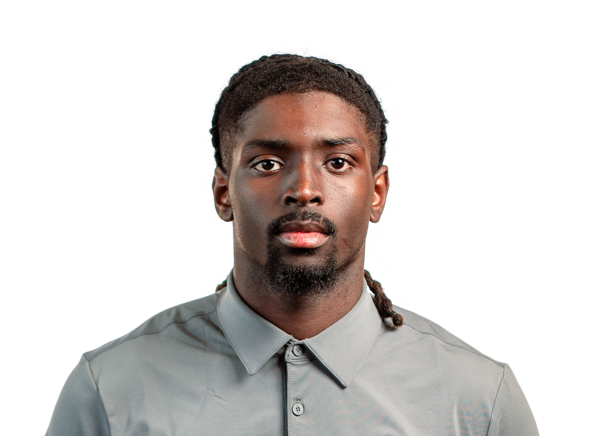 D. Howard S
Tackles
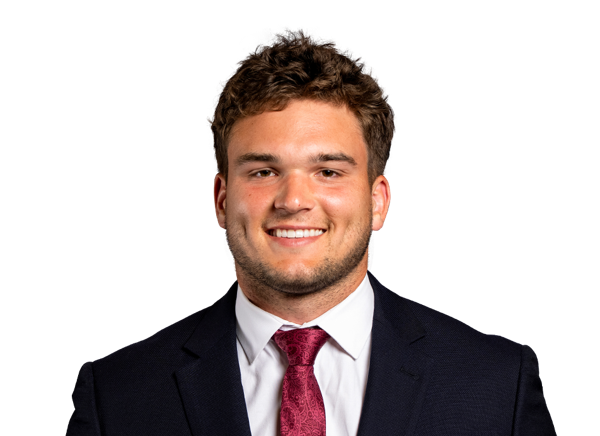 O. Heinecke LB
Player Box Score
UTEP| Player | C/ATT | YDS | AVG | TD | INT | QBR |
|---|---|---|---|---|---|---|
| EJ Colson Jr.#1 | 6/12 | 52 | 4.3 | 0 | 0 | 40.6 |
| Raymond Moore III#12 | 3/5 | 26 | 5.2 | 0 | 0 | 23.0 |
 Jaden Smith#3 | 1/1 | 8 | 8.0 | 0 | 0 | -- |
Oklahoma| Player | C/ATT | YDS | AVG | TD | INT | QBR |
|---|---|---|---|---|---|---|
| John Mateer#10 | 11/17 | 225 | 13.2 | 3 | 0 | 91.3 |
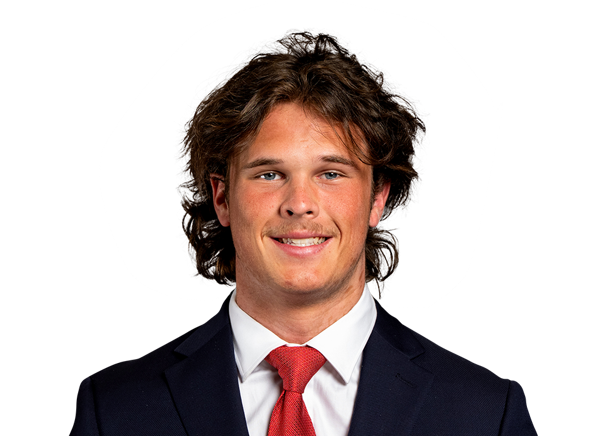 Whitt Newbauer#16 | 1/1 | 6 | 6.0 | 0 | 0 | -- |
 Bowe Bentley#8 | 0/1 | 0 | 0.0 | 0 | 0 | -- |
UTEP| Player | CAR | YDS | AVG | TD | LONG |
|---|---|---|---|---|---|
| Raymond Moore III#12 | 9 | 49 | 5.4 | 0 | 51 |
| EJ Colson Jr.#1 | 16 | 25 | 1.6 | 0 | 10 |
| Tavorus Jones | 5 | 24 | 4.8 | 0 | 23 |
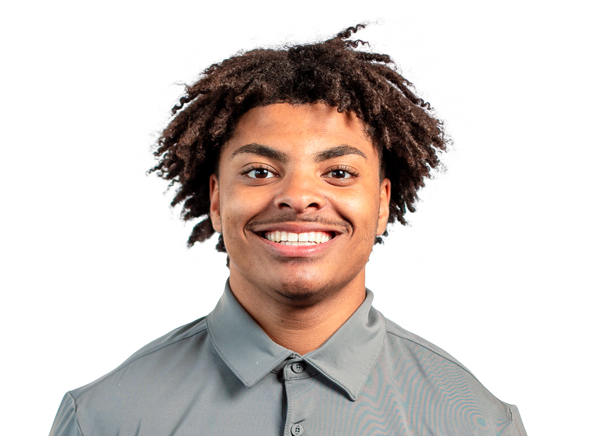 Nik Henry#13 | 1 | 10 | 10.0 | 0 | 10 |
 Lamar Sperling#32 | 4 | 7 | 1.8 | 0 | 6 |
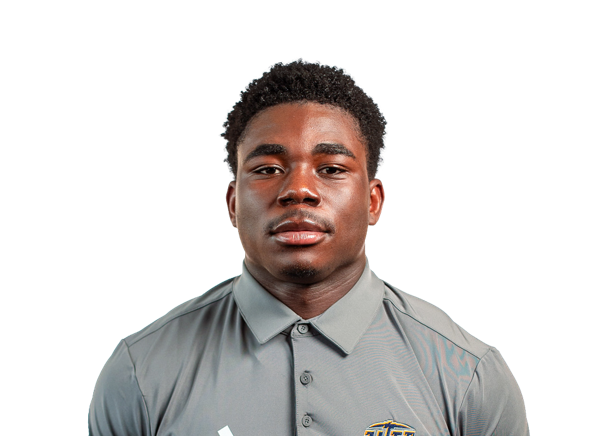 Elijah McCoy#6 | 2 | 2 | 1.0 | 0 | 2 |
 Kam Thomas#8 | 1 | -5 | -5.0 | 0 | 0 |
Oklahoma| Player | CAR | YDS | AVG | TD | LONG |
|---|---|---|---|---|---|
| Lloyd Avant#9 | 15 | 79 | 5.3 | 1 | 13 |
 Ben McCreary#23 | 6 | 40 | 6.7 | 0 | 24 |
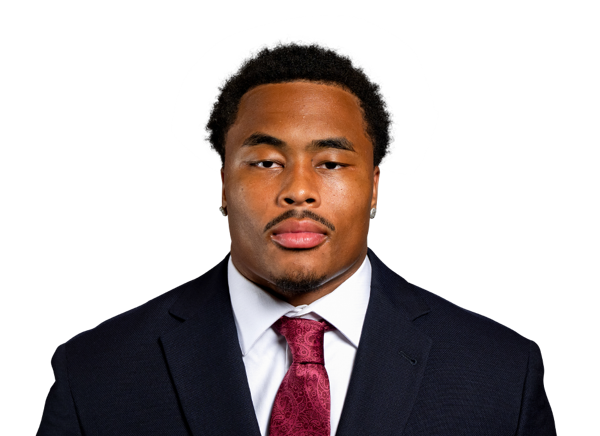 Xavier Robinson#21 | 7 | 30 | 4.3 | 0 | 11 |
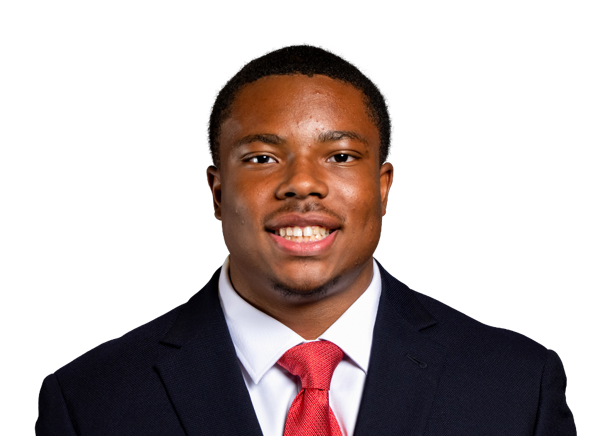 Jonathan Hatton Jr.#20 | 3 | 21 | 7.0 | 0 | 21 |
| John Mateer#10 | 3 | 7 | 2.3 | 0 | 5 |
| Whitt Newbauer#16 | 2 | 3 | 1.5 | 1 | 3 |
| Bowe Bentley#8 | 1 | -2 | -2.0 | 0 | 0 |
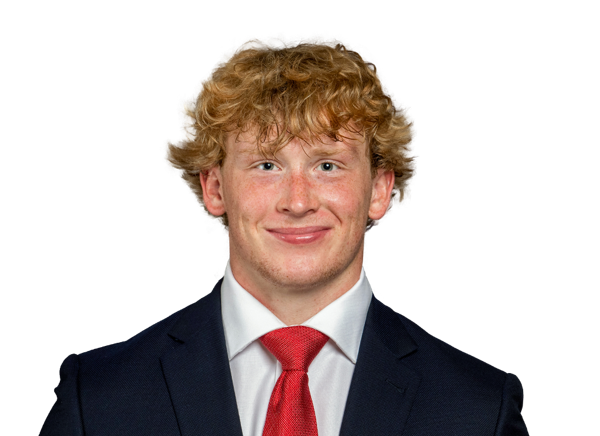 Andy Bass#25 | 2 | -8 | -4.0 | 0 | 5 |
UTEP| Player | REC | YDS | AVG | TD | LONG |
|---|---|---|---|---|---|
 Cash Cheeks#4 | 1 | 22 | 22.0 | 0 | 22 |
| Tavorus Jones | 3 | 22 | 7.3 | 0 | 11 |
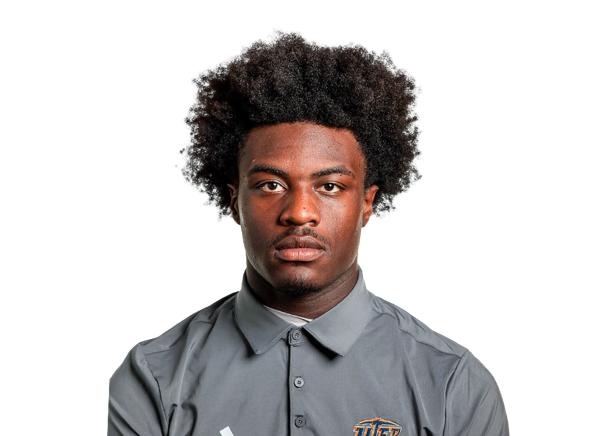 Royal Capell#2 | 2 | 15 | 7.5 | 0 | 12 |
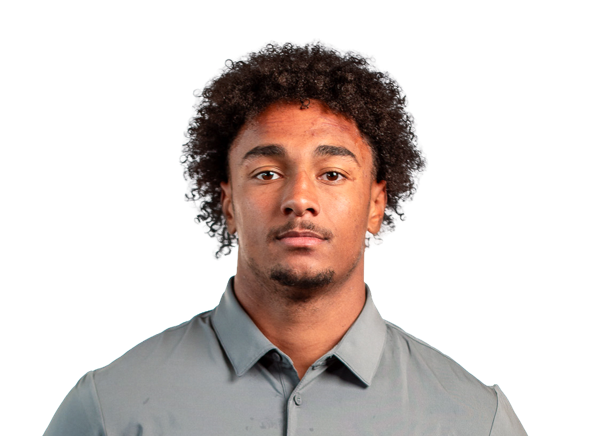 Carver Cheeks#5 | 2 | 13 | 6.5 | 0 | 8 |
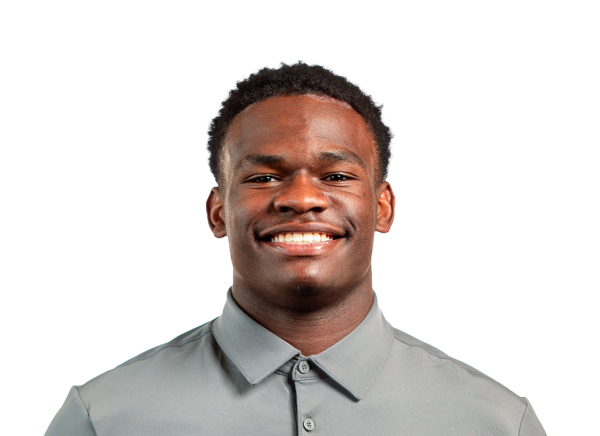 Decorian Thompson#18 | 1 | 8 | 8.0 | 0 | 8 |
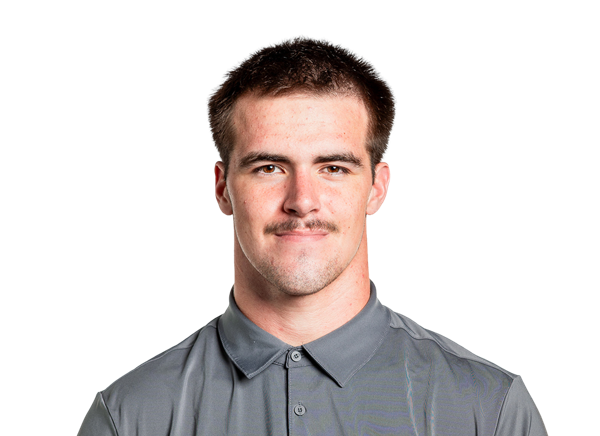 Jackson Stoner#85 | 1 | 6 | 6.0 | 0 | 6 |
Oklahoma| Player | REC | YDS | AVG | TD | LONG |
|---|---|---|---|---|---|
| Isaiah Sategna III#1 | 4 | 76 | 19.0 | 1 | 34 |
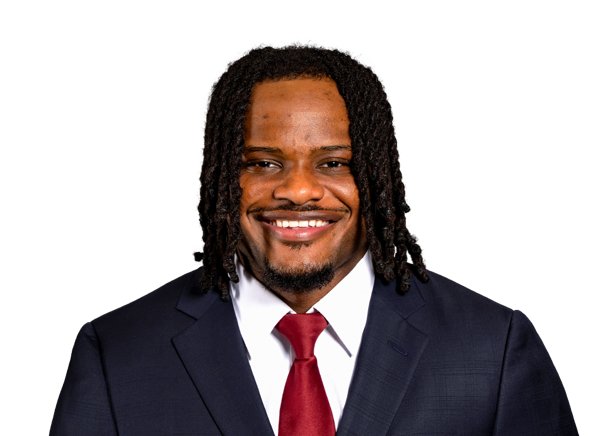 Trell Harris#11 | 2 | 61 | 30.5 | 1 | 48 |
 Rocky Beers#81 | 2 | 43 | 21.5 | 1 | 40 |
 Elijah Thomas#14 | 1 | 24 | 24.0 | 0 | 24 |
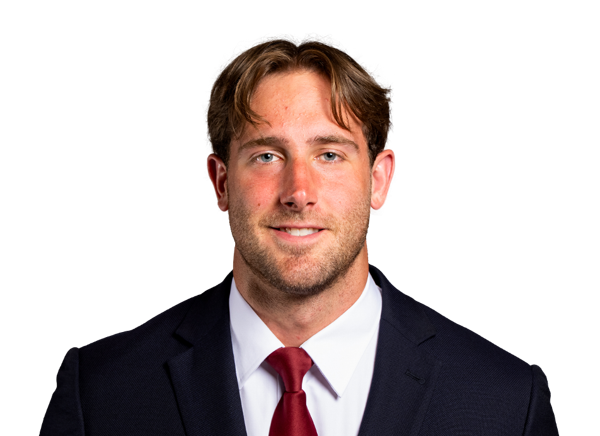 Hayden Hansen#89 | 1 | 15 | 15.0 | 0 | 15 |
| Lloyd Avant#9 | 1 | 6 | 6.0 | 0 | 6 |
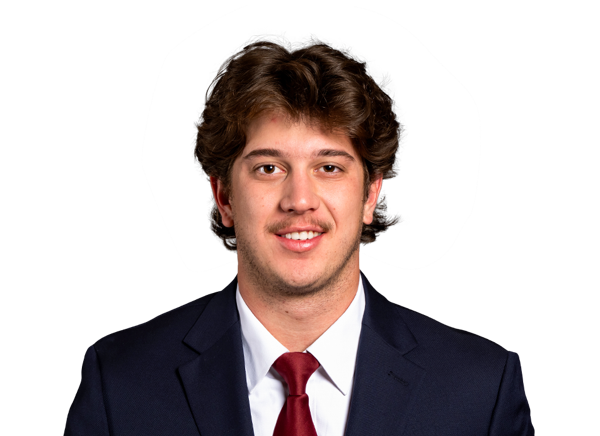 Parker Livingstone#3 | 1 | 6 | 6.0 | 0 | 6 |
UTEP| Player | TOT | SOLO | SACKS | TFL | PD | QB HUR | TD |
|---|---|---|---|---|---|---|---|
| Donavan Howard#12 | 6 | 2 | 0 | 0 | 0 | 0 | 0 |
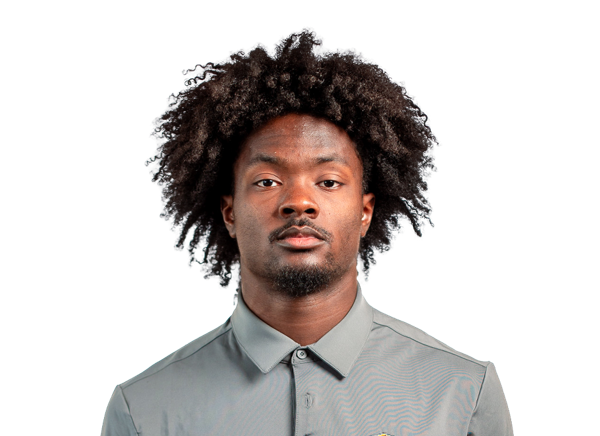 Kaleb Miles#23 | 5 | 5 | 0 | 0 | 0 | 0 | 0 |
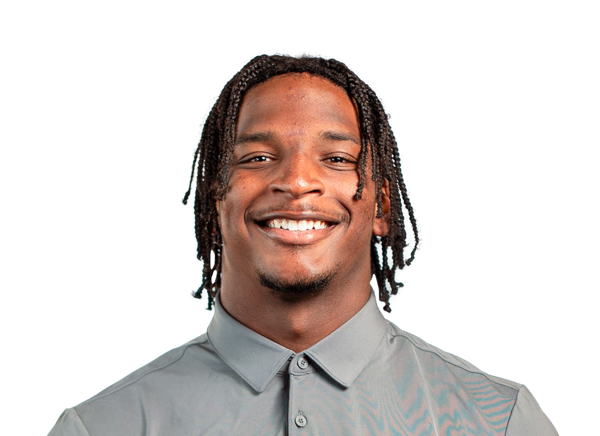 Isaiah Bogerty#13 | 4 | 1 | 0 | 0 | 0 | 0 | 0 |
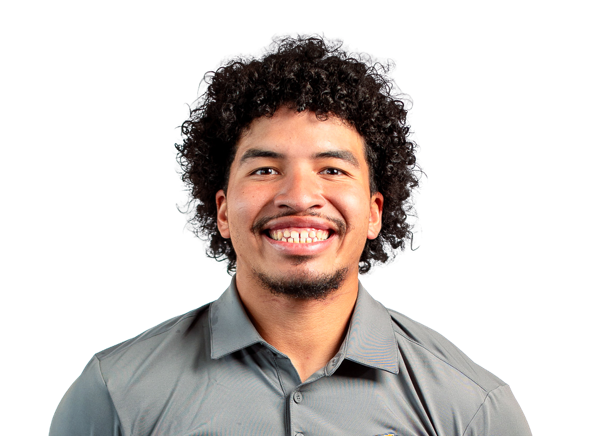 Shay Smith#8 | 4 | 1 | 0 | 0.5 | 0 | 0 | 0 |
 Darnell Williams#17 | 4 | 1 | 0 | 0 | 0 | 0 | 0 |
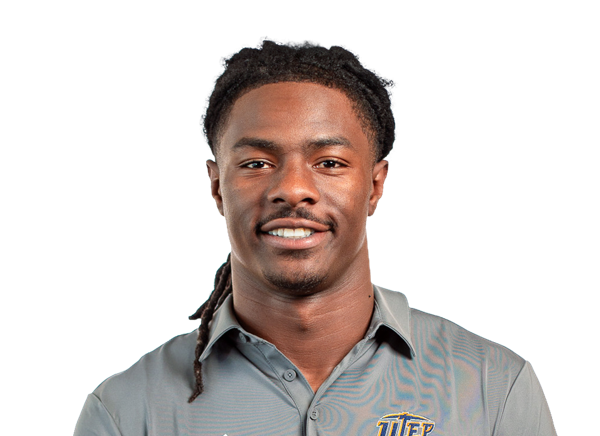 Xavier Smith#2 | 3 | 3 | 0 | 0 | 0 | 0 | 0 |
| Derek Burns#11 | 3 | 2 | 1 | 2 | 0 | 0 | 0 |
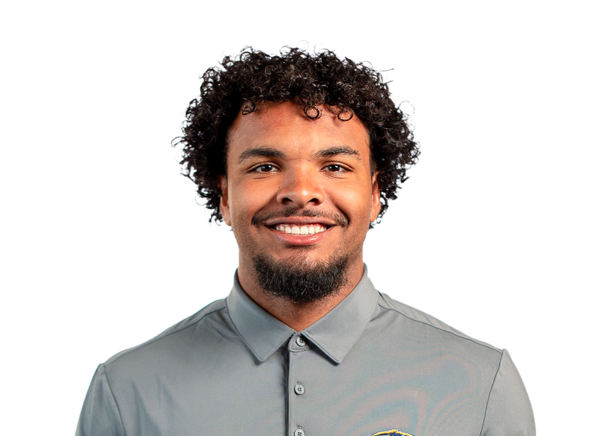 Esteban Guillory#16 | 3 | 2 | 0 | 1 | 0 | 0 | 0 |
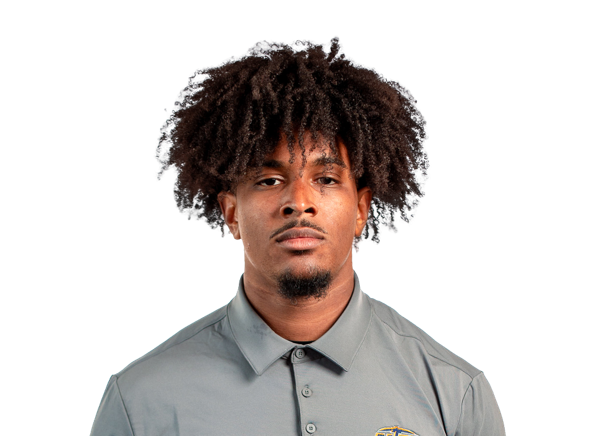 Shakaun Bowser#3 | 3 | 1 | 0 | 0.5 | 0 | 0 | 0 |
 Jayden Wilson#10 | 3 | 1 | 0 | 0.5 | 0 | 0 | 0 |
 Grant Stewart#20 | 3 | 1 | 0 | 0 | 0 | 0 | 0 |
 Elijah Fields#1 | 3 | 0 | 0 | 0.5 | 0 | 0 | 0 |
 Oryend Fisher#9 | 2 | 2 | 0 | 0 | 0 | 0 | 0 |
 Justin Content | 2 | 1 | 0 | 0 | 0 | 0 | 0 |
 Adarius Hutchinson#32 | 2 | 1 | 0 | 0 | 0 | 0 | 0 |
 Garrett Hawkins#4 | 2 | 0 | 0 | 0 | 0 | 0 | 0 |
 Royce Wilson#25 | 2 | 0 | 0 | 0 | 0 | 0 | 0 |
| Decorian Thompson#18 | 2 | 0 | 0 | 0 | 0 | 0 | 0 |
 Vashon Brunswick II#41 | 2 | 0 | 0 | 0 | 0 | 0 | 0 |
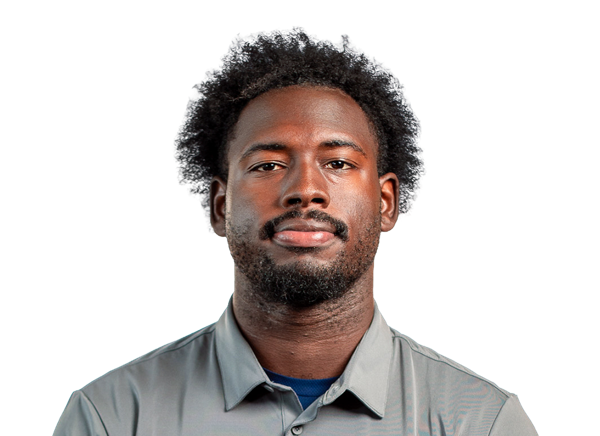 Chace Biddle#14 | 1 | 1 | 0 | 0 | 0 | 0 | 0 |
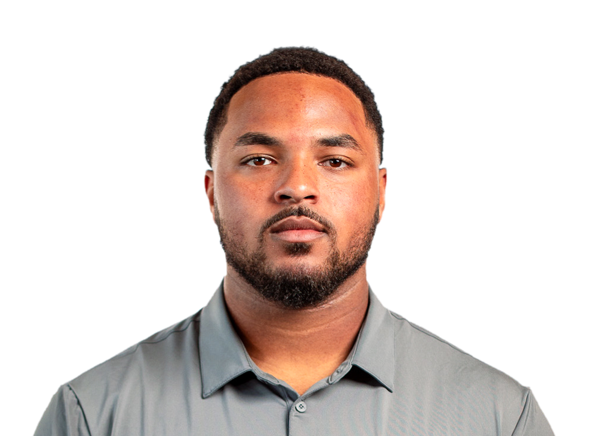 Ashton Coker#90 | 1 | 1 | 0 | 0 | 0 | 0 | 0 |
 LaTristan Thompson#27 | 1 | 1 | 0 | 0 | 1 | 0 | 0 |
 Sterling Miles#19 | 1 | 0 | 0 | 0 | 0 | 0 | 0 |
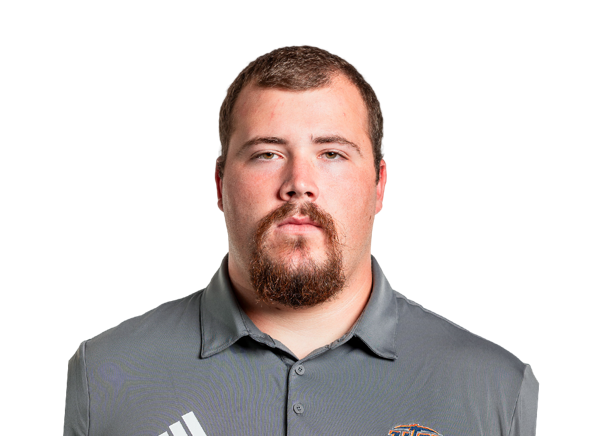 Preston Hickey#98 | 1 | 0 | 0 | 0 | 0 | 0 | 0 |
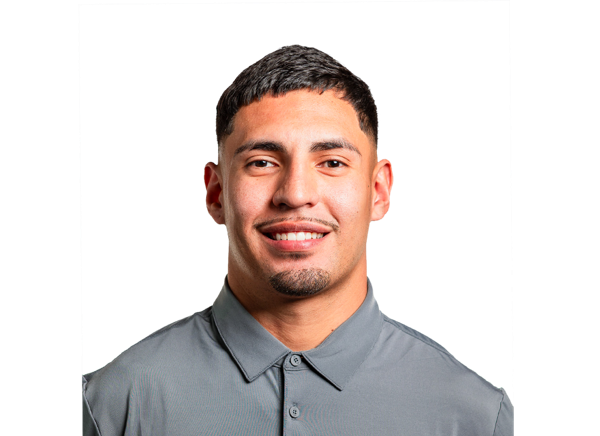 Jaime Guerrero#24 | 1 | 0 | 0 | 0 | 0 | 0 | 0 |
 Dycin Davis#21 | 1 | 0 | 0 | 0 | 0 | 0 | 0 |
 TJ Tillman#5 | 1 | 0 | 0 | 0 | 0 | 0 | 0 |
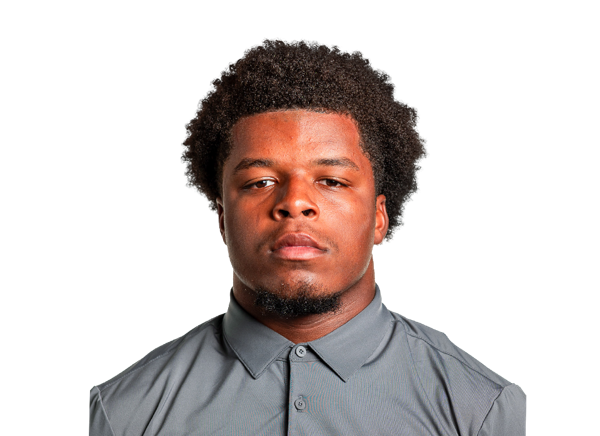 Leander Parrish#55 | 1 | 0 | 0 | 0 | 0 | 0 | 0 |
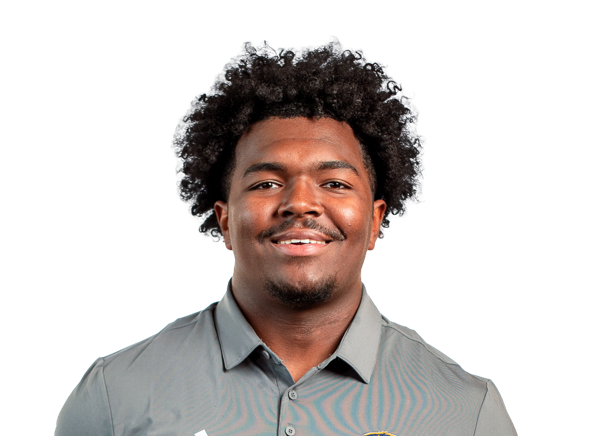 Copelin Windfont#42 | 1 | 0 | 0 | 0 | 0 | 0 | 0 |
 Jerrell Brasher#93 | 1 | 0 | 0 | 0 | 0 | 0 | 0 |
Oklahoma| Player | TOT | SOLO | SACKS | TFL | PD | QB HUR | TD |
|---|---|---|---|---|---|---|---|
 Reggie Powers III#3 | 7 | 4 | 0 | 1 | 0 | 0 | 0 |
| Owen Heinecke#38 | 7 | 2 | 0 | 0.5 | 0 | 1 | 0 |
 Taylor Wein#44 | 5 | 1 | 0 | 1.5 | 0 | 0 | 0 |
 Peyton Bowen#22 | 4 | 3 | 0 | 1 | 1 | 0 | 0 |
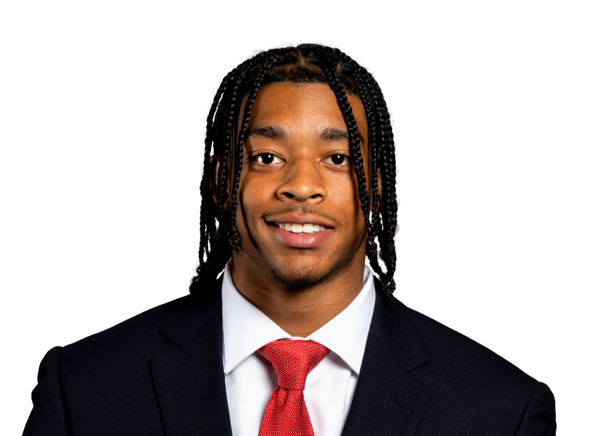 Courtland Guillory#4 | 4 | 3 | 0 | 0 | 1 | 0 | 0 |
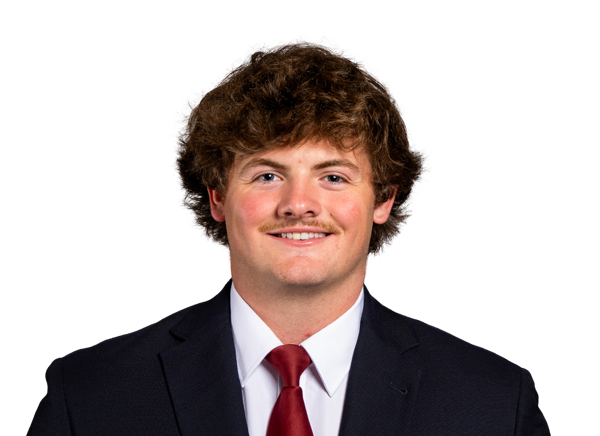 Wyatt Gilmore#42 | 4 | 2 | 0 | 1.5 | 0 | 0 | 0 |
 Dane Bathurst#30 | 4 | 1 | 1 | 1.5 | 0 | 0 | 0 |
 James Nesta#47 | 4 | 0 | 0 | 0 | 0 | 0 | 0 |
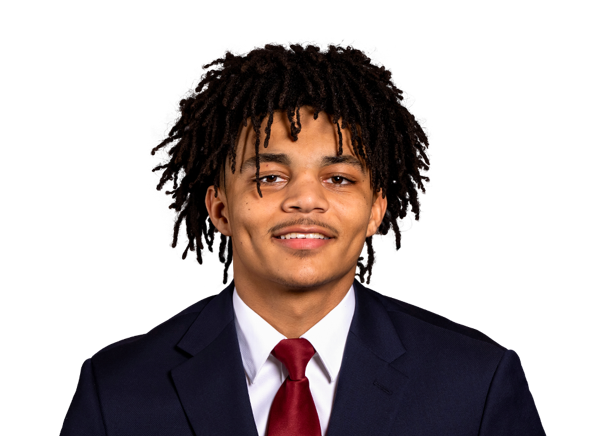 Markel Ford#5 | 3 | 2 | 0 | 0 | 0 | 0 | 0 |
| Adepoju Adebawore#34 | 3 | 1 | 1 | 1 | 0 | 0 | 0 |
 Jayden Jackson#65 | 3 | 1 | 0 | 0 | 0 | 0 | 0 |
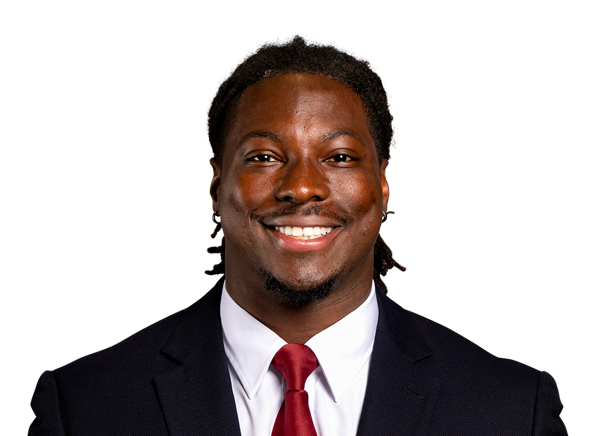 Kip Lewis#10 | 3 | 0 | 0.5 | 0.5 | 0 | 0 | 0 |
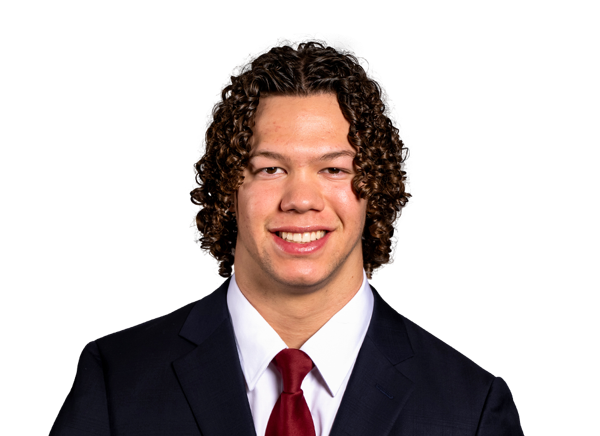 Niko Jandreau#13 | 2 | 2 | 0 | 0 | 0 | 0 | 0 |
 Eli Bowen#23 | 2 | 1 | 0 | 0 | 0 | 0 | 0 |
 David Stone | 2 | 1 | 0 | 0 | 0 | 0 | 0 |
 James Carrington#58 | 2 | 0 | 0.5 | 0.5 | 0 | 0 | 0 |
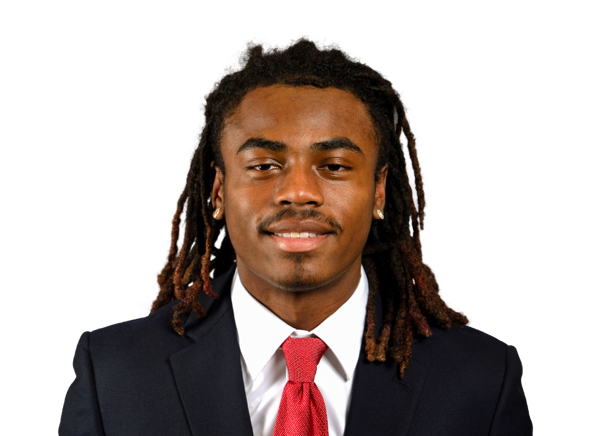 Trystan Haynes#14 | 2 | 0 | 0 | 0 | 0 | 0 | 0 |
 Omarion Robinson#2 | 1 | 1 | 0 | 0 | 0 | 0 | 0 |
 Cole Sullivan#18 | 1 | 1 | 0 | 0 | 1 | 0 | 0 |
 Fred Hinton#72 | 1 | 1 | 0 | 0 | 0 | 0 | 0 |
 Lebron Bauer#33 | 1 | 1 | 0 | 0 | 0 | 0 | 0 |
 Bishop Thomas#8 | 1 | 0 | 0.5 | 0.5 | 0 | 0 | 0 |
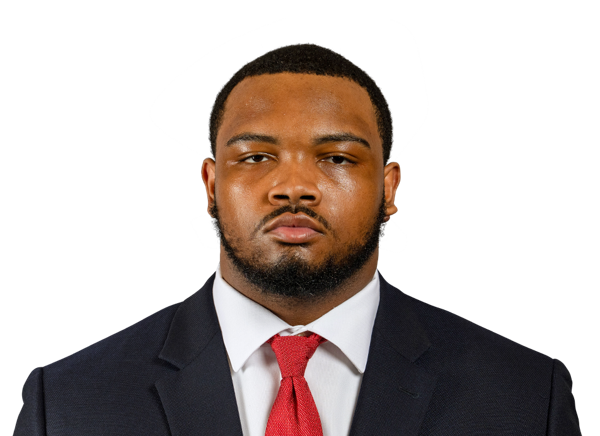 Trent Wilson#90 | 1 | 0 | 0 | 0 | 0 | 0 | 0 |
 Michael Boganowski#25 | 1 | 0 | 0 | 0 | 0 | 0 | 0 |
 Jake Kreul#98 | 1 | 0 | 0.5 | 0.5 | 0 | 0 | 0 |
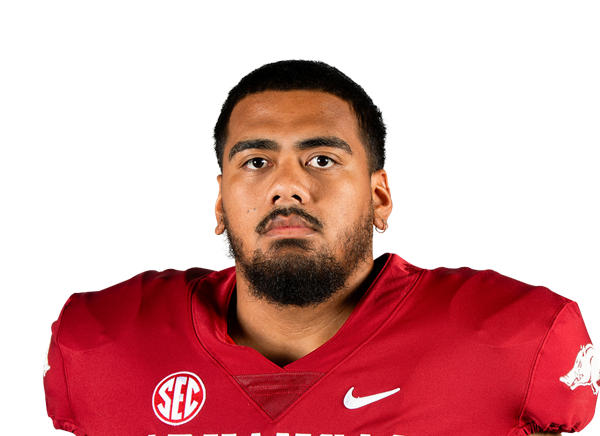 Danny Saili#55 | 1 | 0 | 0 | 0 | 0 | 0 | 0 |
 Jacobe Johnson#24 | 0 | 0 | 0 | 0 | 1 | 0 | 0 |
| Isaiah Sategna III#1 | 0 | 0 | 0 | 0 | 0 | 0 | 1 |
UTEP| Player | FUM | LOST | REC |
|---|---|---|---|
| Tavorus Jones | 1 | 1 | 0 |
| Raymond Moore III#12 | 1 | 1 | 0 |
| Adarius Hutchinson#32 | 0 | 0 | 1 |
Oklahoma| Player | FUM | LOST | REC |
|---|---|---|---|
| Andy Bass#25 | 1 | 1 | 0 |
| Taylor Wein#44 | 0 | 0 | 1 |
| James Nesta#47 | 0 | 0 | 1 |
UTEP| Player | FG | PCT | LONG | XP | PTS |
|---|---|---|---|---|---|
 Carlos Arreola#91 | 0/3 | 0.0 | 0 | 0/0 | 0 |
Oklahoma| Player | FG | PCT | LONG | XP | PTS |
|---|---|---|---|---|---|
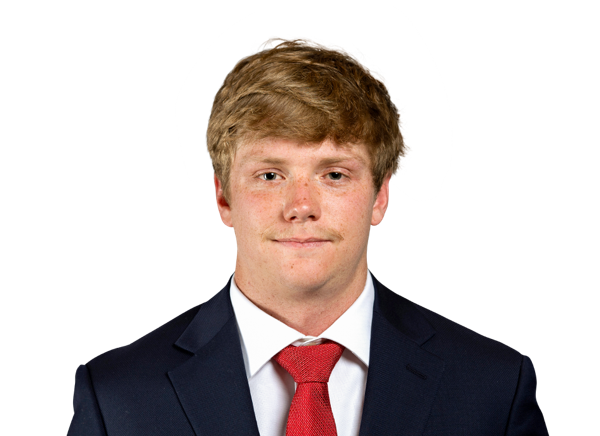 Tate Sandell#29 | 2/2 | 100.0 | 33 | 5/5 | 11 |
 Liam Evans#35 | 1/1 | 100.0 | 34 | 1/1 | 4 |
UTEP| Player | NO | YDS | AVG | TB | In 20 | LONG |
|---|---|---|---|---|---|---|
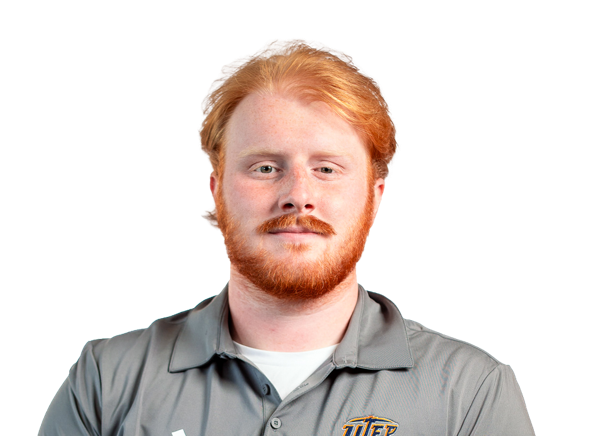 Brady Braun#47 | 4 | 144 | 36.0 | 0 | 0 | 59 |
 Team | 1 | 53 | 53.0 | 0 | 0 | 53 |
Oklahoma| Player | NO | YDS | AVG | TB | In 20 | LONG |
|---|---|---|---|---|---|---|
 Grayson Miller#43 | 1 | 44 | 44.0 | 0 | 0 | 44 |
 Jacob Ulrich#87 | 1 | 42 | 42.0 | 1 | 0 | 42 |
Oklahoma| Player | NO | YDS | AVG | LONG | TD |
|---|---|---|---|---|---|
| Isaiah Sategna III#1 | 1 | 24 | 24.0 | 24 | 0 |
UTEP| Player | NO | YDS | AVG | LONG | TD |
|---|---|---|---|---|---|
| Nik Henry#13 | 1 | 7 | 7.0 | 7 | 0 |
Oklahoma| Player | NO | YDS | AVG | LONG | TD |
|---|---|---|---|---|---|
| Isaiah Sategna III#1 | 2 | 115 | 57.5 | 88 | 1 |
Drive Summary
OU
Touchdown
76
UTEP
Punt Touchdown
4
UTEP
Missed FG
50
OU
Touchdown
80
UTEP
Missed FG
43
OU
Field Goal
53
UTEP
Punt
-4
OU
Field Goal
15
UTEP
End of Half
28
UTEP
Fumble
9
OU
Touchdown
34
UTEP
Punt
1
OU
Touchdown
57
UTEP
Punt
-15
OU
Field Goal
19
UTEP
Downs
7
OU
Touchdown
32
UTEP
Fumble
44
OU
Punt
3
UTEP
Punt
-5
OU
Fumble
-13
UTEP
Missed FG
-5
OU
Punt
35
UTEP
End of Game
26
Injury Report
No current injury report is available for this matchup.
Head-to-Head
Historical meetings are not available for this matchup.
Game Information
StageWeek 1
Season2026
KickoffFri, Sep 4, 8:00 pm
VenueMemorial Stadium (Norman, OK)
LocationNorman, OK
SurfaceGrass
BroadcastSECN+
Division Standings
FBS — Mountain West Conference
| Team | W | L | T | Pct | PF | PA | Home | Away | Strk |
|---|---|---|---|---|---|---|---|---|---|
 UNLV | 5 | 3 | 0 | 0.625 | 200 | 190 | 3-1 | 2-2 | W1 |
 North Dakota State | 7 | 2 | 0 | 0.778 | 253 | 107 | 5-0 | 2-2 | W1 |
 Air Force | 6 | 2 | 0 | 0.750 | 234 | 172 | 4-1 | 2-1 | W1 |
 Nevada | 3 | 5 | 0 | 0.375 | 184 | 181 | 2-2 | 1-3 | L1 |
 New Mexico | 7 | 1 | 0 | 0.875 | 280 | 95 | 4-0 | 3-1 | W5 |
 San José State | 4 | 5 | 0 | 0.444 | 179 | 201 | 1-3 | 3-2 | L2 |
 Northern Illinois | 0 | 8 | 0 | 0.000 | 130 | 301 | 0-3 | 0-5 | L8 |
| UTEP | 1 | 7 | 0 | 0.125 | 113 | 292 | 1-3 | 0-4 | L6 |
 Wyoming | 5 | 3 | 0 | 0.625 | 156 | 160 | 4-0 | 1-3 | W3 |
 Hawai'i | 2 | 6 | 0 | 0.250 | 166 | 196 | 1-3 | 1-3 | W1 |
FBS — Southeastern Conference
| Team | W | L | T | Pct | PF | PA | Home | Away | Strk |
|---|---|---|---|---|---|---|---|---|---|
 Alabama | 6 | 2 | 0 | 0.750 | 306 | 170 | 4-1 | 2-1 | W1 |
 Arkansas | 3 | 5 | 0 | 0.375 | 157 | 221 | 2-3 | 1-2 | L1 |
 Auburn | 4 | 4 | 0 | 0.500 | 193 | 214 | 3-2 | 1-2 | L2 |
 Florida | 5 | 3 | 0 | 0.625 | 285 | 225 | 3-1 | 2-2 | L1 |
 Georgia | 7 | 1 | 0 | 0.875 | 328 | 119 | 5-1 | 2-0 | W1 |
 Kentucky | 7 | 1 | 0 | 0.875 | 263 | 198 | 4-1 | 3-0 | W6 |
 LSU | 6 | 2 | 0 | 0.750 | 321 | 128 | 5-0 | 1-2 | W2 |
 Mississippi State | 4 | 4 | 0 | 0.500 | 213 | 225 | 2-2 | 2-2 | L4 |
 Missouri | 6 | 2 | 0 | 0.750 | 252 | 147 | 4-0 | 2-2 | W1 |
| Oklahoma | 4 | 4 | 0 | 0.500 | 176 | 166 | 3-2 | 1-2 | L1 |
 Ole Miss | 6 | 2 | 0 | 0.750 | 297 | 192 | 5-0 | 1-2 | W1 |
 South Carolina | 5 | 3 | 0 | 0.625 | 295 | 202 | 3-2 | 2-1 | W3 |
 Tennessee | 6 | 2 | 0 | 0.750 | 258 | 130 | 4-1 | 2-1 | L1 |
 Texas | 6 | 2 | 0 | 0.750 | 246 | 137 | 5-1 | 1-1 | W2 |
 Texas A&M | 4 | 4 | 0 | 0.500 | 226 | 151 | 4-1 | 0-3 | L1 |
 Vanderbilt | 3 | 5 | 0 | 0.375 | 182 | 242 | 3-2 | 0-3 | L5 |
UTEP
9th in Mountain West
VS
Oklahoma
11th in SEC
Quarterbacks & Specialists
#47
Brady Braun
#1
EJ Colson Jr.
#12
Raymond Moore III
Receivers & Backs
#2
Royal Capell
#5
Carver Cheeks
#4
Cash Cheeks
#13
Nik Henry
Tavorus Jones
#6
Elijah McCoy
#3
Jaden Smith
#32
Lamar Sperling
#85
Jackson Stoner
#8
Kam Thomas
Defensive Line & Linebackers
#13
Isaiah Bogerty
#3
Shakaun Bowser
#93
Jerrell Brasher
#41
Vashon Brunswick II
#11
Derek Burns
#90
Ashton Coker
#21
Dycin Davis
#1
Elijah Fields
#9
Oryend Fisher
#4
Garrett Hawkins
#98
Preston Hickey
#19
Sterling Miles
#55
Leander Parrish
#8
Shay Smith
#10
Jayden Wilson
#25
Royce Wilson
#42
Copelin Windfont
Defensive Backs
#14
Chace Biddle
Justin Content
#24
Jaime Guerrero
#16
Esteban Guillory
#12
Donavan Howard
#32
Adarius Hutchinson
#23
Kaleb Miles
#2
Xavier Smith
#20
Grant Stewart
#18
Decorian Thompson
#27
LaTristan Thompson
#5
TJ Tillman
#17
Darnell Williams
Other
#91
Carlos Arreola
Quarterbacks & Specialists
#8
Bowe Bentley
#10
John Mateer
#16
Whitt Newbauer
#87
Jacob Ulrich
Offensive Line
#72
Fred Hinton
Receivers & Backs
#9
Lloyd Avant
#25
Andy Bass
#81
Rocky Beers
#89
Hayden Hansen
#11
Trell Harris
#20
Jonathan Hatton Jr.
#3
Parker Livingstone
#23
Ben McCreary
#21
Xavier Robinson
#1
Isaiah Sategna III
#14
Elijah Thomas
Defensive Line & Linebackers
#34
Adepoju Adebawore
#30
Dane Bathurst
#58
James Carrington
#42
Wyatt Gilmore
#38
Owen Heinecke
#65
Jayden Jackson
#98
Jake Kreul
#10
Kip Lewis
#47
James Nesta
#55
Danny Saili
David Stone
#18
Cole Sullivan
#8
Bishop Thomas
#44
Taylor Wein
#90
Trent Wilson
Defensive Backs
#33
Lebron Bauer
#25
Michael Boganowski
#23
Eli Bowen
#22
Peyton Bowen
#5
Markel Ford
#4
Courtland Guillory
#14
Trystan Haynes
#13
Niko Jandreau
#24
Jacobe Johnson
#3
Reggie Powers III
#2
Omarion Robinson
Other
#35
Liam Evans
#43
Grayson Miller
#29
Tate Sandell
UTEP
9th in Mountain West
VS
Oklahoma
11th in SEC
Passing
64.3
Completion Percentage
64.2
101
Completions
115
3.20
Interception Percentage
4.50
5
Interceptions
8
83
Longest Pass
53
1,063
Net Passing Yards
1,314
151.9
Net Passing Yards Per Game
219.0
157
Passing Attempts
179
5.70
Passing Touchdown %
5.00
9
Passing Touchdowns
9
133.9
Passer Rating
133.1
36
Total Sacks
17
204
Sack Yards Lost
89
6.8
Yards Per Pass Attempt
7.3
1,063
Passing Yards
1,314
0
Passing Fumbles Lost
0
7
Team Games Played
6
286.3
Yards Per Game
311.5
15.1
Total Points Per Game
21.3
106
Total Points
128
14
Total Touchdowns
15
151.9
Passing Yards Per Game
219.0
101-157
Comp-Att
115-179
36-204
Sacks-Yards Lost
17-89
Rushing
254
Rushing Attempts
197
941
Rushing Yards
555
3.7
Yards Per Rush Attempt
2.8
86
Long Rushing
42
0
20+ Yard Rushing Plays
0
5
Rushing Touchdowns
3
134.4
Rushing Yards Per Game
92.5
0
Rushing Fumbles
0
0
Rushing Fumbles Lost
0
48
Rushing 1st downs
34
7
Team Games Played
6
2,004
Total Yards
1,869
447
Total Offensive Plays
393
15.1
Total Points Per Game
21.3
106
Total Points
128
14
Total Touchdowns
15
Receiving
101
Receptions
115
0
Receiving Targets
0
1,063
Receiving Yards
1,314
1,063
Receiving Yards
1,314
9
Receiving Touchdowns
9
83
Long Reception
53
0
20+ Yard Receiving Plays
0
151.9
Receiving Yards Per Game
219.0
0
Receiving Fumbles
0
0
Receiving Fumbles Lost
0
536
Receiving Yards After Catch
656
44
Receiving First Downs
55
7
Team Games Played
6
10.5
Yards Per Reception
11.4
15.1
Total Points Per Game
21.3
106
Total Points
128
14
Total Touchdowns
15
Miscellaneous
105
Total 1st downs
99
48
Rushing 1st downs
34
44
Passing 1st downs
55
13
1st downs by penalty
10
22
Third Down Conversions
28
90
Third Down Attempts
83
24.44
3rd down %
33.73
12
Fourth Down Conversions
3
19
First Downs Attempts
7
63.16
4th down %
42.86
41
Total Penalties
37
376
Total Penalty Yards
307
12285
Possession Time Seconds
10784
0.00
Red Zone Field Goal Percentage
0.00
0.00
Red Zone Scoring Percentage
0.00
0.00
Red Zone Efficiency Percentage
0.00
0.00
Red Zone Touchdown Percentage
0.00
11
Total Takeaways
12
10
Total Giveaways
14
1
Turnover Ratio
-2
0
Fumbles Lost
0
22-90
3rd down efficiency
28-83
12-19
4th down efficiency
3-7
41-376
Total-Yards
37-307
Defense
200
Solo Tackles
177
290
Assist Tackles
200
490
Total Tackles
377
8
Sacks
18
51
Sack Yards
109
49
Stuffs
54
13
Passes Defended
18
6.0
Average Interception Yards
14.0
17
Long Interception
42
0
Miscellaneous Touchdowns
0
0
Kicks Blocked
1
20
Tackles For Loss
29
7
Team Games Played
6
Defensive Interceptions
3
Interceptions
3
18
Interception Yards
42
0
Interception Touchdowns
1
3-18
INT: Total
3-42
General
8
Fumbles
8
5
Forced Fumbles
3
6
Fumbles Recovered
4
0
Fumbles Touchdowns
0
7
Games Played
6
8-0
Fumbles-Lost
8-0
Returning
12
Kick Returns
5
211
Kick Return Yards
105
17.6
Yards Per Kick Return
21.0
25
Long Kick Return
28
0
Kick Return Touchdowns
0
6
Punt Returns
9
30
Punt Return Yards
154
5.0
Yards Per Punt Return
17.1
8
Long Punt Return
88
0
Punt Return Touchdowns
2
0
Punt Return Fair Catches
0
0
Kick Return Fumbles Lost
0
0
Punt Return Fumbles Lost
0
7
Team Games Played
6
6-30
Punt: Total
9-154
Kicking
3
Field Goal Made
8
8
Field Goal Attempts
11
37.5
Field Goal Percentage
72.7
47
Long Field Goal Made
53
0
Field Goal Attempts 1-19
0
0
Field Goal Attempts 20-29
1
4
Field Goal Attempts 30-39
4
3
Field Goal Attempts 40-49
3
1
Field Goal Attempts 50+
3
11
Extra Points Made
14
12
Extra Point Attempts
14
91.7
Extra Point Percentage
100.0
0
Field Goals Made 1-19
0
0
Field Goals Made 20-29
1
2
Field Goals Made 30-39
4
1
Field Goals Made 40-49
2
0
Field Goals Made 50+
1
20
Total Kicking Points
38
7
Team Games Played
6
74
Touchback Percentage
86
0.0
Average Kickoff Return Yards
0.0
0
Kickoff Return Yards
0
0
Kickoff Returns
0
0-0
Kickoffs: Total
0-0
3-8
FG: Good-Attempts
8-11
Punting
35
Punts
29
1,444
Punt Yards
1,294
71
Long Punt
62
41.3
Gross Average Punt Yards
44.6
41.3
Net Average Punt Yards
44.6
0
Punts Blocked
0
10
Punts Inside 20
8
2
Touchbacks
1
5
Fair Catches
14
12
Punt Returns
10
0
Punt Return Yards
0
0.0
Average Punt Return Yards
0.0
7
Team Games Played
6
35-1,444
Punt: Total Yards
29-1,294
Scoring
5
Rushing Touchdowns
3
9
Receiving Touchdowns
9
0
Return Touchdowns
2
14
Total Touchdowns
14
3
Field Goals
8
11
Kick Extra Points
14
1
Total Two Point Conversions
0
106
Total Points
128
15.1
Total Points Per Game
21.3