

UTSA vs Texas Live Score (20 Sep, 2026)
Score by Quarter
| Team | Q1 | Q2 | Q3 | Q4 | Final |
|---|---|---|---|---|---|
 UTSA |
3 | 0 | 3 | 0 | 6 |
 Texas |
10 | 10 | 3 | 7 | 30 |
Scoring Plays
Q1
13:34
13:34
Cam Coleman 24 Yd pass from Arch Manning (Gianni Spetic Kick)
Passing Touchdown
0 – 7
Q1
7:05
7:05
Michael Petro 34 Yd Field Goal
Field Goal Good
3 – 7
Q1
1:26
1:26
Gianni Spetic 52 Yd Field Goal
Field Goal Good
3 – 10
Q2
11:26
11:26
Cam Coleman 3 Yd pass from Arch Manning (Gianni Spetic Kick)
Passing Touchdown
3 – 17
Q2
0:10
0:10
Gianni Spetic 34 Yd Field Goal
Field Goal Good
3 – 20
Q3
12:44
12:44
Braydon Doane 43 Yd Field Goal
Field Goal Good
6 – 20
Q3
6:07
6:07
Gianni Spetic 23 Yd Field Goal
Field Goal Good
6 – 23
Q4
8:57
8:57
Derrek Cooper 1 Yd Run (Gianni Spetic Kick)
Rushing Touchdown
6 – 30
Game Leaders
UTSATexas
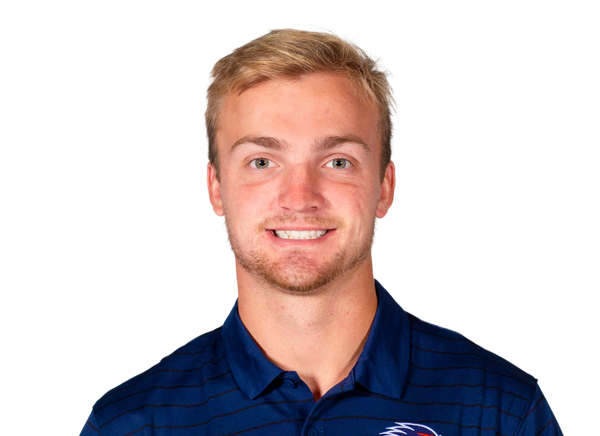 O. McCown QB
Passing Yards
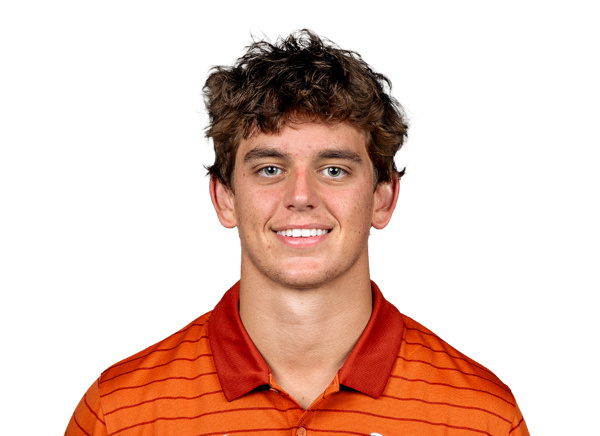 A. Manning QB
 W. Henderson III RB
Rushing Yards
 H. Smothers RB
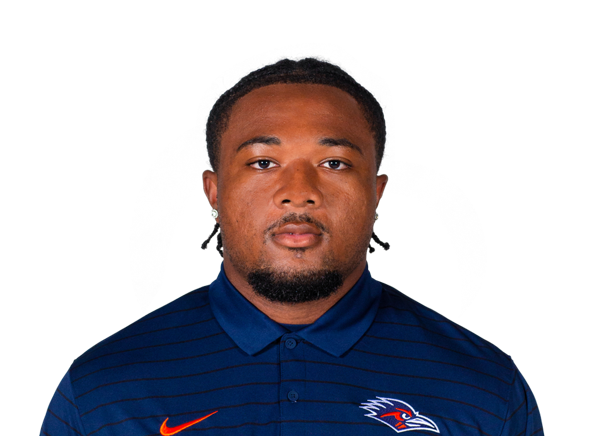 B. High Jr. RB
Receiving Yards
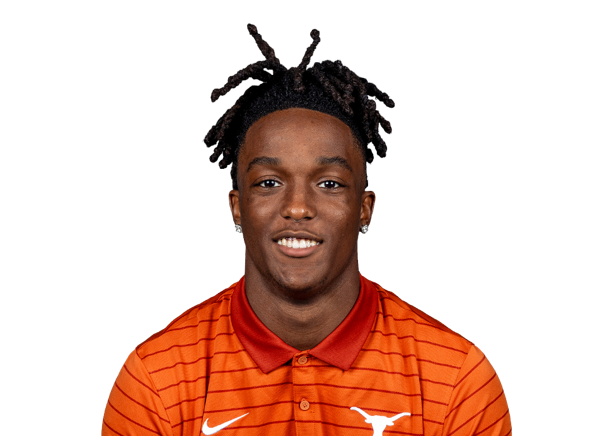 C. Coleman WR
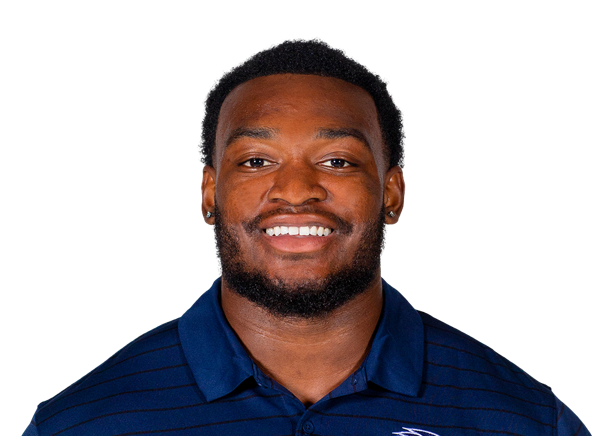 B. Tucker LB
Sacks
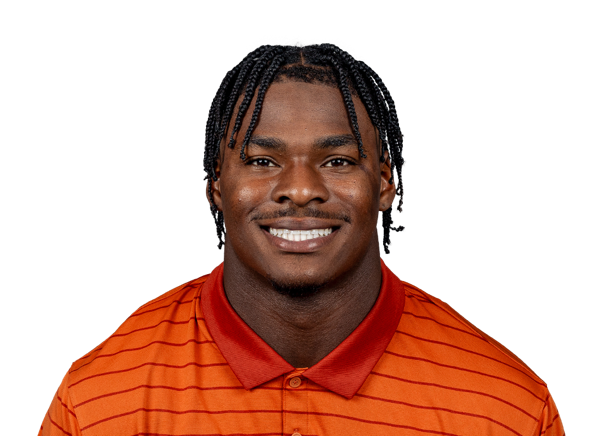 C. Simmons EDGEB. Tucker LB
Tackles
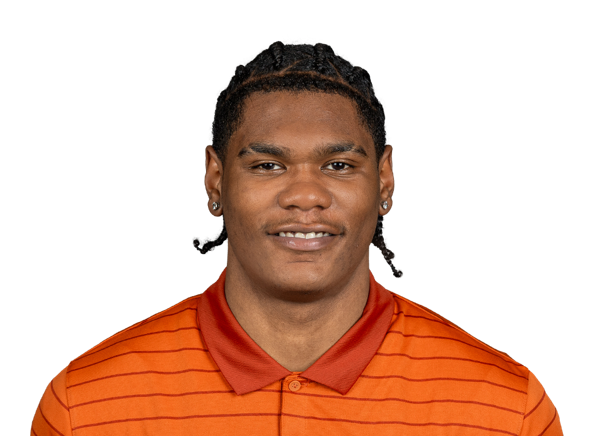 R. Biles LB
Player Box Score
UTSA| Player | C/ATT | YDS | AVG | TD | INT | QBR |
|---|---|---|---|---|---|---|
| Owen McCown#2 | 14/23 | 70 | 3.0 | 0 | 1 | 27.0 |
Texas| Player | C/ATT | YDS | AVG | TD | INT | QBR |
|---|---|---|---|---|---|---|
| Arch Manning#16 | 17/33 | 164 | 5.0 | 2 | 0 | 30.6 |
 Karle Lacey Jr.#9 | 1/1 | 8 | 8.0 | 0 | 0 | -- |
| Team | 0/1 | 0 | 0.0 | 0 | 0 | -- |
UTSA| Player | CAR | YDS | AVG | TD | LONG |
|---|---|---|---|---|---|
| Will Henderson III#1 | 10 | 38 | 3.8 | 0 | 12 |
| Brandon High Jr.#10 | 5 | 16 | 3.2 | 0 | 7 |
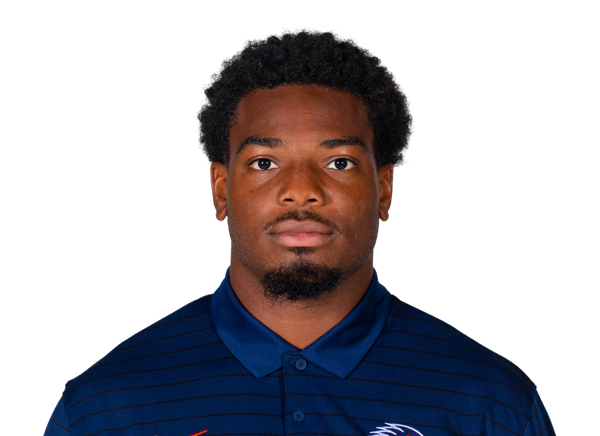 A'Marion Peterson#28 | 5 | 12 | 2.4 | 0 | 9 |
| Owen McCown#2 | 3 | 7 | 2.3 | 0 | 6 |
| Team | 1 | -1 | -1.0 | 0 | 0 |
Texas| Player | CAR | YDS | AVG | TD | LONG |
|---|---|---|---|---|---|
| Hollywood Smothers#2 | 10 | 54 | 5.4 | 0 | 18 |
| Arch Manning#16 | 9 | 50 | 5.6 | 0 | 20 |
 Derrek Cooper#5 | 11 | 44 | 4.0 | 1 | 10 |
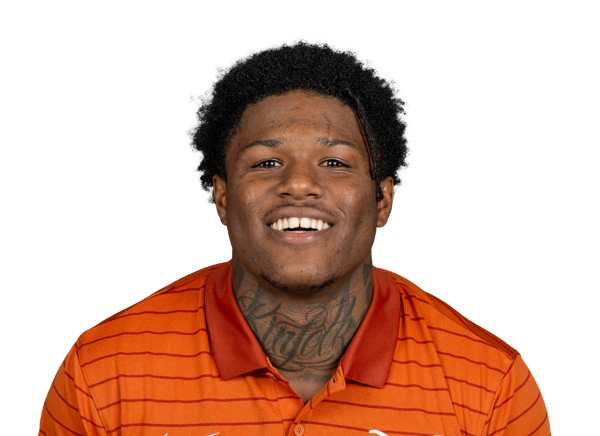 Raleek Brown | 10 | 41 | 4.1 | 0 | 15 |
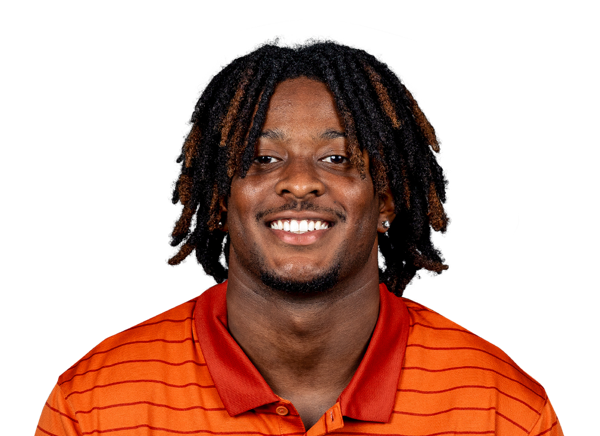 Michael Terry III#11 | 7 | 39 | 5.6 | 0 | 13 |
 James Simon#31 | 1 | 0 | 0.0 | 0 | 0 |
UTSA| Player | REC | YDS | AVG | TD | LONG |
|---|---|---|---|---|---|
| Brandon High Jr.#10 | 3 | 20 | 6.7 | 0 | 13 |
 DJ Allen Jr.#15 | 2 | 15 | 7.5 | 0 | 12 |
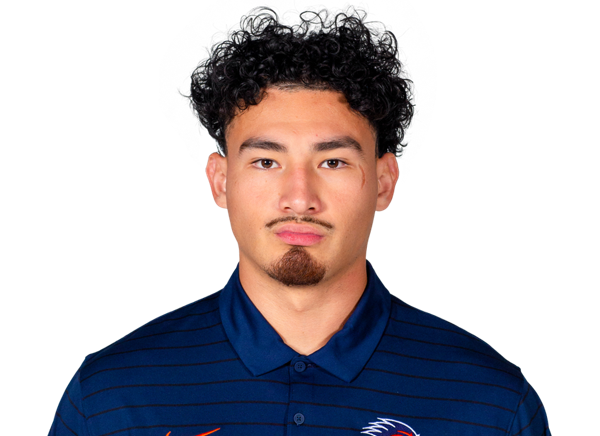 David Amador II | 4 | 11 | 2.8 | 0 | 8 |
 Mekhi Anderson#14 | 1 | 9 | 9.0 | 0 | 9 |
 AJ Wilson#84 | 1 | 8 | 8.0 | 0 | 8 |
| A'Marion Peterson#28 | 1 | 7 | 7.0 | 0 | 7 |
| Will Henderson III#1 | 2 | 0 | 0.0 | 0 | 4 |
Texas| Player | REC | YDS | AVG | TD | LONG |
|---|---|---|---|---|---|
| Cam Coleman#8 | 4 | 59 | 14.8 | 2 | 24 |
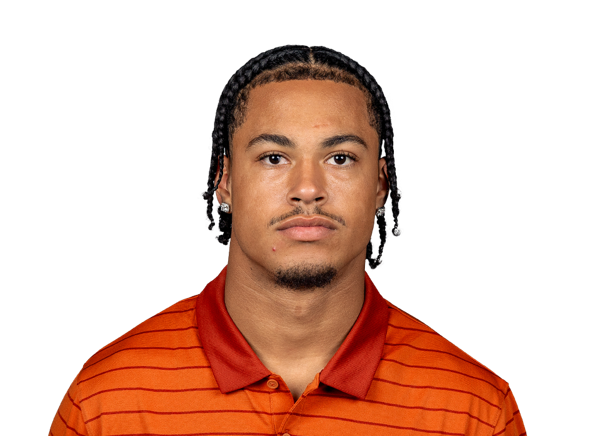 Emmett Mosley V#3 | 3 | 28 | 9.3 | 0 | 12 |
 Jermaine Bishop Jr.#4 | 2 | 22 | 11.0 | 0 | 15 |
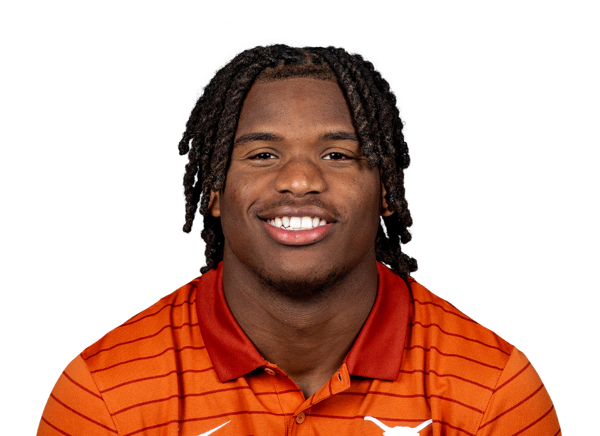 Ryan Wingo#1 | 2 | 22 | 11.0 | 0 | 17 |
| Hollywood Smothers#2 | 3 | 14 | 4.7 | 0 | 11 |
| Raleek Brown | 2 | 10 | 5.0 | 0 | 8 |
 Spencer Shannon#83 | 1 | 9 | 9.0 | 0 | 9 |
 Sterling Berkhalter#18 | 1 | 8 | 8.0 | 0 | 8 |
UTSA| Player | TOT | SOLO | SACKS | TFL | PD | QB HUR | TD |
|---|---|---|---|---|---|---|---|
| Brandon Tucker#23 | 11 | 4 | 1 | 1.5 | 0 | 1 | 0 |
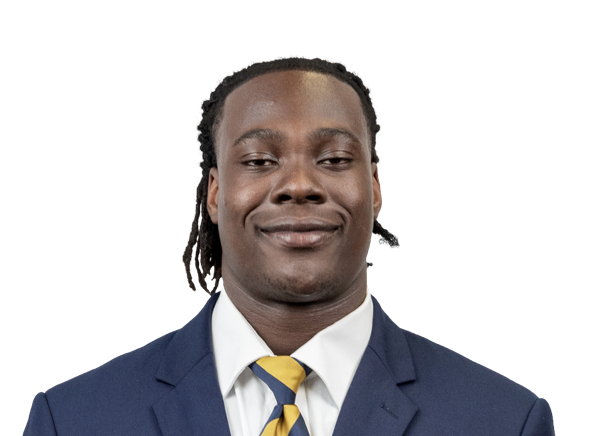 Eze Osondu#53 | 8 | 3 | 0 | 0 | 0 | 0 | 0 |
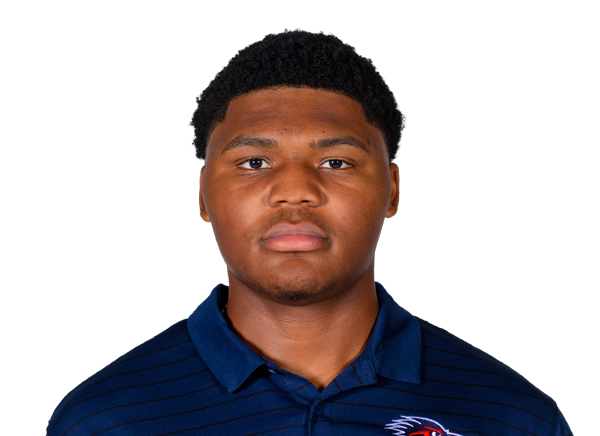 James Walley Jr.#34 | 7 | 4 | 0 | 1 | 0 | 0 | 0 |
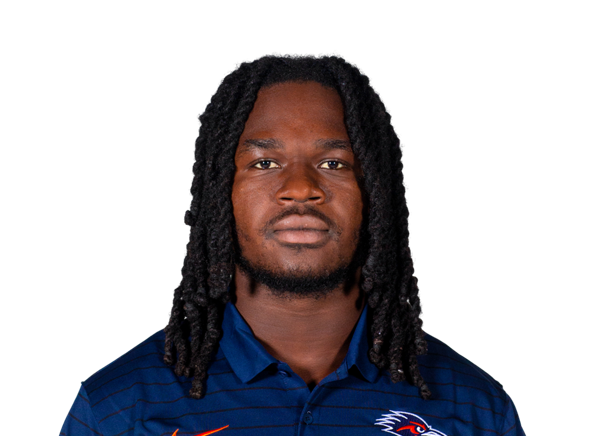 Owen Pewee#2 | 6 | 2 | 0 | 0 | 0 | 1 | 0 |
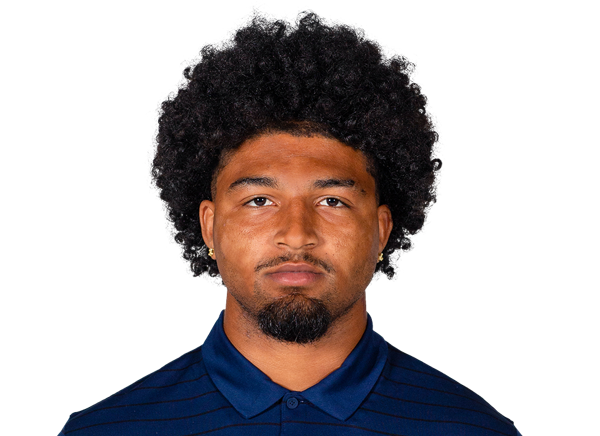 Darion White#44 | 5 | 2 | 0 | 0 | 0 | 2 | 0 |
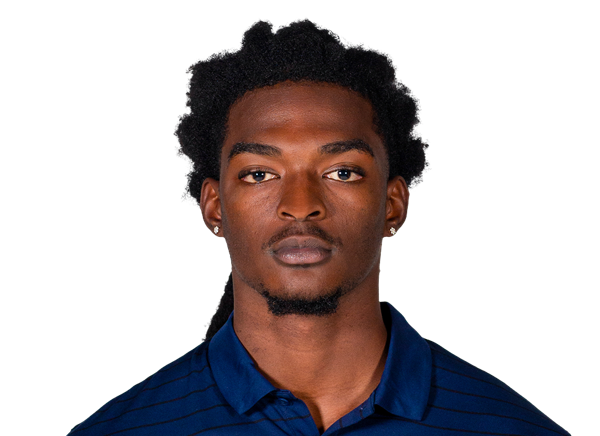 Cameron Upshaw Jr.#11 | 5 | 0 | 0 | 0 | 0 | 0 | 0 |
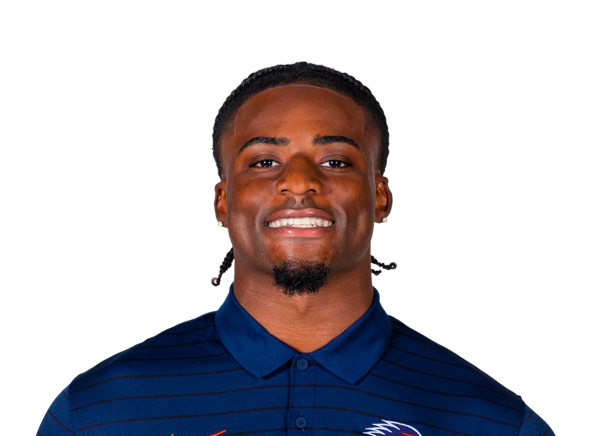 Bryce Grays#26 | 4 | 1 | 0 | 1.5 | 0 | 0 | 0 |
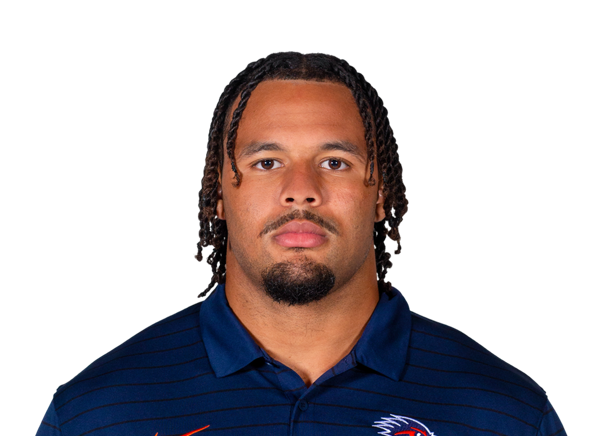 Camron Cooper#1 | 4 | 0 | 0 | 0.5 | 0 | 0 | 0 |
 Eddy Smith#94 | 4 | 0 | 0 | 0.5 | 1 | 0 | 0 |
 RJ Lester Jr.#13 | 3 | 3 | 0 | 0 | 0 | 0 | 0 |
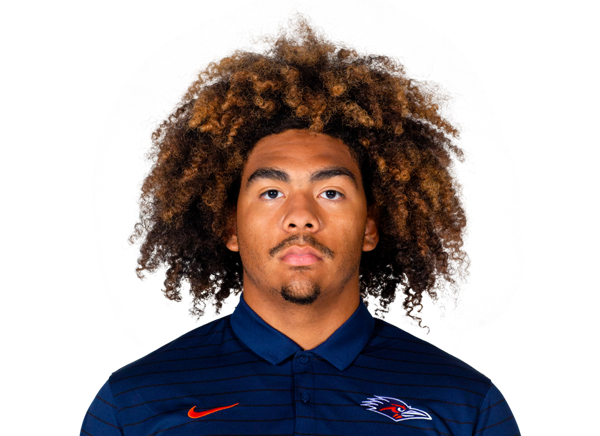 Elijah Baldwin#32 | 3 | 3 | 0 | 0 | 0 | 0 | 0 |
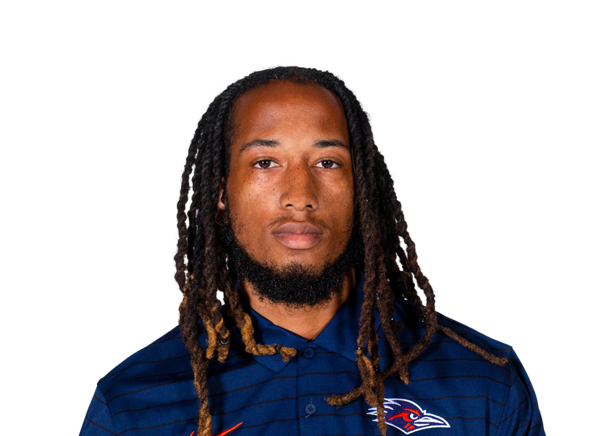 Jakevian Rodgers#27 | 3 | 2 | 0 | 0 | 0 | 0 | 0 |
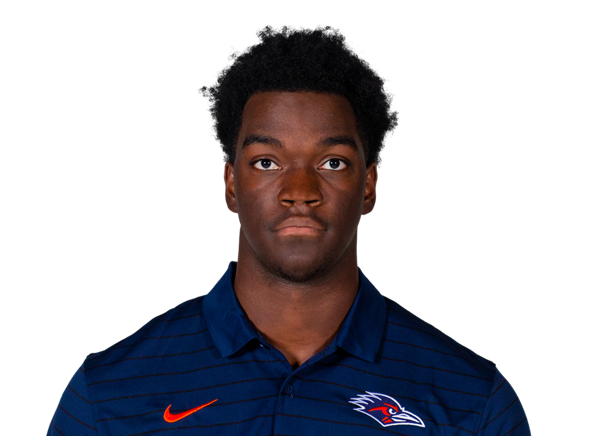 Joel Rogers#14 | 3 | 2 | 0 | 0 | 0 | 0 | 0 |
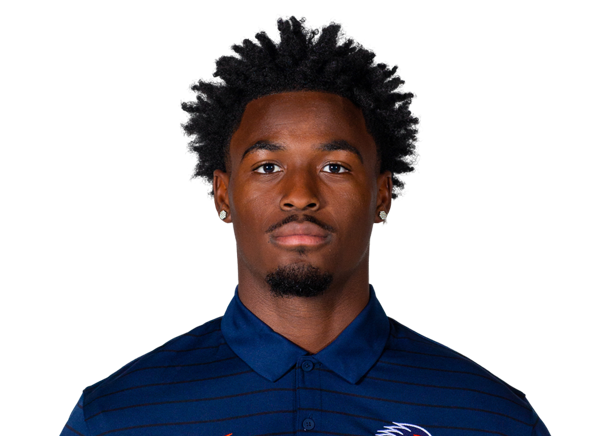 Elijah Newell#22 | 3 | 2 | 0 | 0 | 0 | 0 | 0 |
| Jarvse Dickerson#21 | 3 | 1 | 0 | 0 | 0 | 0 | 0 |
 Nate Robinson Jr.#25 | 3 | 0 | 0 | 0 | 0 | 0 | 0 |
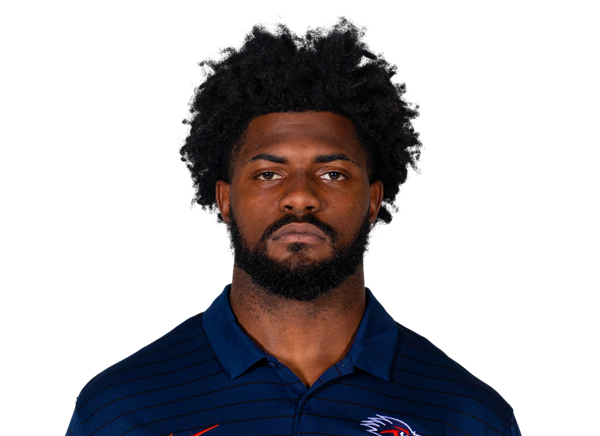 Dylan Spencer#31 | 2 | 2 | 0 | 0 | 0 | 0 | 0 |
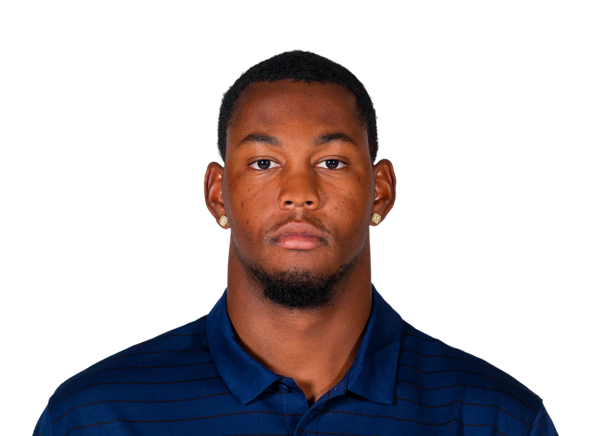 Tai Leonard#99 | 2 | 1 | 0 | 0 | 0 | 0 | 0 |
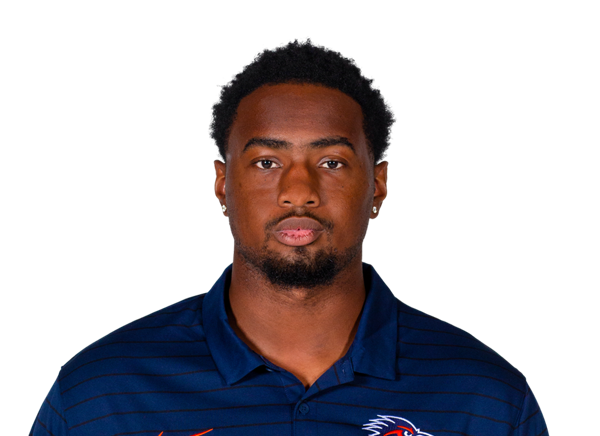 Drenon Fite III#95 | 2 | 1 | 0 | 0.5 | 0 | 0 | 0 |
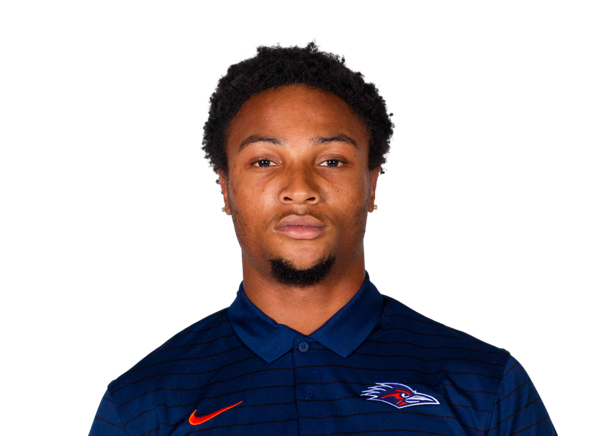 Asaad Chapman#17 | 2 | 1 | 0 | 0.5 | 2 | 0 | 0 |
 Jeremiah Bailey | 2 | 0 | 0 | 0 | 0 | 0 | 0 |
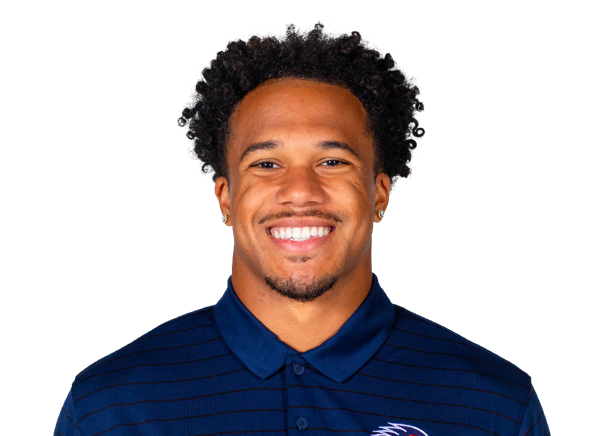 Xavier Walton#29 | 2 | 0 | 0 | 0 | 0 | 0 | 0 |
| DJ Allen Jr.#15 | 1 | 1 | 0 | 0 | 0 | 0 | 0 |
 Amare Johnson#55 | 1 | 1 | 0 | 0 | 0 | 0 | 0 |
 Jameian Buxton#98 | 1 | 0 | 0 | 0 | 0 | 0 | 0 |
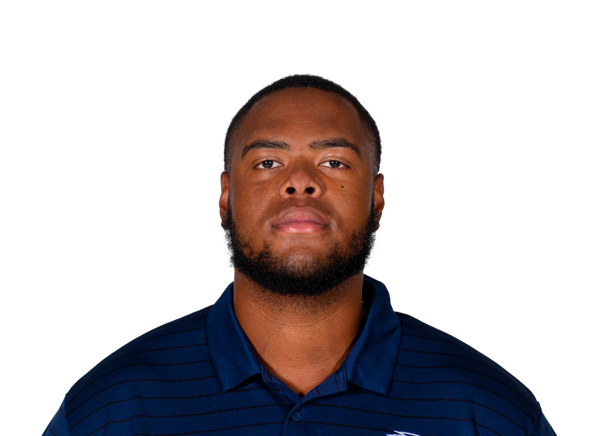 Donald Quaite Jr.#90 | 1 | 0 | 0 | 0 | 0 | 0 | 0 |
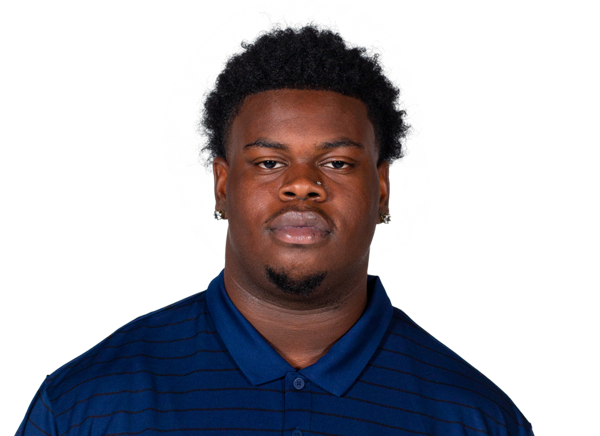 King Justice#97 | 1 | 0 | 0 | 0 | 0 | 0 | 0 |
 Jon Stephens III#67 | 1 | 0 | 0 | 0 | 0 | 0 | 0 |
 Ahamad Chapman#18 | 1 | 0 | 0 | 0 | 0 | 0 | 0 |
Texas| Player | TOT | SOLO | SACKS | TFL | PD | QB HUR | TD |
|---|---|---|---|---|---|---|---|
| Rasheem Biles#3 | 4 | 3 | 0 | 0 | 0 | 1 | 0 |
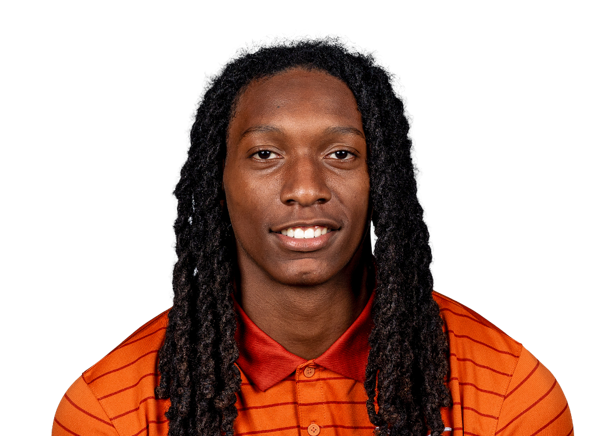 Kade Phillips#8 | 4 | 3 | 0 | 0 | 0 | 0 | 0 |
 Jelani McDonald#4 | 3 | 3 | 0 | 1 | 0 | 0 | 0 |
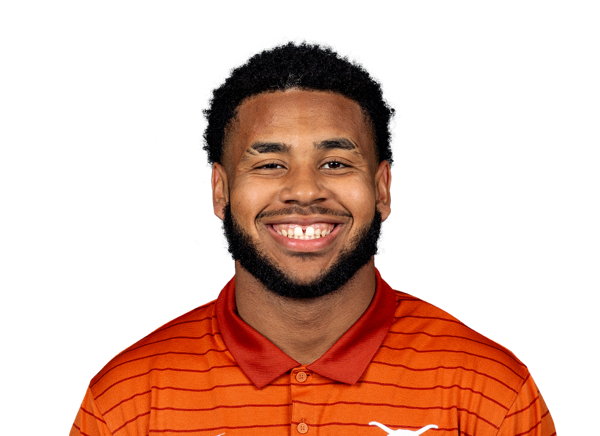 Richard Wesley#99 | 3 | 3 | 0 | 1 | 0 | 0 | 0 |
 Hero Kanu#93 | 2 | 2 | 0 | 1 | 1 | 2 | 0 |
 Derek Williams Jr.#2 | 2 | 2 | 0 | 0 | 2 | 0 | 0 |
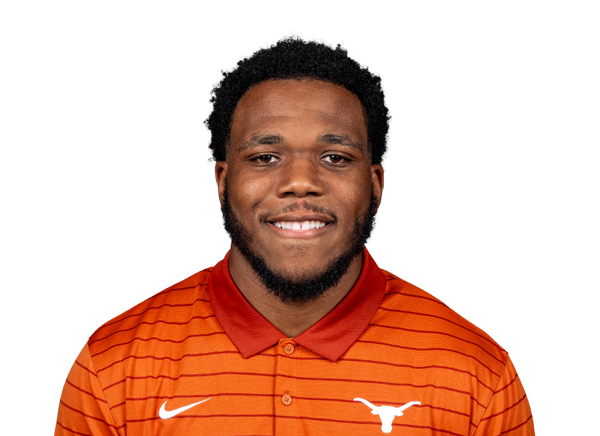 Justin Cryer#28 | 2 | 2 | 0 | 0 | 0 | 1 | 0 |
 Warren Roberson#24 | 2 | 2 | 0 | 0 | 0 | 0 | 0 |
 Bo Mascoe#5 | 2 | 2 | 0 | 1 | 0 | 0 | 0 |
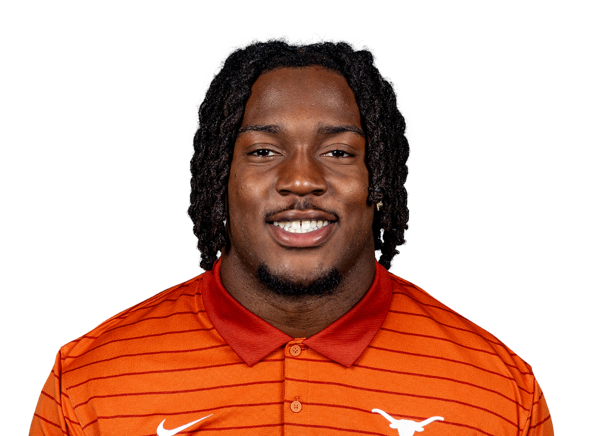 Zina Umeozulu#19 | 2 | 2 | 0 | 0 | 0 | 1 | 0 |
 Graceson Littleton#29 | 2 | 2 | 0 | 0 | 1 | 0 | 0 |
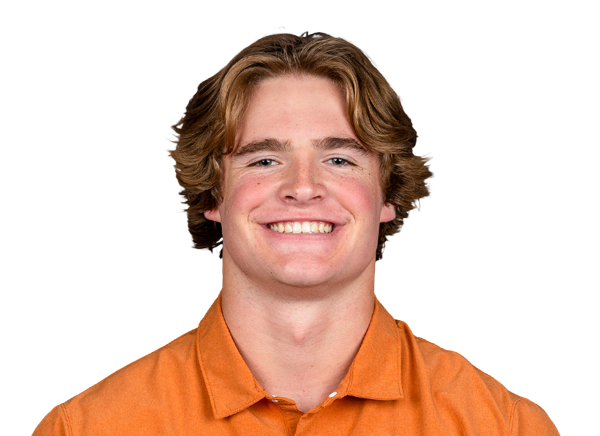 Colton Vasek#92 | 2 | 1 | 0 | 0 | 0 | 0 | 0 |
| Colin Simmons#1 | 1 | 1 | 1 | 1 | 0 | 0 | 0 |
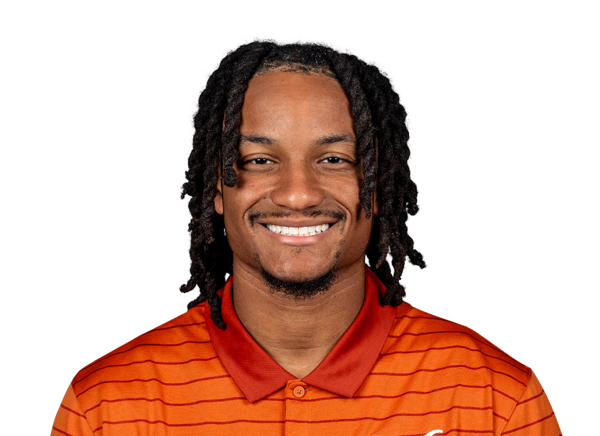 Darius Snow#45 | 1 | 1 | 0 | 0 | 0 | 0 | 0 |
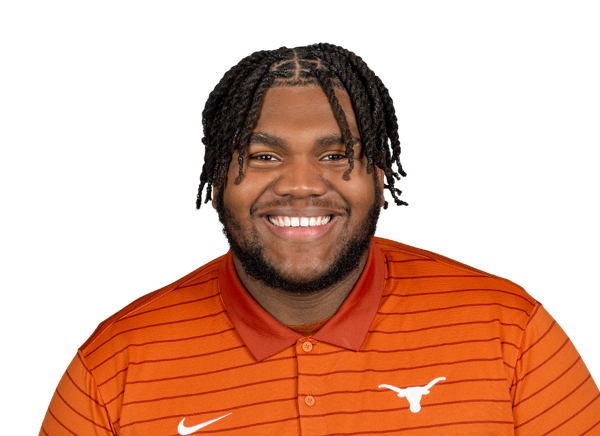 Ian Geffrard#95 | 1 | 1 | 0 | 0 | 0 | 0 | 0 |
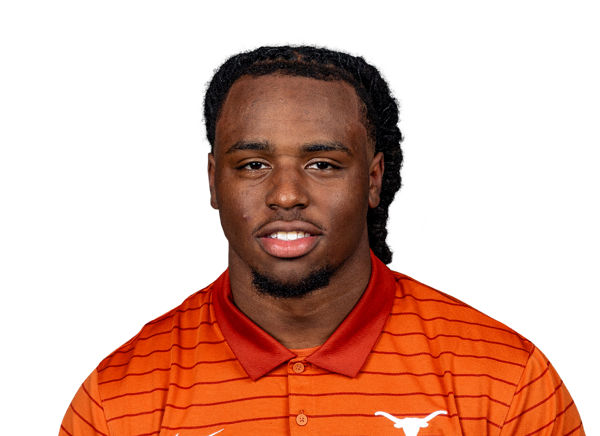 Brad Spence#14 | 1 | 1 | 0 | 0 | 0 | 0 | 0 |
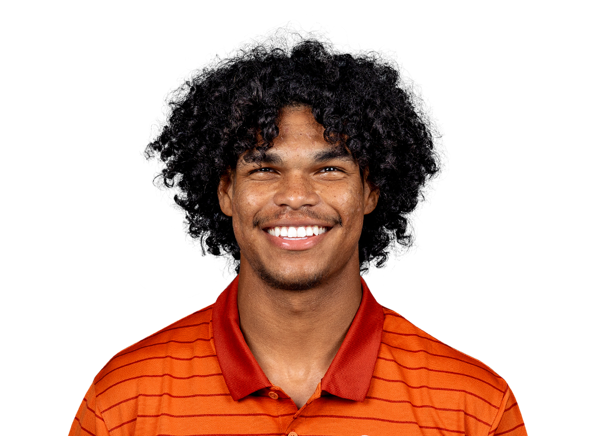 Jonah Williams#9 | 1 | 1 | 0 | 0 | 0 | 0 | 0 |
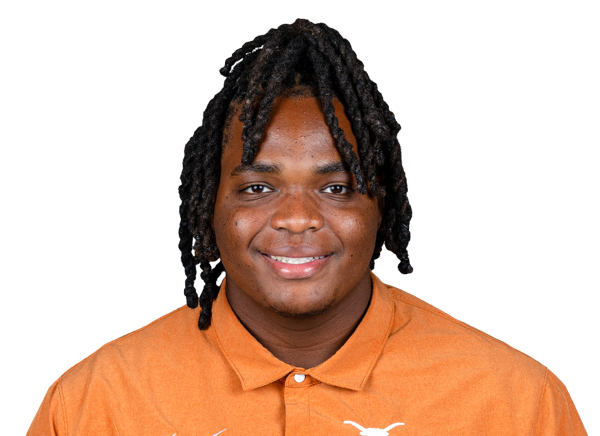 Maraad Watson#88 | 1 | 1 | 0 | 0 | 0 | 0 | 0 |
 Kosi Okpala#18 | 1 | 1 | 0 | 1 | 0 | 0 | 0 |
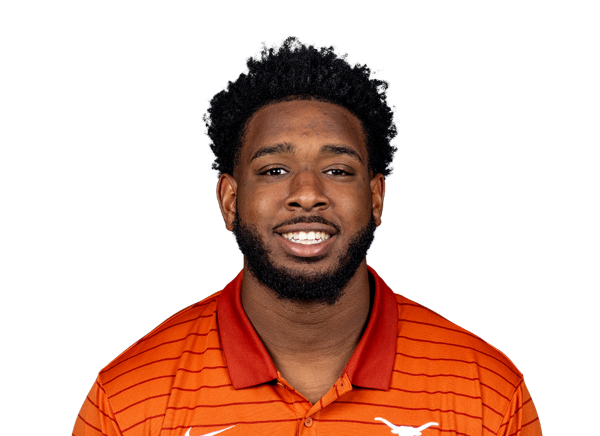 Alex January#97 | 1 | 0 | 0 | 0 | 0 | 0 | 0 |
 Zion Williams#96 | 1 | 0 | 0 | 0 | 0 | 0 | 0 |
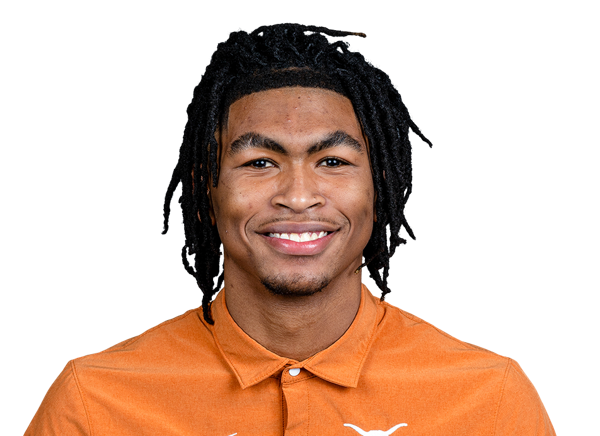 Jonathan Cunningham#37 | 1 | 0 | 0 | 0 | 0 | 0 | 0 |
UTSA| Player | FUM | LOST | REC |
|---|---|---|---|
| Brandon High Jr.#10 | 1 | 0 | 0 |
Texas| Player | FUM | LOST | REC |
|---|---|---|---|
| Team | 2 | 0 | 0 |
UTSA| Player | FG | PCT | LONG | XP | PTS |
|---|---|---|---|---|---|
 Michael Petro#92 | 1/1 | 100.0 | 34 | 0/0 | 3 |
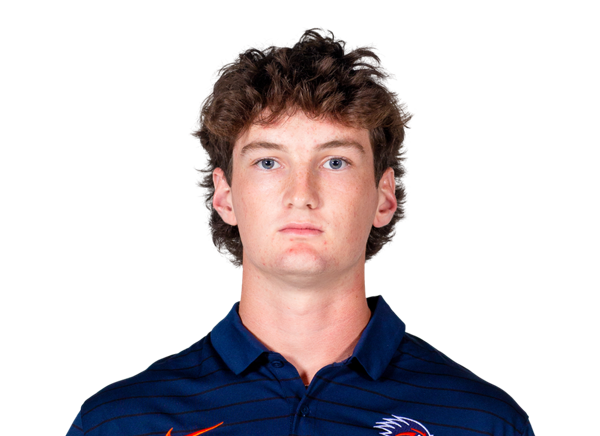 Braydon Doane#46 | 1/1 | 100.0 | 43 | 0/0 | 3 |
Texas| Player | FG | PCT | LONG | XP | PTS |
|---|---|---|---|---|---|
 Gianni Spetic#44 | 3/3 | 100.0 | 52 | 3/3 | 12 |
UTSA| Player | NO | YDS | AVG | TB | In 20 | LONG |
|---|---|---|---|---|---|---|
 Caile Hogan#30 | 8 | 308 | 38.5 | 0 | 1 | 43 |
Texas| Player | NO | YDS | AVG | TB | In 20 | LONG |
|---|---|---|---|---|---|---|
 Mac Chiumento#43 | 3 | 126 | 42.0 | 0 | 0 | 52 |
UTSA| Player | NO | YDS | AVG | LONG | TD |
|---|---|---|---|---|---|
| Brandon High Jr.#10 | 1 | 20 | 20.0 | 20 | 0 |
Texas| Player | NO | YDS | AVG | LONG | TD |
|---|---|---|---|---|---|
 Ryan Niblett#21 | 2 | 28 | 14.0 | 16 | 0 |
Texas| Player | NO | YDS | AVG | LONG | TD |
|---|---|---|---|---|---|
| Ryan Niblett#21 | 3 | 41 | 13.7 | 21 | 0 |
Texas| Player | INT | YDS | TD |
|---|---|---|---|
| Rasheem Biles#3 | 1 | 8 | 0 |
Drive Summary
UTSA
Interception
0
TEX
Touchdown
37
UTSA
Field Goal
59
TEX
Field Goal
50
UTSA
Punt
-2
TEX
Touchdown
57
UTSA
Punt
2
TEX
Downs
4
UTSA
Punt
1
TEX
Punt
29
UTSA
Punt
-10
TEX
Field Goal
36
TEX
Kickoff
0
TEX
Punt
-11
UTSA
Field Goal
10
TEX
Punt
19
UTSA
Punt
4
TEX
Field Goal
34
UTSA
Punt
-1
TEX
Downs
37
UTSA
Punt
13
TEX
Touchdown
66
UTSA
Punt
7
TEX
End of Game
42
Injury Report
No current injury report is available for this matchup.
Head-to-Head
Historical meetings are not available for this matchup.
Game Information
StageWeek 3
Season2026
KickoffSat, Sep 19, 8:00 pm
VenueDKR-Texas Memorial Stadium
LocationAustin, TX
SurfaceArtificial Turf
BroadcastSECN+
Attendance103,753
Division Standings
FBS — American Conference
| Team | W | L | T | Pct | PF | PA | Home | Away | Strk |
|---|---|---|---|---|---|---|---|---|---|
 South Florida | 6 | 4 | 0 | 0.600 | 274 | 188 | 4-2 | 2-2 | L2 |
 Florida Atlantic | 6 | 4 | 0 | 0.600 | 383 | 353 | 5-0 | 1-4 | L1 |
 Tulsa | 6 | 4 | 0 | 0.600 | 336 | 226 | 3-2 | 3-2 | W2 |
 Memphis | 8 | 2 | 0 | 0.800 | 390 | 253 | 5-0 | 3-2 | W3 |
| UTSA | 7 | 2 | 0 | 0.778 | 297 | 268 | 4-0 | 3-2 | L1 |
 East Carolina | 6 | 4 | 0 | 0.600 | 229 | 226 | 4-1 | 2-3 | W3 |
 North Texas | 7 | 2 | 0 | 0.778 | 402 | 278 | 5-0 | 2-2 | W6 |
 Rice | 1 | 9 | 0 | 0.100 | 208 | 326 | 1-4 | 0-5 | L9 |
 Temple | 2 | 8 | 0 | 0.200 | 234 | 291 | 1-5 | 1-3 | L5 |
 Tulane | 5 | 5 | 0 | 0.500 | 210 | 280 | 3-2 | 2-3 | W1 |
 UAB | 6 | 4 | 0 | 0.600 | 232 | 224 | 5-0 | 1-4 | W2 |
 Charlotte | 1 | 9 | 0 | 0.100 | 193 | 362 | 0-5 | 1-4 | L3 |
 Army | 5 | 4 | 0 | 0.556 | 290 | 228 | 3-2 | 2-2 | L2 |
 Navy | 3 | 6 | 0 | 0.333 | 263 | 274 | 3-2 | 0-4 | W1 |
FBS — Southeastern Conference
| Team | W | L | T | Pct | PF | PA | Home | Away | Strk |
|---|---|---|---|---|---|---|---|---|---|
 Alabama | 8 | 2 | 0 | 0.800 | 358 | 189 | 4-1 | 4-1 | W3 |
 Florida | 6 | 4 | 0 | 0.600 | 313 | 262 | 3-2 | 3-2 | W1 |
 Georgia | 9 | 1 | 0 | 0.900 | 418 | 147 | 6-1 | 3-0 | W3 |
 Mississippi State | 4 | 6 | 0 | 0.400 | 245 | 291 | 2-4 | 2-2 | L6 |
 Ole Miss | 6 | 3 | 0 | 0.667 | 304 | 234 | 5-1 | 1-2 | L1 |
 Kentucky | 7 | 3 | 0 | 0.700 | 283 | 253 | 4-2 | 3-1 | L2 |
 Missouri | 6 | 4 | 0 | 0.600 | 293 | 229 | 4-1 | 2-3 | L2 |
 Tennessee | 8 | 2 | 0 | 0.800 | 314 | 143 | 5-1 | 3-1 | W2 |
| Texas | 8 | 2 | 0 | 0.800 | 302 | 178 | 5-1 | 3-1 | W4 |
 Vanderbilt | 4 | 6 | 0 | 0.400 | 213 | 286 | 3-3 | 1-3 | L1 |
 Oklahoma | 5 | 4 | 0 | 0.556 | 199 | 173 | 3-2 | 2-2 | W1 |
 Auburn | 6 | 4 | 0 | 0.600 | 260 | 246 | 4-2 | 2-2 | W2 |
 LSU | 6 | 4 | 0 | 0.600 | 355 | 181 | 5-2 | 1-2 | L2 |
 South Carolina | 6 | 4 | 0 | 0.600 | 318 | 245 | 4-2 | 2-2 | L1 |
 Texas A&M | 4 | 6 | 0 | 0.400 | 242 | 190 | 4-2 | 0-4 | L3 |
 Arkansas | 4 | 6 | 0 | 0.400 | 214 | 253 | 3-3 | 1-3 | W1 |
UTSA
VS
Texas
2nd in SEC
Quarterbacks & Specialists
#30
Caile Hogan
#2
Owen McCown
#67
Jon Stephens III
Receivers & Backs
#15
DJ Allen Jr.
David Amador II
#14
Mekhi Anderson
#1
Will Henderson III
#10
Brandon High Jr.
#28
A'Marion Peterson
#84
AJ Wilson
Defensive Line & Linebackers
Jeremiah Bailey
#32
Elijah Baldwin
#98
Jameian Buxton
#1
Camron Cooper
#95
Drenon Fite III
#26
Bryce Grays
#55
Amare Johnson
#97
King Justice
#99
Tai Leonard
#53
Eze Osondu
#2
Owen Pewee
#90
Donald Quaite Jr.
#94
Eddy Smith
#31
Dylan Spencer
#23
Brandon Tucker
#34
James Walley Jr.
#44
Darion White
Defensive Backs
#18
Ahamad Chapman
#17
Asaad Chapman
#21
Jarvse Dickerson
#13
RJ Lester Jr.
#22
Elijah Newell
#25
Nate Robinson Jr.
#27
Jakevian Rodgers
#14
Joel Rogers
#11
Cameron Upshaw Jr.
#29
Xavier Walton
Other
#46
Braydon Doane
#92
Michael Petro
Quarterbacks & Specialists
#43
Mac Chiumento
#9
KJ Lacey
#16
Arch Manning
Receivers & Backs
#18
Sterling Berkhalter
#4
Jermaine Bishop Jr.
Raleek Brown
#8
Cam Coleman
#5
Derrek Cooper
#3
Emmett Mosley V
#21
Ryan Niblett
#83
Spencer Shannon
#31
James Simon
#2
Hollywood Smothers
#11
Michael Terry III
#1
Ryan Wingo
Defensive Line & Linebackers
#3
Rasheem Biles
#28
Justin Cryer
#37
Jonathan Cunningham
#95
Ian Geffrard
#97
Alex January
#93
Hero Kanu
#18
Kosi Okpala
#45
Darius Snow
#14
Brad Spence
#88
Maraad Watson
#96
Zion Williams
Defensive Backs
#29
Graceson Littleton
#5
Bo Mascoe
#4
Jelani McDonald
#8
Kade Phillips
#24
Warren Roberson
#9
Jonah Williams
#2
Derek Williams Jr.
Other
#1
Colin Simmons
#44
Gianni Spetic
#19
Zina Umeozulu
#92
Colton Vasek
#99
Richard Wesley
UTSA
2nd in American
VS
Texas
4th in SEC
Passing
67.3
Completion Percentage
66.7
191
Completions
176
1.40
Interception Percentage
2.70
4
Interceptions
7
62
Longest Pass
62
2,067
Net Passing Yards
2,087
229.7
Net Passing Yards Per Game
231.9
284
Passing Attempts
264
4.90
Passing Touchdown %
6.80
14
Passing Touchdowns
18
142.1
Passer Rating
150.2
16
Total Sacks
27
82
Sack Yards Lost
188
7.3
Yards Per Pass Attempt
7.9
2,067
Passing Yards
2,087
0
Passing Fumbles Lost
0
9
Team Games Played
9
410.3
Yards Per Game
360.7
33.0
Total Points Per Game
31.1
297
Total Points
280
37
Total Touchdowns
34
229.7
Passing Yards Per Game
231.9
191-284
Comp-Att
176-264
16-82
Sacks-Yards Lost
27-188
Rushing
328
Rushing Attempts
329
1,626
Rushing Yards
1,159
5.0
Yards Per Rush Attempt
3.5
75
Long Rushing
47
0
20+ Yard Rushing Plays
0
21
Rushing Touchdowns
13
180.7
Rushing Yards Per Game
128.8
0
Rushing Fumbles
0
0
Rushing Fumbles Lost
0
83
Rushing 1st downs
73
9
Team Games Played
9
3,693
Total Yards
3,246
628
Total Offensive Plays
620
33.0
Total Points Per Game
31.1
297
Total Points
280
37
Total Touchdowns
34
Receiving
191
Receptions
176
0
Receiving Targets
0
2,067
Receiving Yards
2,087
2,067
Receiving Yards
2,087
14
Receiving Touchdowns
18
62
Long Reception
62
0
20+ Yard Receiving Plays
0
229.7
Receiving Yards Per Game
231.9
0
Receiving Fumbles
0
0
Receiving Fumbles Lost
0
1277
Receiving Yards After Catch
1133
92
Receiving First Downs
90
9
Team Games Played
9
10.8
Yards Per Reception
11.9
33.0
Total Points Per Game
31.1
297
Total Points
280
37
Total Touchdowns
34
Miscellaneous
191
Total 1st downs
178
83
Rushing 1st downs
73
92
Passing 1st downs
91
16
1st downs by penalty
14
52
Third Down Conversions
49
127
Third Down Attempts
124
40.94
3rd down %
39.52
11
Fourth Down Conversions
7
15
First Downs Attempts
12
73.33
4th down %
58.33
75
Total Penalties
60
724
Total Penalty Yards
567
16055
Possession Time Seconds
16271
0.00
Red Zone Field Goal Percentage
0.00
0.00
Red Zone Scoring Percentage
0.00
0.00
Red Zone Efficiency Percentage
0.00
0.00
Red Zone Touchdown Percentage
0.00
12
Total Takeaways
14
8
Total Giveaways
14
4
Turnover Ratio
0
0
Fumbles Lost
0
52-127
3rd down efficiency
49-124
11-15
4th down efficiency
7-12
75-724
Total-Yards
60-567
Defense
337
Solo Tackles
321
284
Assist Tackles
286
621
Total Tackles
607
10
Sacks
27
73
Sack Yards
152
67
Stuffs
76
22
Passes Defended
42
10.9
Average Interception Yards
3.2
49
Long Interception
15
0
Miscellaneous Touchdowns
0
0
Kicks Blocked
2
30
Tackles For Loss
52
9
Team Games Played
9
Defensive Interceptions
7
Interceptions
6
76
Interception Yards
19
1
Interception Touchdowns
0
7-76
INT: Total
6-19
General
6
Fumbles
14
4
Forced Fumbles
8
8
Fumbles Recovered
7
0
Fumbles Touchdowns
2
9
Games Played
9
6-0
Fumbles-Lost
14-0
Returning
13
Kick Returns
9
363
Kick Return Yards
131
27.9
Yards Per Kick Return
14.6
100
Long Kick Return
28
1
Kick Return Touchdowns
0
16
Punt Returns
20
115
Punt Return Yards
217
7.2
Yards Per Punt Return
10.9
21
Long Punt Return
63
0
Punt Return Touchdowns
1
0
Punt Return Fair Catches
0
0
Kick Return Fumbles Lost
0
0
Punt Return Fumbles Lost
0
9
Team Games Played
9
16-115
Punt: Total
20-217
Kicking
13
Field Goal Made
14
16
Field Goal Attempts
15
81.3
Field Goal Percentage
93.3
54
Long Field Goal Made
52
0
Field Goal Attempts 1-19
0
2
Field Goal Attempts 20-29
5
8
Field Goal Attempts 30-39
5
4
Field Goal Attempts 40-49
3
2
Field Goal Attempts 50+
2
34
Extra Points Made
34
35
Extra Point Attempts
34
97.1
Extra Point Percentage
100.0
0
Field Goals Made 1-19
0
2
Field Goals Made 20-29
5
6
Field Goals Made 30-39
5
3
Field Goals Made 40-49
3
2
Field Goals Made 50+
1
73
Total Kicking Points
76
9
Team Games Played
9
50
Touchback Percentage
61
0.0
Average Kickoff Return Yards
0.0
0
Kickoff Return Yards
0
0
Kickoff Returns
0
0-0
Kickoffs: Total
0-0
13-16
FG: Good-Attempts
14-15
Punting
38
Punts
41
1,570
Punt Yards
1,683
59
Long Punt
57
41.3
Gross Average Punt Yards
41.0
41.3
Net Average Punt Yards
41.0
0
Punts Blocked
0
11
Punts Inside 20
10
2
Touchbacks
2
8
Fair Catches
18
14
Punt Returns
10
0
Punt Return Yards
0
0.0
Average Punt Return Yards
0.0
9
Team Games Played
9
38-1,570
Punt: Total Yards
41-1,683
Scoring
21
Rushing Touchdowns
13
14
Receiving Touchdowns
18
1
Return Touchdowns
1
36
Total Touchdowns
34
13
Field Goals
14
34
Kick Extra Points
34
1
Total Two Point Conversions
0
297
Total Points
280
33.0
Total Points Per Game
31.1