

VMI vs Virginia Tech Live Score (5 Sep, 2026)
Score by Quarter
| Team | Q1 | Q2 | Q3 | Q4 | Final |
|---|---|---|---|---|---|
 VMI |
0 | 0 | 0 | 3 | 3 |
 Virginia Tech |
21 | 24 | 21 | 7 | 73 |
Scoring Plays
Q1
11:41
11:41
J. Overton Jr. run for 50 yds, for a TD (J. Love KICK)
Rushing Touchdown
0 – 7
Q1
9:30
9:30
M. Hawkins Jr. run for 9 yds, for a TD (J. Love KICK)
Rushing Touchdown
0 – 14
Q1
4:56
4:56
J. Overton Jr. run for 23 yds, for a TD (J. Love KICK)
Rushing Touchdown
0 – 21
Q2
14:37
14:37
M. Hawkins Jr. run for 1 yd, for a TD (J. Love KICK)
Rushing Touchdown
0 – 28
Q2
9:58
9:58
J. Love 32 yd FG GOOD
Field Goal Good
0 – 31
Q2
5:13
5:13
E. Grunkemeyer pass to Q. Brown for 51 yds, for a TD (J. Love KICK)
Passing Touchdown
0 – 38
Q2
2:48
2:48
punt blocked by C. Harris (J. Love KICK)
Punt
0 – 45
Q3
12:33
12:33
E. Grunkemeyer pass to L. Reynolds for 21 yds, for a TD (J. Love KICK)
Passing Touchdown
0 – 52
Q3
6:52
6:52
M. Hawkins Jr. run for 2 yds, for a TD (J. Love KICK)
Rushing Touchdown
0 – 59
Q3
0:33
0:33
B. Baker pass to C. Wiggins for 40 yds, for a TD (J. Love KICK)
Passing Touchdown
0 – 66
Q4
10:38
10:38
A.J. Brand run for 1 yd, for a TD (J. Love KICK)
Rushing Touchdown
0 – 73
Q4
7:45
7:45
J. Joyce 50 yd FG GOOD
Field Goal Good
3 – 73
Game Leaders
VMIVirginia Tech
 J. Crump QB
Passing Yards
 E. Grunkemeyer QBT. Slaughter WR
Rushing Yards
 J. Overton Jr. RBH. Hardnett WR
Receiving Yards
 Q. Brown WR
 N. Land S
Tackles
 G. Ballance LB
—
Sacks
 A. Stevens DL
Player Box Score
VMI| Player | C/ATT | YDS | AVG | TD | INT |
|---|---|---|---|---|---|
| JoJo Crump#8 | 4/8 | 54 | 6.8 | 0 | 1 |
| Ian Reynolds#15 | 1/5 | 33 | 6.6 | 0 | 0 |
Virginia Tech| Player | C/ATT | YDS | AVG | TD | INT |
|---|---|---|---|---|---|
| Ethan Grunkemeyer#17 | 17/20 | 224 | 11.2 | 2 | 0 |
 Bryce Baker#22 | 10/12 | 127 | 10.6 | 1 | 0 |
VMI| Player | CAR | YDS | AVG | TD | LONG |
|---|---|---|---|---|---|
| Traveion Slaughter#1 | 3 | 21 | 7.0 | 0 | 21 |
| Leo Boehling#9 | 10 | 7 | 0.7 | 0 | 6 |
| Kam Johnson#22 | 2 | 4 | 2.0 | 0 | 4 |
| Team | 1 | 3 | 3.0 | 0 | 3 |
| Aslin Shipe#25 | 3 | 1 | 0.3 | 0 | 2 |
| Ian Reynolds#15 | 2 | 1 | 0.5 | 0 | 3 |
 Dylan Poley#44 | 2 | 0 | 0.0 | 0 | 2 |
| Trevin Simon#27 | 1 | 0 | 0.0 | 0 | 0 |
| Cole Varner#4 | 3 | -1 | -0.3 | 0 | 1 |
| Halim Hardnett#5 | 1 | -2 | -2.0 | 0 | 0 |
 Chandler Wilson#11 | 8 | -16 | -2.0 | 0 | 4 |
| JoJo Crump#8 | 8 | -19 | -2.4 | 0 | 4 |
Virginia Tech| Player | CAR | YDS | AVG | TD | LONG |
|---|---|---|---|---|---|
| Jeffrey Overton Jr.#16 | 9 | 104 | 11.6 | 2 | 50 |
 Marcellous Hawkins Jr.#27 | 12 | 69 | 5.8 | 3 | 14 |
 Messiah Mickens#26 | 5 | 23 | 4.6 | 0 | 10 |
 Darius Taylor#46 | 5 | 22 | 4.4 | 0 | 9 |
 John Buetow#35 | 2 | 19 | 9.5 | 0 | 11 |
 Tyler Mason#23 | 3 | 15 | 5.0 | 0 | 8 |
 A.J. Brand#18 | 2 | 10 | 5.0 | 1 | 9 |
| Ethan Grunkemeyer#17 | 2 | 6 | 3.0 | 0 | 3 |
VMI| Player | REC | YDS | AVG | TD | LONG |
|---|---|---|---|---|---|
| Halim Hardnett#5 | 1 | 33 | 33.0 | 0 | 33 |
| Cole Varner#4 | 2 | 23 | 11.5 | 0 | 12 |
| Traveion Slaughter#1 | 1 | 19 | 19.0 | 0 | 19 |
 Zach Pirtle#7 | 1 | 12 | 12.0 | 0 | 12 |
Virginia Tech| Player | REC | YDS | AVG | TD | LONG |
|---|---|---|---|---|---|
| Que'Sean Brown#3 | 6 | 109 | 18.2 | 1 | 51 |
 Luke Reynolds#85 | 5 | 50 | 10.0 | 1 | 21 |
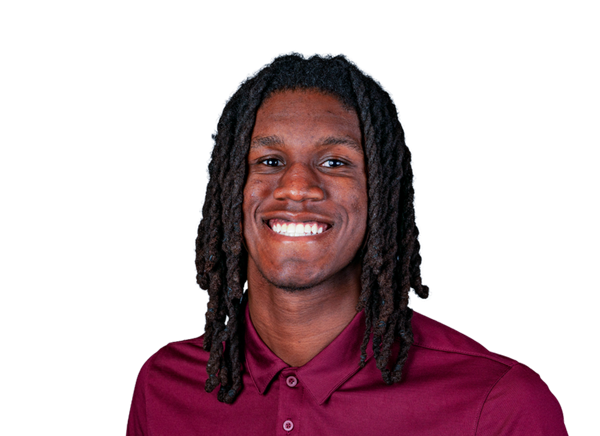 Chanz Wiggins#7 | 1 | 40 | 40.0 | 1 | 40 |
 Tyseer Denmark#4 | 2 | 36 | 18.0 | 0 | 19 |
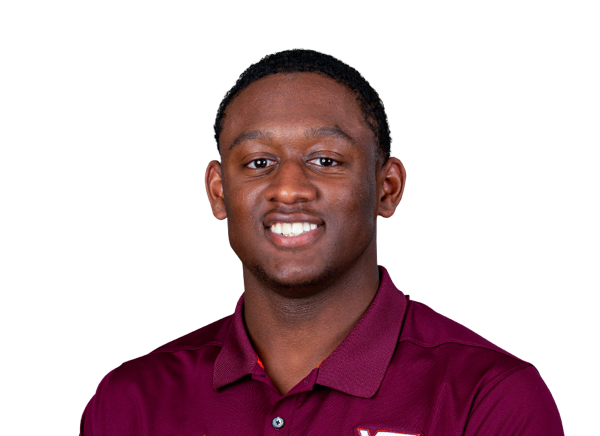 Ja'Ricous Hairston#13 | 1 | 33 | 33.0 | 0 | 33 |
| Davion Brown#11 | 3 | 31 | 10.3 | 0 | 12 |
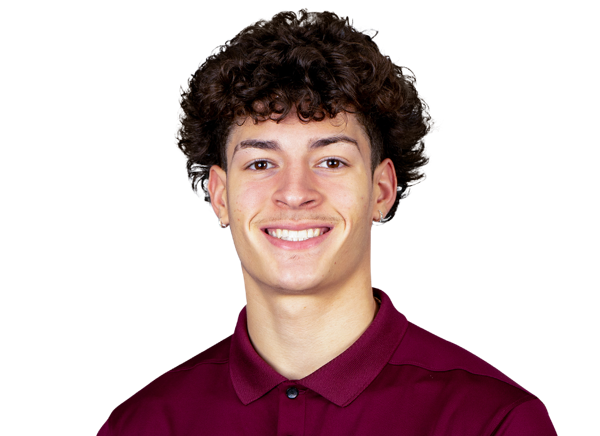 Ayden Greene | 3 | 23 | 7.7 | 0 | 9 |
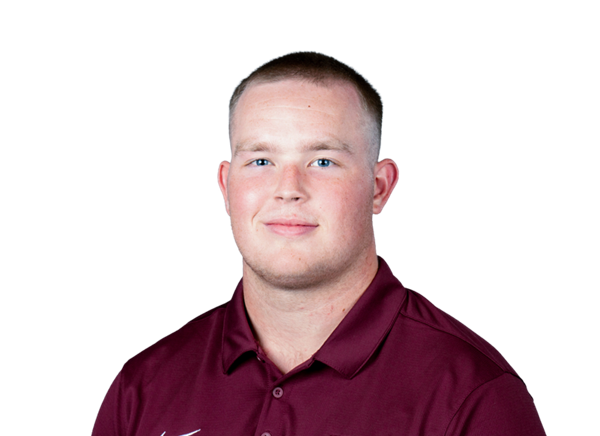 Harrison Saint Germain#87 | 1 | 10 | 10.0 | 0 | 10 |
 Keylen Adams#6 | 2 | 8 | 4.0 | 0 | 4 |
| Pierce Petersohn#88 | 2 | 6 | 3.0 | 0 | 3 |
| A.J. Brand#18 | 1 | 5 | 5.0 | 0 | 5 |
VMI| Player | TOT | SOLO | SACKS | TFL | PD | QB HUR | TD |
|---|---|---|---|---|---|---|---|
| Nic Land | 8 | 5 | 0 | 0 | 0 | 0 | 0 |
| Erick Roman#51 | 7 | 2 | 0 | 0 | 0 | 0 | 0 |
| Anthony Allen#2 | 5 | 2 | 0 | 0 | 0 | 0 | 0 |
| Camron Watkins#39 | 5 | 1 | 0 | 0 | 0 | 0 | 0 |
| Ethan Haston#5 | 4 | 2 | 0 | 0 | 0 | 0 | 0 |
| Ashton Dixon#6 | 4 | 2 | 0 | 0 | 0 | 0 | 0 |
| Robert Powell#11 | 4 | 1 | 0 | 0 | 0 | 0 | 0 |
 Ayden Babich#25 | 3 | 2 | 0 | 0 | 0 | 0 | 0 |
| Isaiah Grevious#1 | 3 | 2 | 0 | 1 | 0 | 0 | 0 |
| Keegan Guyton#16 | 3 | 2 | 0 | 0 | 0 | 0 | 0 |
| Jakari Nicely#24 | 3 | 1 | 0 | 0 | 0 | 0 | 0 |
| Nathan Jackson#38 | 3 | 1 | 0 | 0 | 0 | 0 | 0 |
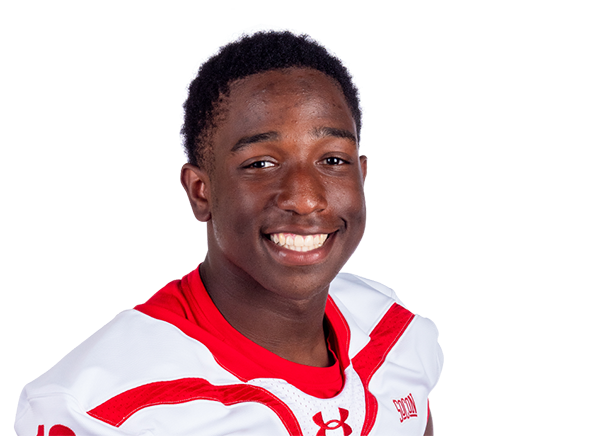 Malik Holmes#12 | 3 | 0 | 0 | 0 | 0 | 0 | 0 |
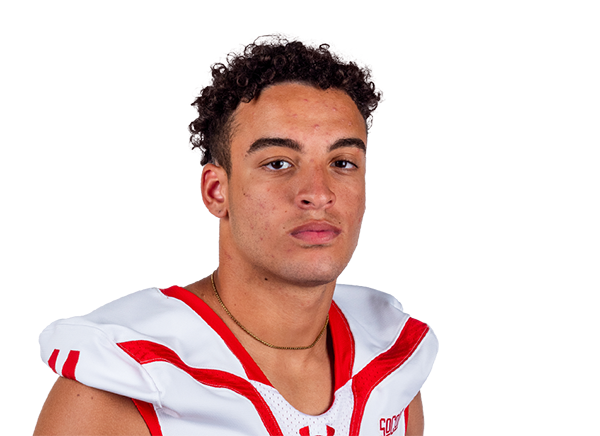 EJ Wilborne#14 | 2 | 1 | 0 | 0 | 0 | 0 | 0 |
| Omar Miller#3 | 2 | 1 | 0 | 0 | 0 | 0 | 0 |
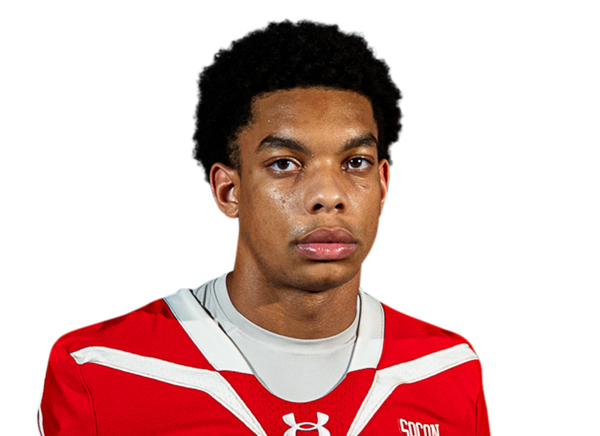 Corey Williams#17 | 2 | 1 | 0 | 0 | 0 | 0 | 0 |
| Amari Harmon#23 | 2 | 1 | 0 | 0 | 0 | 0 | 0 |
| Quinn Kennedy#46 | 2 | 1 | 0 | 0 | 0 | 0 | 0 |
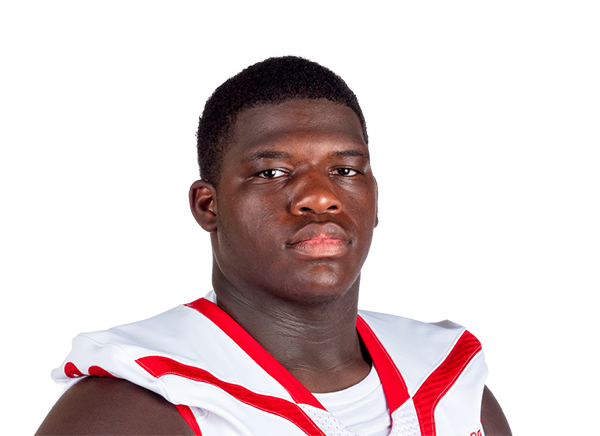 Elijah Brooks#90 | 2 | 0 | 0 | 0 | 0 | 0 | 0 |
 Camden Clinton#21 | 2 | 0 | 0 | 0 | 0 | 0 | 0 |
| Henry Berling#43 | 2 | 0 | 0 | 0 | 0 | 0 | 0 |
| Rod Tasco#4 | 2 | 0 | 0 | 0 | 0 | 0 | 0 |
| Terry Dorsey#29 | 2 | 0 | 0 | 0 | 0 | 0 | 0 |
| Matthias Corbin#32 | 1 | 1 | 0 | 0 | 0 | 0 | 0 |
| Liden Krush#89 | 1 | 0 | 0 | 0 | 0 | 0 | 0 |
| Nathaniel Mitchell#93 | 1 | 0 | 0 | 0 | 0 | 0 | 0 |
| Harrison Smith#94 | 1 | 0 | 0 | 0 | 0 | 0 | 0 |
Virginia Tech| Player | TOT | SOLO | SACKS | TFL | PD | QB HUR | TD |
|---|---|---|---|---|---|---|---|
| George Ballance#25 | 6 | 3 | 0 | 1 | 0 | 1 | 0 |
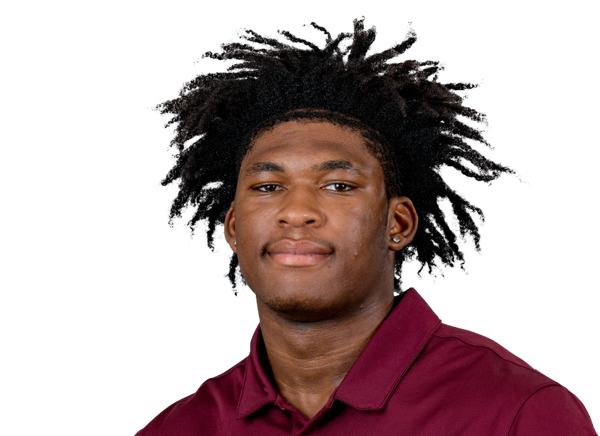 Noah Chambers#16 | 4 | 3 | 0 | 1 | 0 | 0 | 0 |
| Aycen Stevens#42 | 4 | 2 | 1.5 | 1.5 | 0 | 0 | 0 |
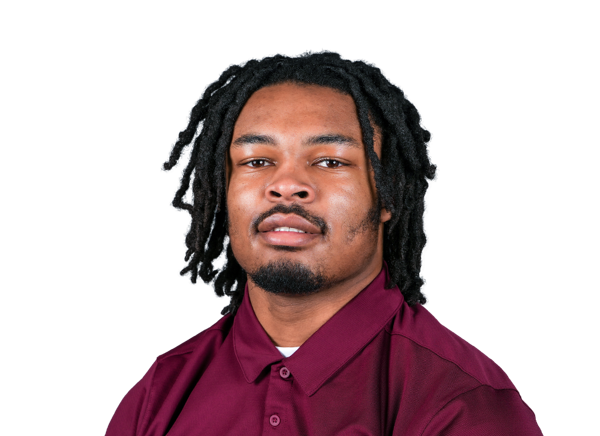 Keon Wylie#33 | 4 | 2 | 0.5 | 2 | 0 | 0 | 0 |
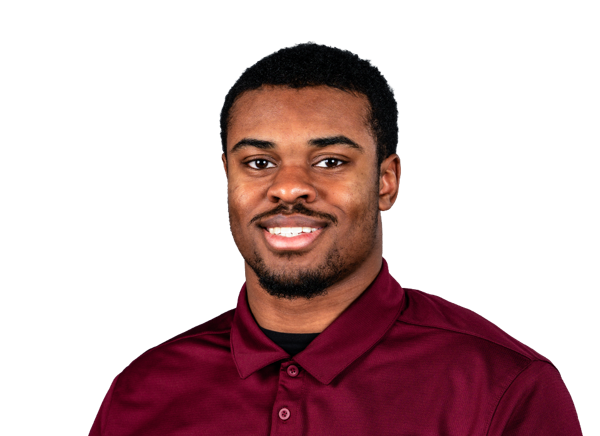 Curtis Jones Jr.#30 | 4 | 0 | 0 | 0.5 | 0 | 0 | 0 |
 Mylachi Williams#37 | 3 | 2 | 1 | 2.5 | 0 | 0 | 0 |
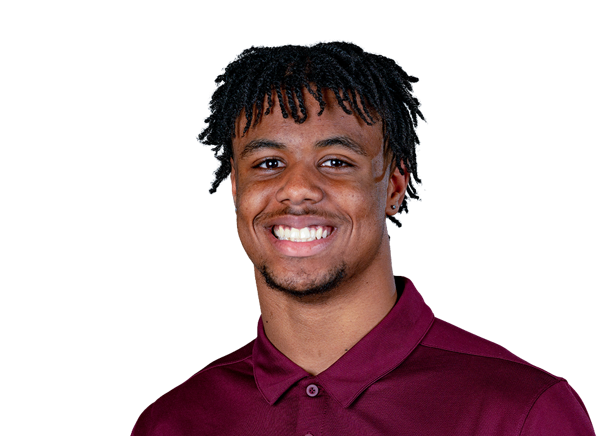 Quentin Reddish | 3 | 2 | 0 | 1 | 0 | 0 | 0 |
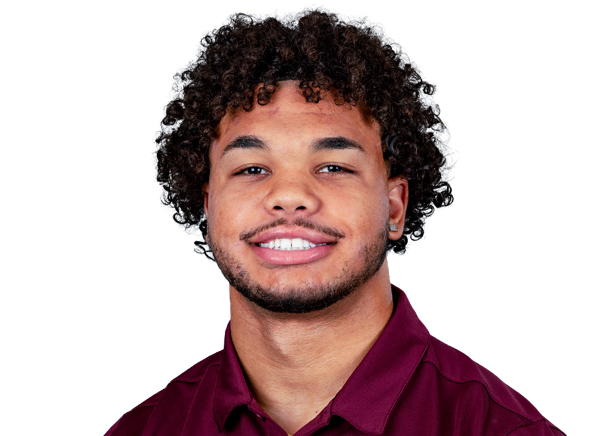 Kaleb Spencer#3 | 3 | 1 | 1 | 1.5 | 0 | 0 | 0 |
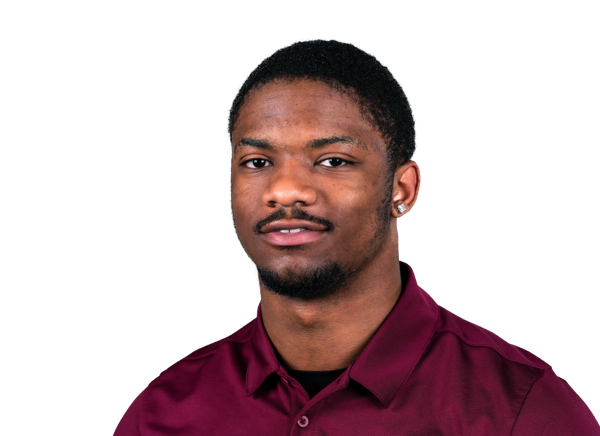 Cortez Harris#34 | 3 | 1 | 1 | 1.5 | 0 | 0 | 0 |
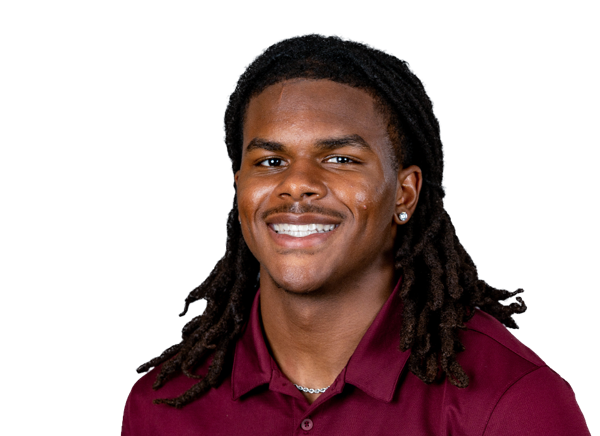 Sheldon Robinson#14 | 3 | 1 | 0 | 0.5 | 0 | 0 | 0 |
 Mathieu Lamah#19 | 3 | 1 | 0 | 0 | 0 | 0 | 0 |
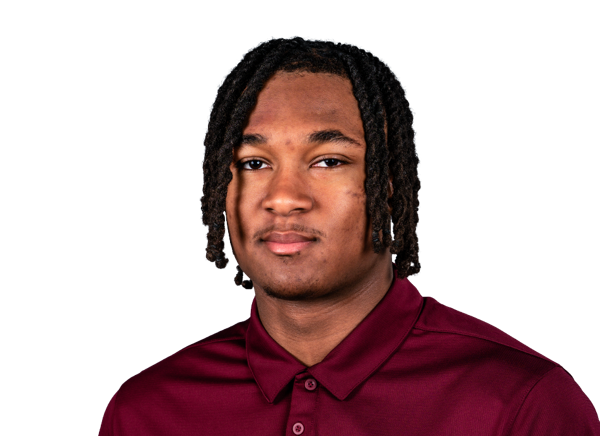 Daniel Jennings#56 | 2 | 2 | 0 | 0 | 0 | 0 | 0 |
 Samuel Okunlola#51 | 2 | 1 | 0 | 1.5 | 0 | 0 | 0 |
 Jason Abbey#31 | 2 | 1 | 0 | 0 | 0 | 0 | 0 |
 Gerard Johnson III#55 | 2 | 1 | 0 | 0 | 0 | 0 | 0 |
 Eric Mensah#45 | 2 | 1 | 0 | 0 | 0 | 0 | 0 |
| Zaevion Cleveland#21 | 2 | 1 | 0 | 0 | 1 | 0 | 0 |
 Sherrod Covil#7 | 2 | 0 | 0 | 1 | 0 | 1 | 0 |
 Tyson Flowers#1 | 2 | 0 | 0 | 0 | 0 | 0 | 0 |
 Elhadj Fall#94 | 2 | 0 | 0 | 0.5 | 0 | 0 | 0 |
 Knahlij Harrell#28 | 2 | 0 | 0 | 0 | 0 | 0 | 1 |
 Kemari Copeland#13 | 1 | 0 | 0 | 0.5 | 0 | 0 | 0 |
 Deric Dandy#32 | 1 | 0 | 0 | 0 | 0 | 0 | 0 |
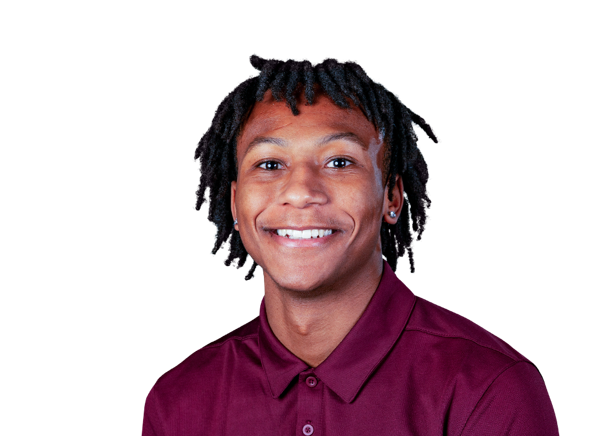 Joshua Clarke#5 | 1 | 0 | 0 | 0 | 0 | 0 | 0 |
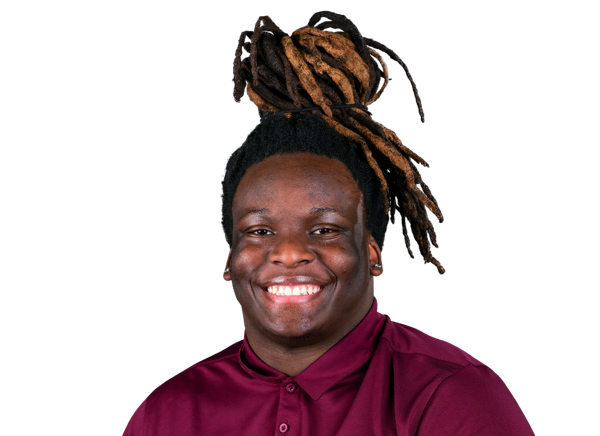 Randy Adirika#36 | 1 | 0 | 0 | 0 | 0 | 0 | 0 |
 Zeke Chinwike#58 | 1 | 0 | 0 | 0 | 0 | 0 | 0 |
 Sherrod Henderson#52 | 1 | 0 | 0 | 0 | 0 | 0 | 0 |
 Brennan Johnson#15 | 1 | 0 | 0 | 0 | 0 | 0 | 0 |
| Tyson Harley#27 | 1 | 0 | 0 | 0.5 | 0 | 0 | 0 |
 Terry Wiggins#39 | 1 | 0 | 0 | 0 | 0 | 0 | 0 |
| John-Patrick Oates#38 | 1 | 0 | 0 | 0.5 | 0 | 0 | 0 |
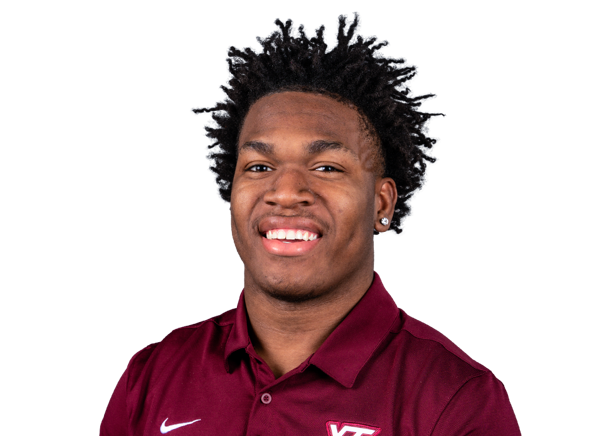 Jaquez White#2 | 1 | 0 | 0 | 0.5 | 0 | 0 | 0 |
VMI| Player | FUM | LOST | REC |
|---|---|---|---|
| JoJo Crump#8 | 2 | 0 | 0 |
| Robert Powell#11 | 0 | 0 | 1 |
| Quinn Kennedy#46 | 0 | 0 | 1 |
Virginia Tech| Player | FUM | LOST | REC |
|---|---|---|---|
| Team | 1 | 1 | 0 |
| Davion Brown#11 | 1 | 1 | 0 |
VMI| Player | FG | PCT | LONG | XP | PTS |
|---|---|---|---|---|---|
| Jack Joyce#35 | 1/2 | 50.0 | 50 | 0/0 | 3 |
Virginia Tech| Player | FG | PCT | LONG | XP | PTS |
|---|---|---|---|---|---|
 John Love#17 | 1/1 | 100.0 | 32 | 10/10 | 13 |
VMI| Player | NO | YDS | AVG | TB | In 20 | LONG |
|---|---|---|---|---|---|---|
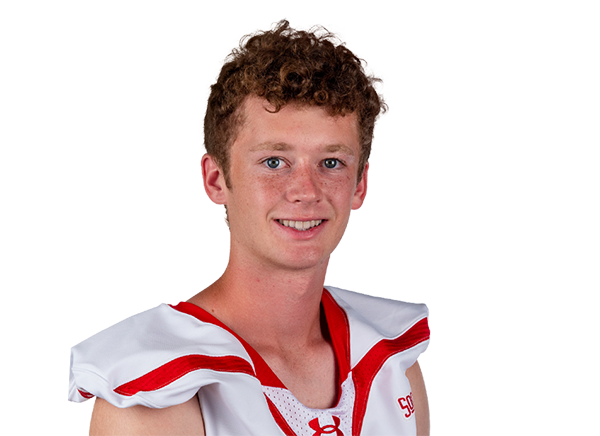 Ben Shrewsbury#99 | 5 | 216 | 43.2 | 1 | 0 | 56 |
| William Lees#42 | 5 | 175 | 35.0 | 0 | 0 | 45 |
| Team | 2 | 0 | 0.0 | 0 | 0 | 0 |
Virginia Tech| Player | NO | YDS | AVG | TB | In 20 | LONG |
|---|---|---|---|---|---|---|
 Nathan Totten#95 | 1 | 42 | 42.0 | 0 | 1 | 42 |
Virginia Tech| Player | NO | YDS | AVG | LONG | TD |
|---|---|---|---|---|---|
| Davion Brown#11 | 1 | 27 | 27.0 | 27 | 0 |
Virginia Tech| Player | NO | YDS | AVG | LONG | TD |
|---|---|---|---|---|---|
| Tyseer Denmark#4 | 2 | 40 | 20.0 | 29 | 0 |
| Que'Sean Brown#3 | 2 | 38 | 19.0 | 29 | 0 |
| Davion Brown#11 | 1 | 1 | 1.0 | 1 | 0 |
| Knahlij Harrell#28 | 0 | 0 | 0.0 | 0 | 1 |
| Tyson Flowers#1 | 1 | 0 | 0.0 | 0 | 0 |
| Cortez Harris#34 | 1 | 0 | 0.0 | 0 | 0 |
Virginia Tech| Player | INT | YDS | TD |
|---|---|---|---|
 Thomas Williams#23 | 1 | 0 | 0 |
Drive Summary
VT
Touchdown
75
VMI
Punt
-4
VT
Touchdown
9
VMI
Punt
-5
VT
Touchdown
56
VMI
Punt
16
VT
Touchdown
72
VMI
Punt
-5
VT
Field Goal
33
VMI
Punt
4
VT
Touchdown
65
VMI
Punt Return Touchdown
4
VMI
Punt
27
VT
End Of Half
33
VMI
Punt
-17
VT
Touchdown
24
VMI
Punt
0
VT
Touchdown
40
VMI
Interception
17
VT
Punt
-3
VMI
Punt
-5
VT
Touchdown
35
VMI
Punt
6
VT
Touchdown
65
VMI
Punt
5
VMI
Field Goal
3
VT
Downs
31
VMI
Missed FG
44
VT
End Of Quarter
49
Injury Report
No current injury report is available for this matchup.
Head-to-Head
Historical meetings are not available for this matchup.
Game Information
StageWeek 1
Season2026
KickoffSat, Sep 5, 7:30 pm
VenueLane Stadium
LocationBlacksburg, VA
SurfaceGrass
BroadcastACC Network, ACCNX
Division Standings
FCS — Southern Conference
| Team | W | L | T | Pct | PF | PA | Home | Away | Strk |
|---|---|---|---|---|---|---|---|---|---|
 Tennessee Tech | 0 | 0 | 0 | .000 | 0 | 0 | — | — | — |
 Wofford | 0 | 1 | 0 | 0.000 | 15 | 36 | 0-0 | 0-1 | L1 |
 Mercer | 0 | 1 | 0 | 0.000 | 11 | 44 | 0-0 | 0-1 | L1 |
 Western Carolina | 0 | 1 | 0 | 0.000 | 10 | 62 | 0-0 | 0-1 | L1 |
 East Tennessee State | 0 | 1 | 0 | 0.000 | 3 | 35 | 0-0 | 0-1 | L1 |
 Furman | 0 | 1 | 0 | 0.000 | 9 | 56 | 0-0 | 0-1 | L1 |
 Samford | 0 | 1 | 0 | 0.000 | 14 | 33 | 0-0 | 0-1 | L1 |
| VMI | 0 | 1 | 0 | 0.000 | 3 | 73 | 0-0 | 0-1 | L1 |
 Chattanooga | 0 | 0 | 0 | .000 | 0 | 0 | — | — | — |
 The Citadel | 1 | 1 | 0 | 0.500 | 43 | 82 | 0-0 | 1-1 | L1 |
FBS — Atlantic Coast Conference
| Team | W | L | T | Pct | PF | PA | Home | Away | Strk |
|---|---|---|---|---|---|---|---|---|---|
 Miami | 9 | 1 | 0 | 0.900 | 441 | 198 | 5-0 | 4-1 | W1 |
 Virginia | 5 | 5 | 0 | 0.500 | 269 | 215 | 5-2 | 0-3 | W1 |
 Duke | 7 | 3 | 0 | 0.700 | 322 | 153 | 4-1 | 3-2 | L1 |
 Florida State | 5 | 5 | 0 | 0.500 | 292 | 265 | 3-2 | 2-3 | W2 |
 North Carolina | 5 | 5 | 0 | 0.500 | 258 | 221 | 1-4 | 4-1 | L1 |
 Pittsburgh | 6 | 4 | 0 | 0.600 | 297 | 194 | 5-2 | 1-2 | L1 |
 Syracuse | 5 | 5 | 0 | 0.500 | 298 | 260 | 2-3 | 3-2 | W1 |
| Virginia Tech | 6 | 4 | 0 | 0.600 | 330 | 255 | 3-2 | 3-2 | L2 |
 Wake Forest | 9 | 1 | 0 | 0.900 | 439 | 150 | 4-1 | 5-0 | W7 |
 California | 3 | 7 | 0 | 0.300 | 204 | 320 | 2-3 | 1-4 | L4 |
 Clemson | 6 | 4 | 0 | 0.600 | 210 | 206 | 3-3 | 3-1 | L1 |
 Louisville | 7 | 3 | 0 | 0.700 | 383 | 247 | 4-1 | 3-2 | W5 |
 SMU | 7 | 3 | 0 | 0.700 | 340 | 255 | 6-1 | 1-2 | L1 |
 Boston College | 4 | 6 | 0 | 0.400 | 204 | 284 | 3-2 | 1-4 | L3 |
 Georgia Tech | 3 | 7 | 0 | 0.300 | 235 | 296 | 2-4 | 1-3 | W1 |
 Stanford | 5 | 5 | 0 | 0.500 | 223 | 358 | 4-1 | 1-4 | W1 |
 NC State | 4 | 6 | 0 | 0.400 | 291 | 282 | 4-3 | 0-3 | L2 |
VMI
10th in Southern
VS
Virginia Tech
10th in ACC
Quarterbacks & Specialists
#8
JoJo Crump
#15
Ian Reynolds
#11
Chandler Wilson
Receivers & Backs
#9
Leo Boehling
#5
Halim Hardnett
#22
Kam Johnson
#89
Liden Krush
#7
Zach Pirtle
#44
Dylan Poley
#25
Aslin Shipe
#27
Trevin Simon
#1
Traveion Slaughter
#4
Cole Varner
Defensive Line & Linebackers
#43
Henry Berling
#90
Elijah Brooks
#21
Camden Clinton
#32
Matthias Corbin
#1
Isaiah Grevious
#38
Nathan Jackson
#46
Quinn Kennedy
#93
Nathaniel Mitchell
#24
Jakari Nicely
#51
Erick Roman
#94
Harrison Smith
#4
Rod Tasco
#39
Camron Watkins
Defensive Backs
#2
Anthony Allen
#25
Ayden Babich
#6
Ashton Dixon
#29
Terry Dorsey
#16
Keegan Guyton
#23
Amari Harmon
#5
Ethan Haston
#12
Malik Holmes
Nic Land
#3
Omar Miller
#11
Robert Powell
#14
EJ Wilborne
#17
Corey Williams
Other
#35
Jack Joyce
#42
William Lees
#99
Ben Shrewsbury
Quarterbacks & Specialists
#22
Bryce Baker
#17
Ethan Grunkemeyer
#95
Nathan Totten
Receivers & Backs
#6
Keylen Adams
#18
A.J. Brand
#11
Davion Brown
#3
Que'Sean Brown
#35
John Buetow
#4
Tyseer Denmark
Ayden Greene
#13
Ja'Ricous Hairston
#27
Marcellous Hawkins Jr.
#23
Tyler Mason
#26
Messiah Mickens
#16
Jeffrey Overton Jr.
#88
Pierce Petersohn
#85
Luke Reynolds
#87
Harrison Saint Germain
#46
Darius Taylor
#7
Chanz Wiggins
Defensive Line & Linebackers
#31
Jason Abbey
#36
Randy Adirika
#25
George Ballance
#16
Noah Chambers
#58
Zeke Chinwike
#13
Kemari Copeland
#32
Deric Dandy
#94
Elhadj Fall
#27
Tyson Harley
#34
Cortez Harris
#52
Sherrod Henderson
#56
Daniel Jennings
#55
Gerard Johnson III
#30
Curtis Jones Jr.
#19
Mathieu Lamah
#45
Eric Mensah
#38
John-Patrick Oates
#51
Samuel Okunlola
#3
Kaleb Spencer
#42
Aycen Stevens
#39
Terry Wiggins
#37
Mylachi Williams
#33
Keon Wylie
Defensive Backs
#5
Joshua Clarke
#21
Zaevion Cleveland
#7
Sherrod Covil
#1
Tyson Flowers
#28
Knahlij Harrell
#15
Brennan Johnson
Quentin Reddish
#14
Sheldon Robinson
#2
Jaquez White
#23
Thomas Williams
Other
#17
John Love
VMI
10th in Southern
VS
Virginia Tech
7th in ACC
Passing
43.7
Completion Percentage
69.9
59
Completions
244
8.10
Interception Percentage
1.40
11
Interceptions
5
75
Longest Pass
69
824
Net Passing Yards
2,836
74.9
Net Passing Yards Per Game
283.6
135
Passing Attempts
349
3.70
Passing Touchdown %
6.00
5
Passing Touchdowns
21
91.0
Passer Rating
155.0
20
Total Sacks
33
106
Sack Yards Lost
217
6.1
Yards Per Pass Attempt
8.1
824
Passing Yards
2,836
0
Passing Fumbles Lost
0
11
Team Games Played
10
201.1
Yards Per Game
420.8
9.9
Total Points Per Game
33.0
109
Total Points
330
13
Total Touchdowns
42
74.9
Passing Yards Per Game
283.6
59-135
Comp-Att
244-349
20-106
Sacks-Yards Lost
33-217
Rushing
475
Rushing Attempts
368
1,388
Rushing Yards
1,372
2.9
Yards Per Rush Attempt
3.7
61
Long Rushing
76
0
20+ Yard Rushing Plays
0
7
Rushing Touchdowns
19
126.2
Rushing Yards Per Game
137.2
0
Rushing Fumbles
0
0
Rushing Fumbles Lost
0
81
Rushing 1st downs
90
11
Team Games Played
10
2,212
Total Yards
4,208
630
Total Offensive Plays
750
9.9
Total Points Per Game
33.0
109
Total Points
330
13
Total Touchdowns
42
Receiving
59
Receptions
244
0
Receiving Targets
0
824
Receiving Yards
2,836
824
Receiving Yards
2,836
5
Receiving Touchdowns
21
75
Long Reception
69
0
20+ Yard Receiving Plays
0
74.9
Receiving Yards Per Game
283.6
0
Receiving Fumbles
0
0
Receiving Fumbles Lost
0
30
Receiving Yards After Catch
1741
31
Receiving First Downs
113
11
Team Games Played
10
14.0
Yards Per Reception
11.6
9.9
Total Points Per Game
33.0
109
Total Points
330
13
Total Touchdowns
42
Miscellaneous
124
Total 1st downs
229
81
Rushing 1st downs
90
31
Passing 1st downs
113
12
1st downs by penalty
26
43
Third Down Conversions
60
156
Third Down Attempts
144
27.56
3rd down %
41.67
7
Fourth Down Conversions
15
14
First Downs Attempts
22
50.00
4th down %
68.18
44
Total Penalties
63
336
Total Penalty Yards
565
19323
Possession Time Seconds
18669
0.00
Red Zone Field Goal Percentage
0.00
0.00
Red Zone Scoring Percentage
0.00
0.00
Red Zone Efficiency Percentage
0.00
0.00
Red Zone Touchdown Percentage
0.00
20
Total Takeaways
9
14
Total Giveaways
15
6
Turnover Ratio
-6
0
Fumbles Lost
0
43-156
3rd down efficiency
60-144
7-14
4th down efficiency
15-22
44-336
Total-Yards
63-565
Defense
390
Solo Tackles
313
424
Assist Tackles
284
814
Total Tackles
597
11
Sacks
28
43
Sack Yards
174
53
Stuffs
108
19
Passes Defended
37
6.2
Average Interception Yards
7.3
22
Long Interception
22
0
Miscellaneous Touchdowns
0
0
Kicks Blocked
2
30
Tackles For Loss
65
11
Team Games Played
10
Defensive Interceptions
5
Interceptions
3
31
Interception Yards
22
0
Interception Touchdowns
0
5-31
INT: Total
3-22
General
16
Fumbles
14
7
Forced Fumbles
11
9
Fumbles Recovered
4
1
Fumbles Touchdowns
1
11
Games Played
10
16-0
Fumbles-Lost
14-0
Returning
9
Kick Returns
13
127
Kick Return Yards
308
14.1
Yards Per Kick Return
23.7
23
Long Kick Return
62
0
Kick Return Touchdowns
0
5
Punt Returns
18
35
Punt Return Yards
363
7.0
Yards Per Punt Return
20.2
24
Long Punt Return
79
0
Punt Return Touchdowns
1
0
Punt Return Fair Catches
0
0
Kick Return Fumbles Lost
0
0
Punt Return Fumbles Lost
0
11
Team Games Played
10
5-35
Punt: Total
18-363
Kicking
6
Field Goal Made
11
14
Field Goal Attempts
14
42.9
Field Goal Percentage
78.6
50
Long Field Goal Made
47
0
Field Goal Attempts 1-19
0
4
Field Goal Attempts 20-29
5
1
Field Goal Attempts 30-39
6
6
Field Goal Attempts 40-49
2
3
Field Goal Attempts 50+
1
13
Extra Points Made
35
13
Extra Point Attempts
36
100.0
Extra Point Percentage
97.2
0
Field Goals Made 1-19
0
3
Field Goals Made 20-29
5
0
Field Goals Made 30-39
4
2
Field Goals Made 40-49
2
1
Field Goals Made 50+
0
31
Total Kicking Points
68
11
Team Games Played
10
52
Touchback Percentage
80
0.0
Average Kickoff Return Yards
0.0
0
Kickoff Return Yards
0
0
Kickoff Returns
0
0-0
Kickoffs: Total
0-0
6-14
FG: Good-Attempts
11-14
Punting
75
Punts
35
3,161
Punt Yards
1,490
64
Long Punt
60
42.1
Gross Average Punt Yards
42.6
42.1
Net Average Punt Yards
42.6
0
Punts Blocked
0
16
Punts Inside 20
14
4
Touchbacks
2
9
Fair Catches
9
42
Punt Returns
12
0
Punt Return Yards
0
0.0
Average Punt Return Yards
0.0
11
Team Games Played
10
75-3,161
Punt: Total Yards
35-1,490
Scoring
7
Rushing Touchdowns
19
5
Receiving Touchdowns
21
0
Return Touchdowns
1
13
Total Touchdowns
42
6
Field Goals
11
13
Kick Extra Points
35
0
Total Two Point Conversions
4
109
Total Points
330
9.9
Total Points Per Game
33.0