

Western Kentucky vs Indiana Live Score (19 Sep, 2026)
Score by Quarter
| Team | Q1 | Q2 | Q3 | Q4 | Final |
|---|---|---|---|---|---|
 Western Kentucky |
0 | 0 | 0 | 0 | 0 |
 Indiana |
0 | 14 | 17 | 7 | 38 |
Scoring Plays
Q2
9:51
9:51
Davion Chandler 26 Yd pass from Josh Hoover (Paddy McAteer Kick)
Passing Touchdown
0 – 7
Q2
0:37
0:37
Lee Beebe Jr. 1 Yd Run (Paddy McAteer Kick)
Rushing Touchdown
0 – 14
Q3
11:43
11:43
Paddy McAteer 21 Yd Field Goal
Field Goal Good
0 – 17
Q3
10:43
10:43
Charlie Becker 79 Yd pass from Josh Hoover (Paddy McAteer Kick)
Passing Touchdown
0 – 24
Q3
1:38
1:38
Lee Beebe Jr. 2 Yd Run (Paddy McAteer Kick)
Rushing Touchdown
0 – 31
Q4
7:10
7:10
Turbo Richard 25 Yd Run (Paddy McAteer Kick)
Rushing Touchdown
0 – 38
Game Leaders
Western KentuckyIndiana
 B. Glenn QB
Passing Yards
 J. Hoover QBB. Glenn QB
Rushing Yards
 T. Richard RB
 C. Ezirim TE
Receiving Yards
 C. Becker WR
 M. Malotumau DT
Sacks
 T. Osunsanmi DL
 J. Lewis DB
Tackles
 R. Hardy LB
Player Box Score
Western Kentucky| Player | C/ATT | YDS | AVG | TD | INT | QBR |
|---|---|---|---|---|---|---|
| Brock Glenn#11 | 17/32 | 120 | 3.8 | 0 | 1 | 25.3 |
Indiana| Player | C/ATT | YDS | AVG | TD | INT | QBR |
|---|---|---|---|---|---|---|
| Josh Hoover#10 | 18/24 | 273 | 11.4 | 2 | 0 | 73.7 |
 Grant Wilson#2 | 1/1 | 7 | 7.0 | 0 | 0 | -- |
Western Kentucky| Player | CAR | YDS | AVG | TD | LONG |
|---|---|---|---|---|---|
| Brock Glenn#11 | 11 | 30 | 2.7 | 0 | 9 |
 Ajay Allen#3 | 10 | 22 | 2.2 | 0 | 9 |
 Jonathan Stafford Jr.#80 | 3 | 14 | 4.7 | 0 | 6 |
 Le'Kamren Meadows#22 | 2 | 5 | 2.5 | 0 | 5 |
 Zion Taylor#17 | 1 | 4 | 4.0 | 0 | 4 |
 Team | 1 | -2 | -2.0 | 0 | -2 |
 Cameron Flowers#4 | 1 | -7 | -7.0 | 0 | 0 |
Indiana| Player | CAR | YDS | AVG | TD | LONG |
|---|---|---|---|---|---|
| Turbo Richard#1 | 15 | 149 | 9.9 | 1 | 31 |
 Lee Beebe Jr.#29 | 17 | 50 | 2.9 | 2 | 11 |
 Sean Cuono#20 | 5 | 29 | 5.8 | 0 | 9 |
| Jayreon Campbell#22 | 1 | 7 | 7.0 | 0 | 7 |
| Josh Hoover#10 | 2 | 2 | 1.0 | 0 | 5 |
| Grant Wilson#2 | 1 | -4 | -4.0 | 0 | 0 |
Western Kentucky| Player | REC | YDS | AVG | TD | LONG |
|---|---|---|---|---|---|
| CC Ezirim#14 | 2 | 30 | 15.0 | 0 | 21 |
| Jonathan Stafford Jr.#80 | 6 | 27 | 4.5 | 0 | 15 |
| Cameron Flowers#4 | 2 | 20 | 10.0 | 0 | 16 |
 Lofton Howard#19 | 2 | 19 | 9.5 | 0 | 14 |
 Quincy Burroughs#12 | 1 | 11 | 11.0 | 0 | 11 |
| Ajay Allen#3 | 3 | 8 | 2.7 | 0 | 4 |
 Moussa Barry#8 | 1 | 5 | 5.0 | 0 | 5 |
Indiana| Player | REC | YDS | AVG | TD | LONG |
|---|---|---|---|---|---|
| Charlie Becker#80 | 5 | 127 | 25.4 | 1 | 79 |
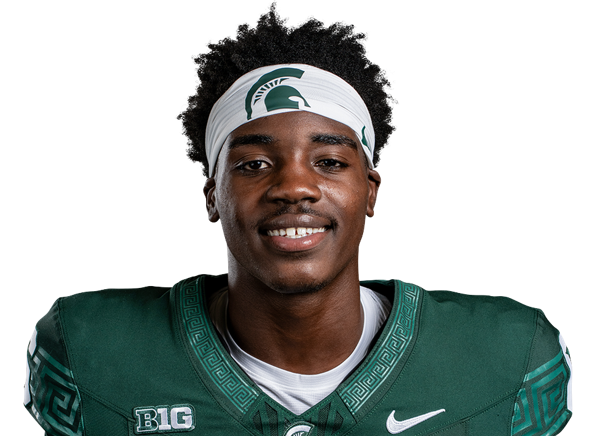 Nick Marsh#11 | 7 | 81 | 11.6 | 0 | 25 |
 Shazz Preston#7 | 3 | 32 | 10.7 | 0 | 16 |
 Davion Chandler#4 | 2 | 24 | 12.0 | 1 | 26 |
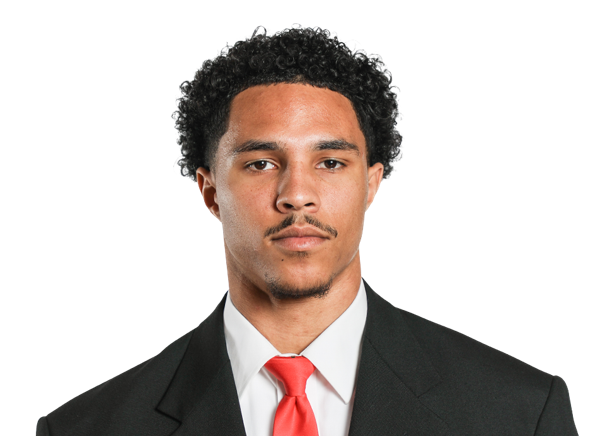 Tyler Morris#8 | 1 | 14 | 14.0 | 0 | 14 |
| Lee Beebe Jr.#29 | 1 | 2 | 2.0 | 0 | 2 |
Western Kentucky| Player | TOT | SOLO | SACKS | TFL | PD | QB HUR | TD |
|---|---|---|---|---|---|---|---|
| Jaylen Lewis#7 | 11 | 6 | 0 | 0 | 0 | 0 | 0 |
 Xavion Griffin#10 | 9 | 5 | 0 | 0.5 | 0 | 0 | 0 |
 Westen Ard#32 | 9 | 4 | 1 | 1.5 | 0 | 0 | 0 |
 Jaylen Wester#21 | 8 | 6 | 0 | 0 | 0 | 0 | 0 |
 Justin Brown#6 | 5 | 3 | 0 | 0 | 1 | 0 | 0 |
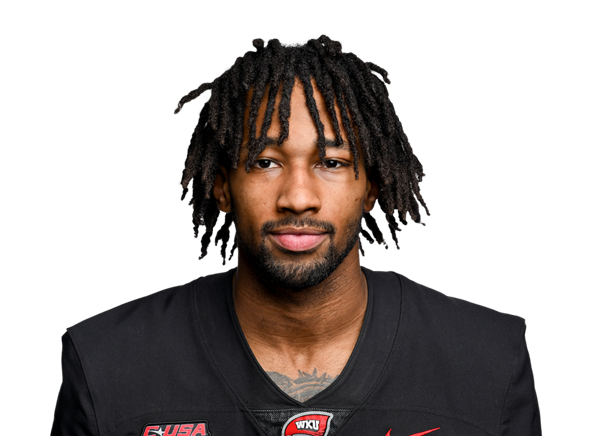 Tony Newsome Jr.#2 | 4 | 3 | 0 | 0 | 0 | 0 | 0 |
 Latrevion Thompson#13 | 4 | 2 | 0 | 0 | 0 | 0 | 0 |
| Mackavelli Malotumau | 3 | 2 | 1 | 2 | 0 | 0 | 0 |
 Dave Herard#5 | 3 | 2 | 0 | 0 | 0 | 0 | 0 |
 Rylen Su'a-Filo#93 | 3 | 2 | 0 | 0 | 0 | 0 | 0 |
| Brock Glenn#11 | 1 | 1 | 0 | 0 | 0 | 0 | 0 |
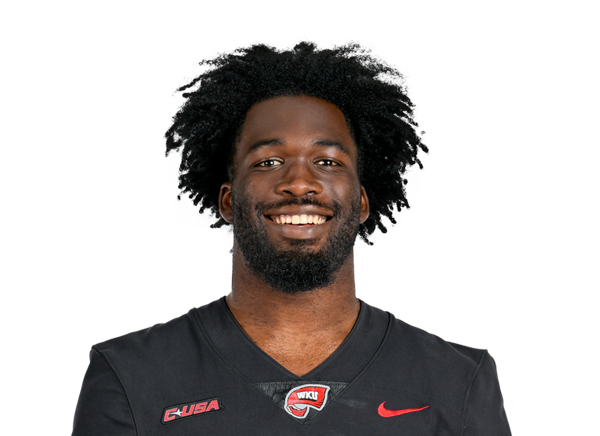 Christian White#3 | 1 | 1 | 0 | 0 | 0 | 0 | 0 |
 Javin Griffin#92 | 1 | 1 | 0 | 0 | 0 | 0 | 0 |
 Geajorm Akpaloo#18 | 1 | 1 | 0 | 0 | 0 | 0 | 0 |
 Zsacari Minnis#17 | 1 | 1 | 0 | 0 | 0 | 0 | 0 |
 Jaylen Pollard#39 | 1 | 1 | 0 | 0 | 0 | 0 | 0 |
 Braxton Myers#14 | 1 | 0 | 0 | 0 | 0 | 0 | 0 |
 Jakeem Fletcher#52 | 1 | 0 | 0 | 0 | 0 | 0 | 0 |
 Darius Hampton#16 | 1 | 0 | 0 | 0 | 0 | 0 | 0 |
 Josaiah Knight#45 | 1 | 0 | 0 | 0 | 0 | 0 | 0 |
 Jacob Cosby-Mosley#19 | 1 | 0 | 0 | 0 | 0 | 0 | 0 |
 Elijah Rumph#35 | 1 | 0 | 0 | 0 | 0 | 0 | 0 |
Indiana| Player | TOT | SOLO | SACKS | TFL | PD | QB HUR | TD |
|---|---|---|---|---|---|---|---|
| Rolijah Hardy#5 | 9 | 6 | 0 | 2 | 0 | 1 | 0 |
 Preston Zachman#6 | 8 | 3 | 0 | 0 | 0 | 0 | 0 |
 Ryland Gandy#10 | 6 | 4 | 0 | 0 | 0 | 0 | 0 |
 Isaiah Jones#46 | 5 | 4 | 0 | 1 | 0 | 1 | 0 |
 Jamari Sharpe#22 | 5 | 3 | 0 | 1 | 1 | 0 | 0 |
 Amare Ferrell#1 | 5 | 2 | 0 | 0.5 | 0 | 0 | 0 |
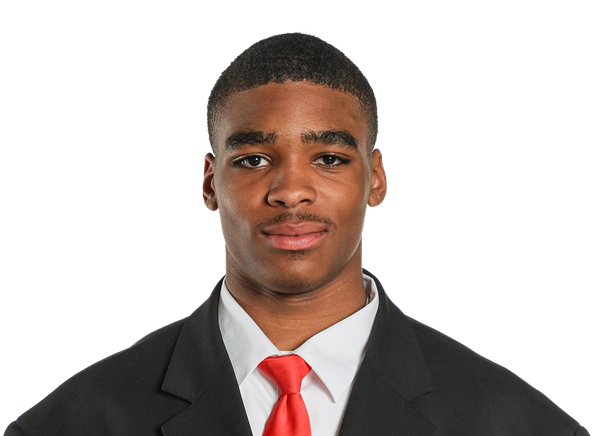 Byron Baldwin Jr.#2 | 4 | 1 | 0 | 0.5 | 1 | 0 | 0 |
 Tyrique Tucker#95 | 2 | 2 | 0 | 1 | 0 | 1 | 0 |
 Jaylen Bell#3 | 2 | 1 | 0 | 0 | 0 | 0 | 0 |
| Tobi Osunsanmi#12 | 1 | 1 | 1 | 1 | 0 | 1 | 0 |
 Kaiden Turner#14 | 1 | 1 | 0 | 0 | 0 | 0 | 0 |
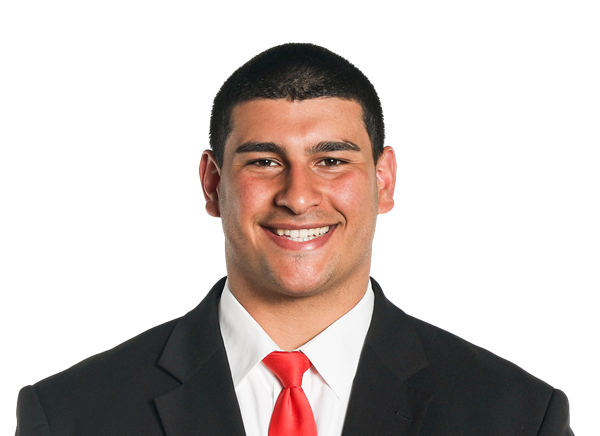 Mario Landino#97 | 1 | 1 | 0 | 0 | 0 | 2 | 0 |
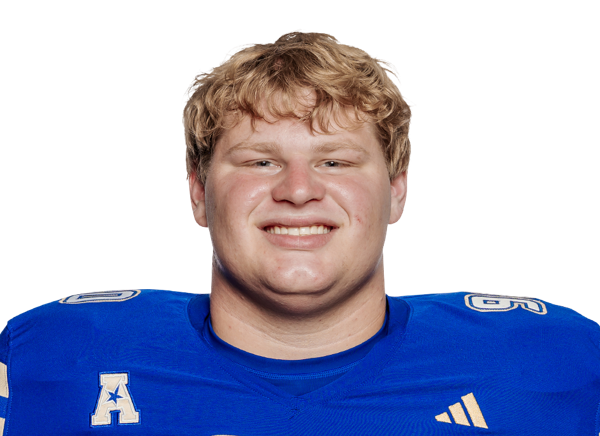 Joe Hjelle#90 | 1 | 1 | 0 | 0 | 0 | 0 | 0 |
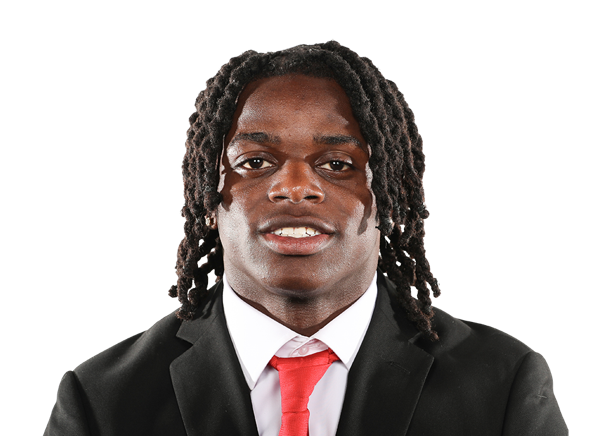 Quan Sanks#13 | 1 | 0 | 0 | 0 | 0 | 0 | 0 |
| Jamar Owens#16 | 1 | 0 | 0 | 0 | 0 | 0 | 0 |
 Josh Burnham#8 | 0 | 0 | 0 | 0 | 0 | 2 | 0 |
 Chiddi Obiazor#7 | 0 | 0 | 0 | 0 | 0 | 1 | 0 |
 Daniel Ndukwe#17 | 0 | 0 | 0 | 0 | 0 | 1 | 0 |
| Cam McHaney#98 | 0 | 0 | 0 | 0 | 0 | 1 | 0 |
| Blake Smythe#91 | 0 | 0 | 0 | 0 | 0 | 1 | 0 |
Western Kentucky| Player | FUM | LOST | REC |
|---|---|---|---|
| Brock Glenn#11 | 2 | 0 | 0 |
| Moussa Barry#8 | 1 | 0 | 0 |
Indiana| Player | FUM | LOST | REC |
|---|---|---|---|
| Nick Marsh#11 | 1 | 0 | 0 |
Indiana| Player | FG | PCT | LONG | XP | PTS |
|---|---|---|---|---|---|
 Paddy McAteer#35 | 1/2 | 50.0 | 21 | 5/5 | 8 |
Western Kentucky| Player | NO | YDS | AVG | TB | In 20 | LONG |
|---|---|---|---|---|---|---|
 Jackson Smith#43 | 7 | 333 | 47.6 | 1 | 0 | 64 |
Indiana| Player | NO | YDS | AVG | TB | In 20 | LONG |
|---|---|---|---|---|---|---|
 Billy Gowers#19 | 4 | 154 | 38.5 | 0 | 2 | 43 |
Indiana| Player | NO | YDS | AVG | LONG | TD |
|---|---|---|---|---|---|
| Josh Burnham#8 | 1 | 8 | 8.0 | 8 | 0 |
Indiana| Player | NO | YDS | AVG | LONG | TD |
|---|---|---|---|---|---|
| Charlie Becker#80 | 1 | 17 | 17.0 | 17 | 0 |
Indiana| Player | INT | YDS | TD |
|---|---|---|---|
| Isaiah Jones#46 | 1 | 21 | 0 |
Drive Summary
WKU
Punt
5
IU
Missed FG
39
WKU
Downs
62
IU
Touchdown
98
WKU
Punt
17
IU
Downs
45
WKU
Downs
35
IU
Punt
15
WKU
Interception
5
IU
Touchdown
3
WKU
End Of Half
-2
IU
Field Goal
58
WKU
Punt
1
IU
Touchdown
79
WKU
Punt
18
IU
Punt
3
WKU
Downs
23
IU
Touchdown
50
WKU
Punt
4
IU
Punt
-4
WKU
Punt
0
IU
Touchdown
80
WKU
Punt
3
IU
End Of Quarter
27
Injury Report
No current injury report is available for this matchup.
Head-to-Head
Historical meetings are not available for this matchup.
Game Information
StageWeek 3
Season2026
KickoffSat, Sep 19, 4:00 pm
VenueMemorial Stadium (Bloomington, IN)
LocationBloomington, IN
SurfaceArtificial Turf
BroadcastPeacock
Attendance54,695
Division Standings
FBS — Conference USA
| Team | W | L | T | Pct | PF | PA | Home | Away | Strk |
|---|---|---|---|---|---|---|---|---|---|
 Delaware | 5 | 5 | 0 | 0.500 | 297 | 278 | 4-1 | 1-4 | W1 |
 Liberty | 9 | 1 | 0 | 0.900 | 328 | 145 | 5-0 | 4-1 | W9 |
 Middle Tennessee | 5 | 5 | 0 | 0.500 | 265 | 307 | 4-1 | 1-4 | L1 |
 Jacksonville State | 7 | 3 | 0 | 0.700 | 286 | 208 | 5-0 | 2-3 | L1 |
 Florida International | 4 | 6 | 0 | 0.400 | 190 | 207 | 4-1 | 0-5 | L1 |
 Kennesaw State | 4 | 6 | 0 | 0.400 | 252 | 250 | 2-3 | 2-3 | W3 |
 Missouri State | 4 | 6 | 0 | 0.400 | 242 | 291 | 4-1 | 0-5 | W1 |
 New Mexico State | 3 | 7 | 0 | 0.300 | 207 | 259 | 2-3 | 1-4 | L3 |
 Sam Houston | 1 | 9 | 0 | 0.100 | 165 | 274 | 1-4 | 0-5 | L7 |
| Western Kentucky | 4 | 6 | 0 | 0.400 | 247 | 324 | 3-1 | 1-5 | W1 |
FBS — Big Ten Conference
| Team | W | L | T | Pct | PF | PA | Home | Away | Strk |
|---|---|---|---|---|---|---|---|---|---|
 USC | 7 | 3 | 0 | 0.700 | 305 | 245 | 5-1 | 2-2 | L1 |
 UCLA | 10 | 0 | 0 | 1.000 | 324 | 141 | 6-0 | 4-0 | W10 |
| Indiana | 9 | 1 | 0 | 0.900 | 319 | 125 | 6-1 | 3-0 | W3 |
 Iowa | 8 | 2 | 0 | 0.800 | 278 | 117 | 5-1 | 3-1 | W3 |
 Michigan | 5 | 5 | 0 | 0.500 | 183 | 177 | 4-3 | 1-2 | L2 |
 Nebraska | 6 | 4 | 0 | 0.600 | 303 | 149 | 4-2 | 2-2 | W1 |
 Penn State | 6 | 4 | 0 | 0.600 | 302 | 188 | 4-2 | 2-2 | W3 |
 Washington | 6 | 4 | 0 | 0.600 | 258 | 211 | 3-3 | 3-1 | W1 |
 Northwestern | 6 | 4 | 0 | 0.600 | 298 | 202 | 5-1 | 1-3 | L3 |
 Illinois | 6 | 4 | 0 | 0.600 | 270 | 229 | 4-2 | 2-2 | L1 |
 Maryland | 4 | 6 | 0 | 0.400 | 273 | 303 | 2-4 | 2-2 | W2 |
 Michigan State | 3 | 8 | 0 | 0.273 | 195 | 278 | 2-5 | 1-3 | L2 |
 Minnesota | 5 | 5 | 0 | 0.500 | 236 | 240 | 4-2 | 1-3 | L3 |
 Ohio State | 7 | 3 | 0 | 0.700 | 349 | 184 | 5-1 | 2-2 | W1 |
 Oregon | 8 | 3 | 0 | 0.727 | 383 | 213 | 5-1 | 3-2 | W4 |
 Wisconsin | 6 | 4 | 0 | 0.600 | 241 | 171 | 5-0 | 1-4 | L1 |
 Purdue | 3 | 7 | 0 | 0.300 | 272 | 319 | 2-4 | 1-3 | L4 |
 Rutgers | 2 | 8 | 0 | 0.200 | 232 | 323 | 1-5 | 1-3 | L4 |
Western Kentucky
6th in CUSA
VS
Indiana
2nd in Big Ten
Quarterbacks & Specialists
#11
Brock Glenn
Receivers & Backs
#3
Ajay Allen
#8
Moussa Barry
#12
Quincy Burroughs
#14
CC Ezirim
#4
Cameron Flowers
#19
Lofton Howard
#22
Le'Kamren Meadows
#80
Jonathan Stafford Jr.
#17
Zion Taylor
Defensive Line & Linebackers
#18
Geajorm Akpaloo
#32
Westen Ard
#52
Jakeem Fletcher
#92
Javin Griffin
#16
Darius Hampton
#45
Josaiah Knight
Mackavelli Malotumau
#17
Zsacari Minnis
#35
Elijah Rumph
#93
Rylen Su'a-Filo
#13
Latrevion Thompson
#21
Jaylen Wester
Defensive Backs
#6
Justin Brown
#19
Jacob Cosby-Mosley
#10
Xavion Griffin
#5
Dave Herard
#7
Jaylen Lewis
#14
Braxton Myers
#2
Tony Newsome Jr.
#39
Jaylen Pollard
#3
Christian White
Other
#43
Jackson Smith
Quarterbacks & Specialists
#19
Billy Gowers
#10
Josh Hoover
#2
Grant Wilson
Receivers & Backs
#80
Charlie Becker
#29
Lee Beebe Jr.
#22
Jayreon Campbell
#4
Davion Chandler
#20
Sean Cuono
#11
Nick Marsh
#8
Tyler Morris
#7
Shazz Preston
#1
Turbo Richard
Defensive Line & Linebackers
#8
Josh Burnham
#5
Rolijah Hardy
#90
Joe Hjelle
#46
Isaiah Jones
#97
Mario Landino
#98
Cam McHaney
#17
Daniel Ndukwe
#7
Chiddi Obiazor
#12
Tobi Osunsanmi
#91
Blake Smythe
#95
Tyrique Tucker
#14
Kaiden Turner
Defensive Backs
#2
Byron Baldwin Jr.
#3
Jaylen Bell
#1
Amare Ferrell
#10
Ryland Gandy
#16
Jamar Owens
#13
Quan Sanks
#22
Jamari Sharpe
#6
Preston Zachman
Other
#35
Paddy McAteer
Western Kentucky
3rd in CUSA
VS
Indiana
2nd in Big Ten
Passing
61.7
Completion Percentage
60.1
219
Completions
155
2.00
Interception Percentage
1.20
7
Interceptions
3
72
Longest Pass
79
2,229
Net Passing Yards
2,405
222.9
Net Passing Yards Per Game
240.5
355
Passing Attempts
258
3.70
Passing Touchdown %
9.30
13
Passing Touchdowns
24
122.7
Passer Rating
166.5
25
Total Sacks
15
159
Sack Yards Lost
88
6.3
Yards Per Pass Attempt
9.3
2,229
Passing Yards
2,405
0
Passing Fumbles Lost
0
10
Team Games Played
10
377.6
Yards Per Game
422.7
24.6
Total Points Per Game
31.9
246
Total Points
319
31
Total Touchdowns
39
222.9
Passing Yards Per Game
240.5
219-355
Comp-Att
155-258
25-159
Sacks-Yards Lost
15-88
Rushing
374
Rushing Attempts
350
1,547
Rushing Yards
1,822
4.1
Yards Per Rush Attempt
5.2
61
Long Rushing
70
0
20+ Yard Rushing Plays
0
17
Rushing Touchdowns
14
154.7
Rushing Yards Per Game
182.2
0
Rushing Fumbles
0
0
Rushing Fumbles Lost
0
81
Rushing 1st downs
80
10
Team Games Played
10
3,776
Total Yards
4,227
754
Total Offensive Plays
623
24.6
Total Points Per Game
31.9
246
Total Points
319
31
Total Touchdowns
39
Receiving
219
Receptions
155
0
Receiving Targets
0
2,229
Receiving Yards
2,405
2,229
Receiving Yards
2,405
13
Receiving Touchdowns
24
72
Long Reception
79
0
20+ Yard Receiving Plays
0
222.9
Receiving Yards Per Game
240.5
0
Receiving Fumbles
0
0
Receiving Fumbles Lost
0
1124
Receiving Yards After Catch
848
102
Receiving First Downs
102
10
Team Games Played
10
10.2
Yards Per Reception
15.5
24.6
Total Points Per Game
31.9
246
Total Points
319
31
Total Touchdowns
39
Miscellaneous
201
Total 1st downs
196
81
Rushing 1st downs
80
102
Passing 1st downs
102
18
1st downs by penalty
14
64
Third Down Conversions
50
163
Third Down Attempts
120
39.26
3rd down %
41.67
13
Fourth Down Conversions
6
24
First Downs Attempts
12
54.17
4th down %
50.00
45
Total Penalties
46
389
Total Penalty Yards
373
18228
Possession Time Seconds
17492
0.00
Red Zone Field Goal Percentage
0.00
0.00
Red Zone Scoring Percentage
0.00
0.00
Red Zone Efficiency Percentage
0.00
0.00
Red Zone Touchdown Percentage
0.00
14
Total Takeaways
9
15
Total Giveaways
7
-1
Turnover Ratio
2
0
Fumbles Lost
0
64-163
3rd down efficiency
50-120
13-24
4th down efficiency
6-12
45-389
Total-Yards
46-373
Defense
342
Solo Tackles
332
244
Assist Tackles
308
586
Total Tackles
640
14
Sacks
32
92
Sack Yards
221
63
Stuffs
97
26
Passes Defended
30
7.8
Average Interception Yards
15.6
22
Long Interception
34
0
Miscellaneous Touchdowns
0
0
Kicks Blocked
1
39
Tackles For Loss
64
10
Team Games Played
10
Defensive Interceptions
5
Interceptions
10
39
Interception Yards
156
0
Interception Touchdowns
1
5-39
INT: Total
10-156
General
15
Fumbles
13
9
Forced Fumbles
8
7
Fumbles Recovered
6
1
Fumbles Touchdowns
0
10
Games Played
10
15-0
Fumbles-Lost
13-0
Returning
18
Kick Returns
14
339
Kick Return Yards
270
18.8
Yards Per Kick Return
19.3
47
Long Kick Return
67
0
Kick Return Touchdowns
0
10
Punt Returns
7
73
Punt Return Yards
80
7.3
Yards Per Punt Return
11.4
34
Long Punt Return
36
0
Punt Return Touchdowns
0
0
Punt Return Fair Catches
0
0
Kick Return Fumbles Lost
0
0
Punt Return Fumbles Lost
0
10
Team Games Played
10
10-73
Punt: Total
7-80
Kicking
10
Field Goal Made
15
13
Field Goal Attempts
23
76.9
Field Goal Percentage
65.2
45
Long Field Goal Made
60
0
Field Goal Attempts 1-19
0
0
Field Goal Attempts 20-29
6
6
Field Goal Attempts 30-39
6
6
Field Goal Attempts 40-49
6
1
Field Goal Attempts 50+
5
28
Extra Points Made
36
29
Extra Point Attempts
38
96.6
Extra Point Percentage
94.7
0
Field Goals Made 1-19
0
0
Field Goals Made 20-29
5
6
Field Goals Made 30-39
4
4
Field Goals Made 40-49
5
0
Field Goals Made 50+
1
58
Total Kicking Points
81
10
Team Games Played
10
44
Touchback Percentage
84
0.0
Average Kickoff Return Yards
0.0
0
Kickoff Return Yards
0
0
Kickoff Returns
0
0-0
Kickoffs: Total
0-0
10-13
FG: Good-Attempts
15-23
Punting
50
Punts
35
2,168
Punt Yards
1,398
64
Long Punt
59
43.4
Gross Average Punt Yards
39.9
43.4
Net Average Punt Yards
39.9
0
Punts Blocked
0
10
Punts Inside 20
14
5
Touchbacks
1
13
Fair Catches
12
16
Punt Returns
10
0
Punt Return Yards
0
0.0
Average Punt Return Yards
0.0
10
Team Games Played
10
50-2,168
Punt: Total Yards
35-1,398
Scoring
17
Rushing Touchdowns
14
13
Receiving Touchdowns
24
0
Return Touchdowns
0
31
Total Touchdowns
38
10
Field Goals
15
28
Kick Extra Points
36
1
Total Two Point Conversions
1
246
Total Points
319
24.6
Total Points Per Game
31.9