

Western Michigan vs Rice Live Score (19 Sep, 2026)
Score by Quarter
| Team | Q1 | Q2 | Q3 | Q4 | Final |
|---|---|---|---|---|---|
 Western Michigan |
7 | 7 | 0 | 14 | 28 |
 Rice |
0 | 7 | 7 | 7 | 21 |
Scoring Plays
Q1
1:29
1:29
Broc Lowry 5 Yd Run (Dieter Kelly Kick)
Rushing Touchdown
7 – 0
Q2
5:04
5:04
Jacurri Brown 2 Yd Run (Enock Gota Kick)
Rushing Touchdown
7 – 7
Q2
1:48
1:48
Aveion Chenault 34 Yd pass from Broc Lowry (Dieter Kelly Kick)
Passing Touchdown
14 – 7
Q3
9:15
9:15
Tyvonn Byars 1 Yd Run (Enock Gota Kick)
Rushing Touchdown
14 – 14
Q4
14:19
14:19
Jalen Buckley 1 Yd Run (Dieter Kelly Kick)
Rushing Touchdown
21 – 14
Q4
1:54
1:54
Lolo Mataele 1 Yd Run (Dieter Kelly Kick)
Rushing Touchdown
28 – 14
Q4
0:09
0:09
Barry Jackson Jr. 22 Yd pass from Jacurri Brown (Enock Gota Kick)
Passing Touchdown
28 – 21
Game Leaders
Western MichiganRice
 B. Lowry QB
Passing Yards
 J. Brown QB
 J. Buckley RB
Rushing Yards
J. Brown QB A. Chenault WR
Receiving Yards
 B. Jackson Jr. WR
 A. Tounkara DT
Sacks
 A. Clemmons DL
 D. McCullough S
Tackles
 J. Benjamin CB
Player Box Score
Western Michigan| Player | C/ATT | YDS | AVG | TD | INT |
|---|---|---|---|---|---|
| Broc Lowry#12 | 14/20 | 116 | 5.8 | 1 | 0 |
 Team | 0/1 | 0 | 0.0 | 0 | 0 |
Rice| Player | C/ATT | YDS | AVG | TD | INT |
|---|---|---|---|---|---|
| Jacurri Brown#11 | 11/18 | 121 | 6.7 | 1 | 0 |
Western Michigan| Player | CAR | YDS | AVG | TD | LONG |
|---|---|---|---|---|---|
| Jalen Buckley#6 | 13 | 117 | 9.0 | 1 | 66 |
 Lolo Mataele#24 | 11 | 62 | 5.6 | 1 | 23 |
| Broc Lowry#12 | 17 | 39 | 2.3 | 1 | 9 |
| Team | 1 | -1 | -1.0 | 0 | 0 |
Rice| Player | CAR | YDS | AVG | TD | LONG |
|---|---|---|---|---|---|
| Jacurri Brown#11 | 23 | 128 | 5.6 | 1 | 29 |
 DAndre Hardeman Jr.#28 | 11 | 43 | 3.9 | 0 | 13 |
 Tyvonn Byars#26 | 8 | 18 | 2.3 | 1 | 5 |
 Max Mosey#13 | 1 | 16 | 16.0 | 0 | 16 |
 Jordan Clark#19 | 1 | 4 | 4.0 | 0 | 4 |
Western Michigan| Player | REC | YDS | AVG | TD | LONG |
|---|---|---|---|---|---|
| Aveion Chenault#2 | 3 | 62 | 20.7 | 1 | 34 |
 Baylin Brooks#7 | 5 | 31 | 6.2 | 0 | 13 |
 Adam Parks#15 | 2 | 11 | 5.5 | 0 | 10 |
 Emazon Littlejohn#1 | 1 | 8 | 8.0 | 0 | 8 |
 Egypt Nelson#8 | 1 | 5 | 5.0 | 0 | 5 |
| Lolo Mataele#24 | 2 | -1 | -0.5 | 0 | 2 |
Rice| Player | REC | YDS | AVG | TD | LONG |
|---|---|---|---|---|---|
| Barry Jackson Jr.#7 | 4 | 47 | 11.8 | 1 | 22 |
 Payton Matthews | 1 | 25 | 25.0 | 0 | 25 |
| Jordan Clark#19 | 3 | 21 | 7.0 | 0 | 17 |
 Ben Grice#6 | 1 | 12 | 12.0 | 0 | 12 |
 Braylen Walker#81 | 1 | 11 | 11.0 | 0 | 11 |
| Max Mosey#13 | 1 | 5 | 5.0 | 0 | 5 |
Western Michigan| Player | TOT | SOLO | SACKS | TFL | PD | QB HUR | TD |
|---|---|---|---|---|---|---|---|
| Daeh McCullough#14 | 7 | 1 | 0 | 0 | 0 | 0 | 0 |
 Zavian Tibbs#41 | 7 | 0 | 0 | 0 | 0 | 0 | 0 |
 Joey Pope#6 | 6 | 4 | 0 | 0 | 1 | 0 | 0 |
 Dillon Moore#12 | 6 | 3 | 0 | 0 | 0 | 0 | 0 |
 Brenden Anes | 5 | 1 | 0 | 0 | 0 | 0 | 0 |
| Justyce Betts#10 | 5 | 0 | 0 | 0.5 | 0 | 0 | 0 |
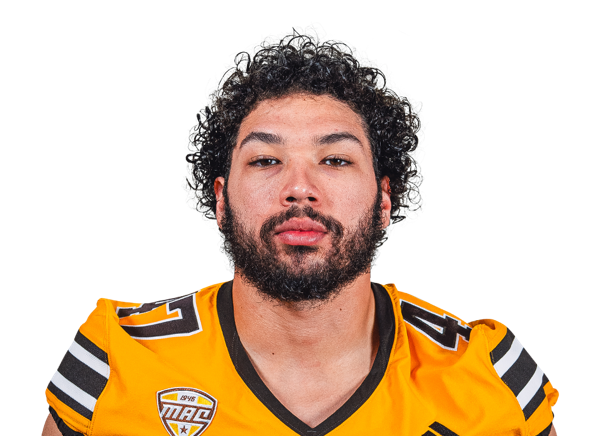 Domanick Moon#47 | 4 | 2 | 0 | 1 | 0 | 0 | 0 |
 Micah Davis#18 | 4 | 2 | 0 | 0 | 0 | 0 | 0 |
| Ahmed Tounkara#94 | 4 | 1 | 1 | 1 | 1 | 0 | 0 |
 Kouri Crump#26 | 4 | 1 | 0 | 0 | 0 | 0 | 0 |
 Will Gerig#9 | 4 | 0 | 0 | 0 | 0 | 0 | 0 |
 Amarian Louis#22 | 4 | 0 | 0 | 0 | 0 | 0 | 0 |
 Gabe Welch#42 | 3 | 1 | 0 | 0 | 0 | 0 | 0 |
 Jordon Thomas#13 | 2 | 1 | 0 | 0 | 0 | 0 | 0 |
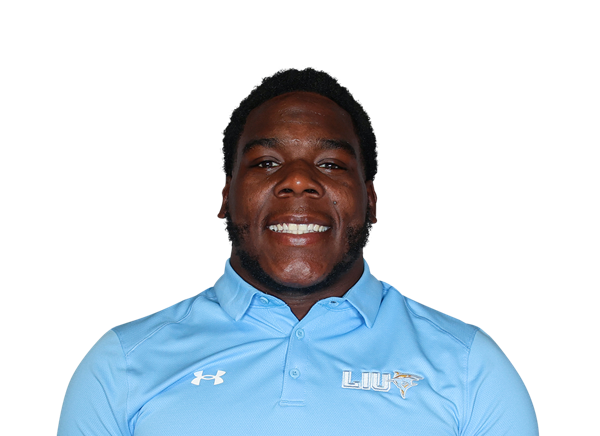 Scoop Gardner Jr.#2 | 2 | 1 | 0 | 0 | 0 | 1 | 0 |
 Jori Benson#90 | 2 | 0 | 0 | 0 | 0 | 0 | 0 |
 Dalton Gustwiller#96 | 2 | 0 | 0 | 0 | 0 | 0 | 0 |
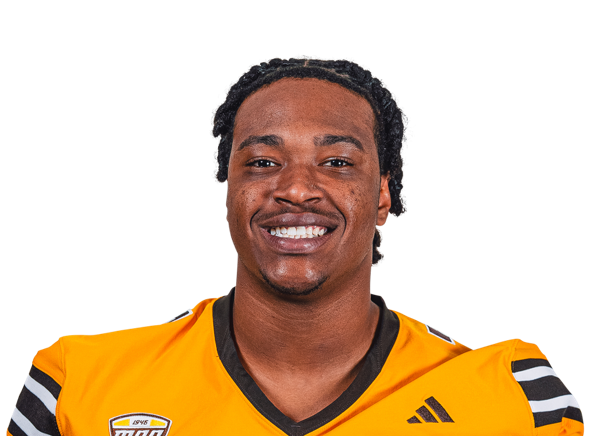 Gian Carter#7 | 2 | 0 | 0 | 0 | 0 | 0 | 0 |
 Austin Alexander#4 | 2 | 0 | 0 | 0 | 0 | 0 | 0 |
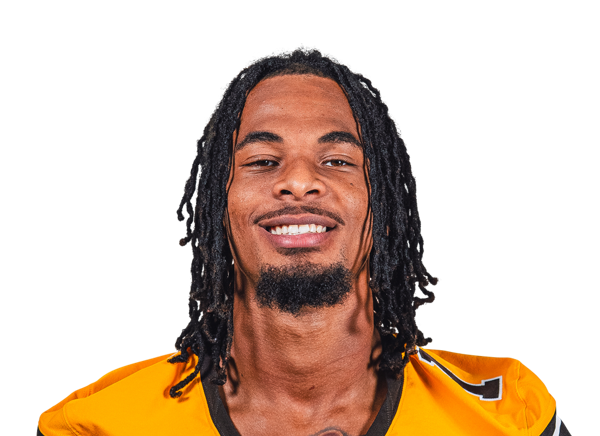 Joshua Franklin#1 | 1 | 1 | 0 | 1 | 0 | 0 | 0 |
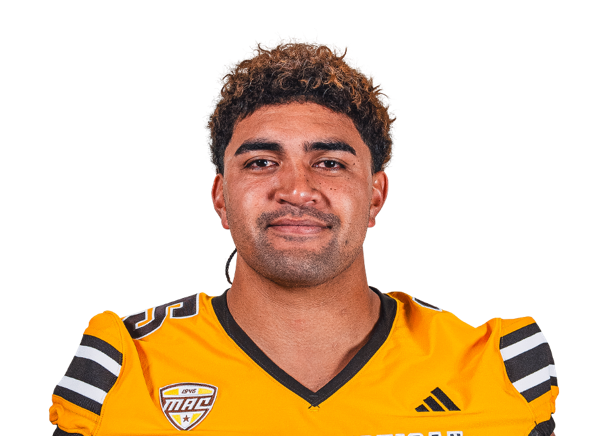 Enese Tonga#35 | 1 | 1 | 0 | 0 | 0 | 0 | 0 |
 Dakari Frazier#98 | 1 | 0 | 0 | 0.5 | 0 | 0 | 0 |
 Jarvarius Sims#8 | 1 | 0 | 0 | 0 | 0 | 0 | 0 |
 Ryan Brotherton#83 | 1 | 0 | 0 | 0 | 0 | 0 | 0 |
Rice| Player | TOT | SOLO | SACKS | TFL | PD | QB HUR | TD |
|---|---|---|---|---|---|---|---|
 Austin Harnetiaux#54 | 9 | 4 | 0 | 0 | 0 | 0 | 0 |
 AJ Brown#7 | 9 | 3 | 0 | 2 | 0 | 0 | 0 |
| Jamir Benjamin#12 | 9 | 1 | 0 | 0 | 0 | 0 | 0 |
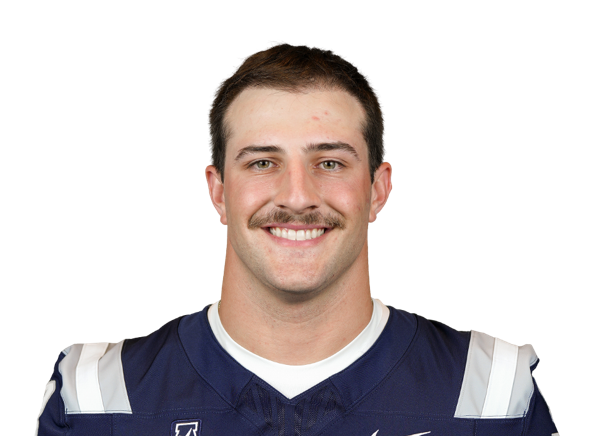 Stone Combs#33 | 7 | 2 | 0 | 0 | 0 | 0 | 0 |
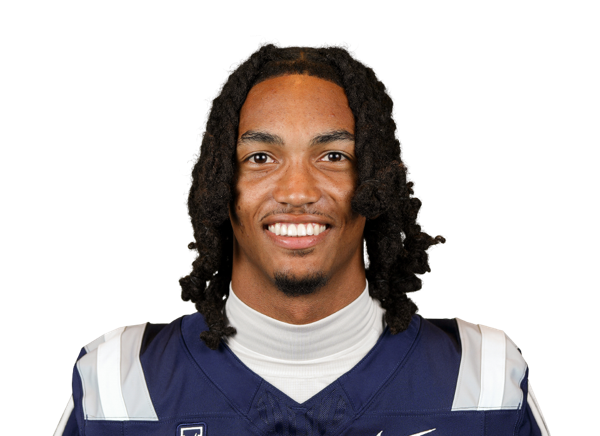 Kyren Condoll#10 | 6 | 3 | 0 | 0 | 0 | 0 | 0 |
| Aquantis Clemmons#57 | 6 | 1 | 1 | 1 | 0 | 0 | 0 |
 Koa Akui#3 | 5 | 3 | 0 | 0 | 0 | 0 | 0 |
 Cooper King#44 | 4 | 1 | 0 | 0 | 0 | 0 | 0 |
 Jo Chavez#2 | 4 | 1 | 0 | 0 | 0 | 0 | 0 |
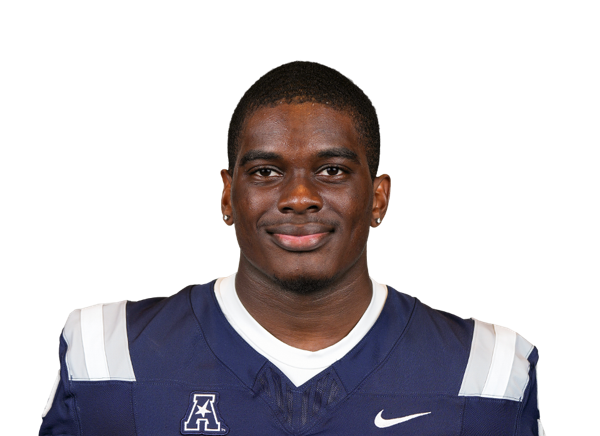 Seth Clarke#56 | 3 | 1 | 1 | 1 | 0 | 0 | 0 |
 Dillan Botts#96 | 3 | 1 | 0 | 0 | 0 | 1 | 0 |
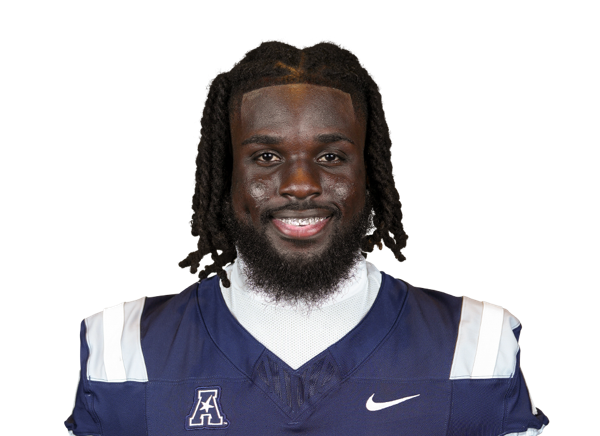 Chibby Nwajuaku#16 | 3 | 0 | 0 | 0 | 0 | 0 | 0 |
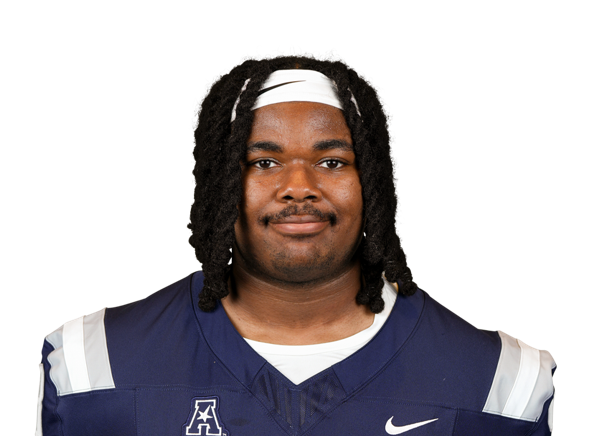 Robert Rooks#98 | 3 | 0 | 0 | 0.5 | 0 | 0 | 0 |
 Braden Bays#94 | 3 | 0 | 0 | 0 | 0 | 0 | 0 |
| Jordan Clark#19 | 2 | 0 | 0 | 0 | 0 | 0 | 0 |
 Caden VerMaas#25 | 1 | 1 | 0 | 0 | 0 | 0 | 0 |
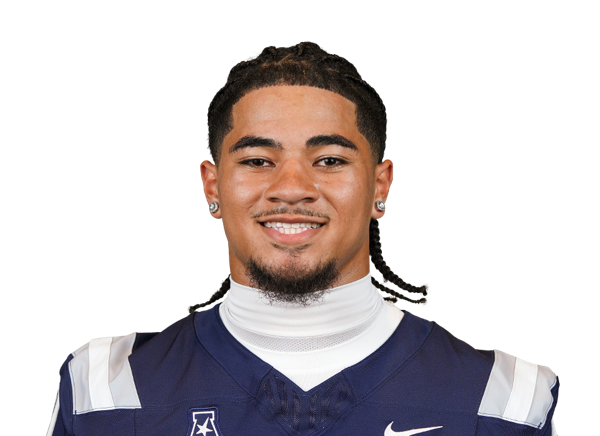 Jayden Cupitt#40 | 1 | 1 | 0 | 0 | 0 | 0 | 0 |
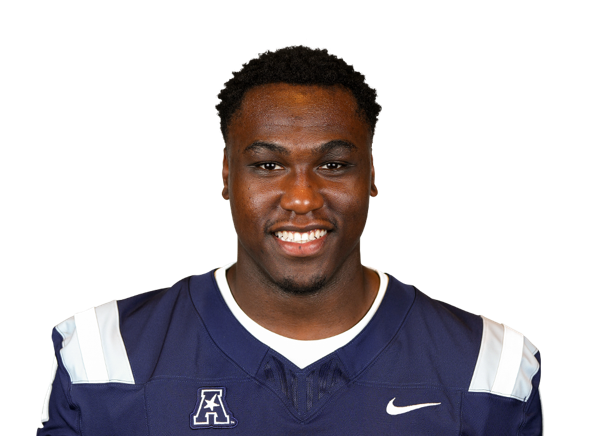 Tariq May#13 | 1 | 0 | 0 | 0.5 | 0 | 0 | 0 |
 Joseph Mutombo#8 | 1 | 0 | 0 | 0 | 0 | 0 | 0 |
 Chris Bruce#23 | 1 | 0 | 0 | 0 | 0 | 0 | 0 |
 Ahran Ogbor#18 | 1 | 0 | 0 | 0 | 1 | 0 | 0 |
 Dylan Stephens#6 | 1 | 0 | 0 | 0 | 0 | 0 | 0 |
Western Michigan| Player | FUM | LOST | REC |
|---|---|---|---|
| Joshua Franklin#1 | 1 | 1 | 0 |
| Broc Lowry#12 | 1 | 0 | 0 |
| Lolo Mataele#24 | 1 | 0 | 0 |
 Kordell Gouldsby#5 | 1 | 0 | 0 |
Rice| Player | FUM | LOST | REC |
|---|---|---|---|
| Chris Bruce#23 | 0 | 0 | 1 |
Western Michigan| Player | FG | PCT | LONG | XP | PTS |
|---|---|---|---|---|---|
 Dieter Kelly#32 | 0/0 | 0.0 | 0 | 4/4 | 4 |
Rice| Player | FG | PCT | LONG | XP | PTS |
|---|---|---|---|---|---|
 Enock Gota#28 | 0/1 | 0.0 | 0 | 3/3 | 3 |
Western Michigan| Player | NO | YDS | AVG | TB | In 20 | LONG |
|---|---|---|---|---|---|---|
 Ryan Millmore#25 | 4 | 175 | 43.8 | 0 | 2 | 54 |
Rice| Player | NO | YDS | AVG | TB | In 20 | LONG |
|---|---|---|---|---|---|---|
 Charlie Durkin#29 | 5 | 220 | 44.0 | 0 | 2 | 51 |
Western Michigan| Player | NO | YDS | AVG | LONG | TD |
|---|---|---|---|---|---|
| Joshua Franklin#1 | 1 | 28 | 28.0 | 28 | 0 |
Rice| Player | NO | YDS | AVG | LONG | TD |
|---|---|---|---|---|---|
| Max Mosey#13 | 2 | 20 | 10.0 | 21 | 0 |
Western Michigan| Player | NO | YDS | AVG | LONG | TD |
|---|---|---|---|---|---|
| Kordell Gouldsby#5 | 3 | 4 | 1.3 | 6 | 0 |
Drive Summary
WMU
Punt
9
RICE
Punt
20
WMU
Punt
28
RICE
Punt
22
WMU
Touchdown
80
RICE
Punt
20
WMU
Punt
22
RICE
Touchdown
81
WMU
Touchdown
65
RICE
Punt
21
WMU
End of Half
18
RICE
Touchdown
75
RICE
Missed FG
6
WMU
Touchdown
72
RICE
Punt
17
WMU
Punt
28
RICE
Downs
7
WMU
Touchdown
27
RICE
Touchdown
86
WMU
End of Game
-1
Injury Report
No current injury report is available for this matchup.
Head-to-Head
Historical meetings are not available for this matchup.
Game Information
StageWeek 3
Season2026
KickoffSat, Sep 19, 7:00 pm
VenueRice Stadium
LocationHouston, TX
SurfaceArtificial Turf
BroadcastESPN+
Attendance14,255
Division Standings
FBS — Mid-American Conference
| Team | W | L | T | Pct | PF | PA | Home | Away | Strk |
|---|---|---|---|---|---|---|---|---|---|
 Eastern Michigan | 4 | 7 | 0 | 0.364 | 226 | 300 | 2-3 | 2-4 | L4 |
 Massachusetts | 5 | 6 | 0 | 0.455 | 276 | 257 | 3-3 | 2-3 | L2 |
 Central Michigan | 5 | 6 | 0 | 0.455 | 227 | 261 | 4-2 | 1-4 | L1 |
 Toledo | 8 | 2 | 0 | 0.800 | 343 | 220 | 5-1 | 3-1 | W4 |
| Western Michigan | 8 | 3 | 0 | 0.727 | 312 | 214 | 4-1 | 4-2 | W3 |
 Akron | 2 | 9 | 0 | 0.182 | 220 | 365 | 1-4 | 1-5 | W1 |
 Ball State | 3 | 8 | 0 | 0.273 | 241 | 376 | 2-2 | 1-6 | L3 |
 Buffalo | 8 | 3 | 0 | 0.727 | 283 | 262 | 5-1 | 3-2 | W6 |
 Kent State | 3 | 8 | 0 | 0.273 | 160 | 328 | 3-2 | 0-6 | L3 |
 Miami (OH) | 7 | 4 | 0 | 0.636 | 301 | 260 | 4-2 | 3-2 | W2 |
 Ohio | 8 | 3 | 0 | 0.727 | 317 | 257 | 5-0 | 3-3 | W1 |
 Bowling Green | 3 | 7 | 0 | 0.300 | 193 | 289 | 2-3 | 1-4 | W1 |
 Sacramento State | 2 | 9 | 0 | 0.182 | 177 | 321 | 2-4 | 0-5 | L2 |
FBS — American Conference
| Team | W | L | T | Pct | PF | PA | Home | Away | Strk |
|---|---|---|---|---|---|---|---|---|---|
 South Florida | 6 | 4 | 0 | 0.600 | 274 | 188 | 4-2 | 2-2 | L2 |
 Florida Atlantic | 6 | 4 | 0 | 0.600 | 383 | 353 | 5-0 | 1-4 | L1 |
 Memphis | 8 | 2 | 0 | 0.800 | 390 | 253 | 5-0 | 3-2 | W3 |
 Tulsa | 6 | 4 | 0 | 0.600 | 336 | 226 | 3-2 | 3-2 | W2 |
 UTSA | 7 | 2 | 0 | 0.778 | 297 | 268 | 4-0 | 3-2 | L1 |
 UAB | 6 | 4 | 0 | 0.600 | 232 | 224 | 5-0 | 1-4 | W2 |
 East Carolina | 6 | 4 | 0 | 0.600 | 229 | 226 | 4-1 | 2-3 | W3 |
 North Texas | 7 | 2 | 0 | 0.778 | 402 | 278 | 5-0 | 2-2 | W6 |
| Rice | 2 | 9 | 0 | 0.182 | 239 | 353 | 1-4 | 1-5 | W1 |
 Temple | 2 | 9 | 0 | 0.182 | 261 | 322 | 1-6 | 1-3 | L6 |
 Tulane | 5 | 5 | 0 | 0.500 | 210 | 280 | 3-2 | 2-3 | W1 |
 Charlotte | 1 | 9 | 0 | 0.100 | 193 | 362 | 0-5 | 1-4 | L3 |
 Army | 5 | 4 | 0 | 0.556 | 290 | 228 | 3-2 | 2-2 | L2 |
 Navy | 3 | 6 | 0 | 0.333 | 263 | 274 | 3-2 | 0-4 | W1 |
Western Michigan
1st in MAC
VS
Rice
Quarterbacks & Specialists
#12
Broc Lowry
#25
Ryan Millmore
Receivers & Backs
#7
Baylin Brooks
#83
Ryan Brotherton
#6
Jalen Buckley
#2
Aveion Chenault
#5
Kordell Gouldsby
#1
Emazon Littlejohn
#24
Lolo Mataele
#8
Egypt Nelson
#15
Adam Parks
#35
Enese Tonga
Defensive Line & Linebackers
#4
Austin Alexander
Brenden Anes
#90
Jori Benson
#10
Justyce Betts
#7
Gian Carter
#98
Dakari Frazier
#2
Scoop Gardner Jr.
#9
Will Gerig
#96
Dalton Gustwiller
#47
Domanick Moon
#12
Dillon Moore
#41
Zavian Tibbs
#94
Ahmed Tounkara
#42
Gabe Welch
Defensive Backs
#26
Kouri Crump
#18
Micah Davis
#1
Joshua Franklin
#22
Amarian Louis
#14
Daeh McCullough
#6
Joey Pope
#8
Jarvarius Sims
#13
Jordon Thomas
Other
#32
Dieter Kelly
Quarterbacks & Specialists
#11
Jacurri Brown
#29
Charlie Durkin
Receivers & Backs
#23
Chris Bruce
#26
Tyvonn Byars
#19
Jordan Clark
#6
Ben Grice
#28
D'Andre Hardeman Jr.
#7
Barry Jackson Jr.
Payton Matthews
#13
Max Mosey
#81
Braylen Walker
Defensive Line & Linebackers
#94
Braden Bays
#96
Dillan Botts
#2
Jo Chavez
#56
Seth Clarke
#57
Aquantis Clemmons
#33
Stone Combs
#40
Jayden Cupitt
#54
Austin Harnetiaux
#44
Cooper King
#13
Tariq May
#8
Joseph Mutombo
#16
Chibby Nwajuaku
#98
Robert Rooks
#25
Caden VerMaas
Defensive Backs
#3
Koa Akui
#12
Jamir Benjamin
#7
AJ Brown
#10
Kyren Condoll
#18
Ahran Ogbor
#6
Dylan Stephens
Other
#28
Enock Gota
Western Michigan
1st in MAC
VS
Rice
14th in American
Passing
62.1
Completion Percentage
49.2
126
Completions
58
1.50
Interception Percentage
2.50
3
Interceptions
3
49
Longest Pass
71
1,456
Net Passing Yards
839
161.8
Net Passing Yards Per Game
93.2
203
Passing Attempts
118
5.90
Passing Touchdown %
4.20
12
Passing Touchdowns
5
139.1
Passer Rating
117.8
14
Total Sacks
17
88
Sack Yards Lost
144
7.2
Yards Per Pass Attempt
7.1
1,456
Passing Yards
839
0
Passing Fumbles Lost
0
9
Team Games Played
9
327.0
Yards Per Game
363.6
26.2
Total Points Per Game
21.2
236
Total Points
191
29
Total Touchdowns
25
161.8
Passing Yards Per Game
93.2
126-203
Comp-Att
58-118
14-88
Sacks-Yards Lost
17-144
Rushing
334
Rushing Attempts
443
1,487
Rushing Yards
2,433
4.5
Yards Per Rush Attempt
5.5
82
Long Rushing
88
0
20+ Yard Rushing Plays
0
16
Rushing Touchdowns
20
165.2
Rushing Yards Per Game
270.3
0
Rushing Fumbles
0
0
Rushing Fumbles Lost
0
76
Rushing 1st downs
112
9
Team Games Played
9
2,943
Total Yards
3,272
551
Total Offensive Plays
578
26.2
Total Points Per Game
21.2
236
Total Points
191
29
Total Touchdowns
25
Receiving
126
Receptions
58
0
Receiving Targets
0
1,456
Receiving Yards
839
1,456
Receiving Yards
839
12
Receiving Touchdowns
5
49
Long Reception
71
0
20+ Yard Receiving Plays
0
161.8
Receiving Yards Per Game
93.2
0
Receiving Fumbles
0
0
Receiving Fumbles Lost
0
670
Receiving Yards After Catch
330
66
Receiving First Downs
38
9
Team Games Played
9
11.6
Yards Per Reception
14.5
26.2
Total Points Per Game
21.2
236
Total Points
191
29
Total Touchdowns
25
Miscellaneous
163
Total 1st downs
158
76
Rushing 1st downs
112
66
Passing 1st downs
38
20
1st downs by penalty
8
46
Third Down Conversions
35
113
Third Down Attempts
110
40.71
3rd down %
31.82
8
Fourth Down Conversions
13
15
First Downs Attempts
23
53.33
4th down %
56.52
46
Total Penalties
49
392
Total Penalty Yards
444
16155
Possession Time Seconds
16331
0.00
Red Zone Field Goal Percentage
0.00
0.00
Red Zone Scoring Percentage
0.00
0.00
Red Zone Efficiency Percentage
0.00
0.00
Red Zone Touchdown Percentage
0.00
12
Total Takeaways
6
8
Total Giveaways
13
4
Turnover Ratio
-7
0
Fumbles Lost
0
46-113
3rd down efficiency
35-110
8-15
4th down efficiency
13-23
46-392
Total-Yards
49-444
Defense
305
Solo Tackles
288
366
Assist Tackles
324
671
Total Tackles
612
23
Sacks
14
144
Sack Yards
109
66
Stuffs
66
30
Passes Defended
29
4.9
Average Interception Yards
11.3
27
Long Interception
34
0
Miscellaneous Touchdowns
0
0
Kicks Blocked
0
36
Tackles For Loss
44
9
Team Games Played
9
Defensive Interceptions
7
Interceptions
3
34
Interception Yards
34
0
Interception Touchdowns
0
7-34
INT: Total
3-34
General
13
Fumbles
20
10
Forced Fumbles
9
9
Fumbles Recovered
3
0
Fumbles Touchdowns
0
9
Games Played
9
13-0
Fumbles-Lost
20-0
Returning
14
Kick Returns
12
316
Kick Return Yards
138
22.6
Yards Per Kick Return
11.5
92
Long Kick Return
25
1
Kick Return Touchdowns
0
9
Punt Returns
4
90
Punt Return Yards
40
10.0
Yards Per Punt Return
10.0
76
Long Punt Return
25
0
Punt Return Touchdowns
0
0
Punt Return Fair Catches
0
0
Kick Return Fumbles Lost
0
0
Punt Return Fumbles Lost
0
9
Team Games Played
9
9-90
Punt: Total
4-40
Kicking
11
Field Goal Made
6
12
Field Goal Attempts
13
91.7
Field Goal Percentage
46.2
52
Long Field Goal Made
45
0
Field Goal Attempts 1-19
0
1
Field Goal Attempts 20-29
2
5
Field Goal Attempts 30-39
3
4
Field Goal Attempts 40-49
5
2
Field Goal Attempts 50+
3
29
Extra Points Made
23
29
Extra Point Attempts
24
100.0
Extra Point Percentage
95.8
0
Field Goals Made 1-19
0
1
Field Goals Made 20-29
2
5
Field Goals Made 30-39
2
3
Field Goals Made 40-49
2
2
Field Goals Made 50+
0
62
Total Kicking Points
41
9
Team Games Played
9
30
Touchback Percentage
63
0.0
Average Kickoff Return Yards
0.0
0
Kickoff Return Yards
0
0
Kickoff Returns
0
0-0
Kickoffs: Total
0-0
11-12
FG: Good-Attempts
6-13
Punting
36
Punts
35
1,632
Punt Yards
1,515
69
Long Punt
58
45.3
Gross Average Punt Yards
43.3
45.3
Net Average Punt Yards
43.3
0
Punts Blocked
0
14
Punts Inside 20
7
2
Touchbacks
2
13
Fair Catches
5
7
Punt Returns
19
0
Punt Return Yards
0
0.0
Average Punt Return Yards
0.0
9
Team Games Played
9
36-1,632
Punt: Total Yards
35-1,515
Scoring
16
Rushing Touchdowns
20
12
Receiving Touchdowns
5
1
Return Touchdowns
0
29
Total Touchdowns
25
11
Field Goals
6
29
Kick Extra Points
23
0
Total Two Point Conversions
0
236
Total Points
191
26.2
Total Points Per Game
21.2