

Wisconsin vs Notre Dame Live Score (6 Sep, 2026)
Score by Quarter
| Team | Q1 | Q2 | Q3 | Q4 | Final |
|---|---|---|---|---|---|
 Wisconsin | 3 | 7 | 3 | 0 | 13 |
 Notre Dame | 10 | 3 | 14 | 14 | 41 |
Scoring Plays
Q1
6:32
6:32
Gavin Lahm 27 Yd Field Goal
Field Goal Good
3 – 0
Q1
1:31
1:31
Spencer Porath 52 Yd Field Goal
Field Goal Good
3 – 3
Q1
0:22
0:22
James Flanigan 3 Yd pass from CJ Carr (Spencer Porath Kick)
Passing Touchdown
3 – 10
Q2
12:36
12:36
Malachi Coleman 28 Yd pass from Colton Joseph (Gavin Lahm Kick)
Passing Touchdown
10 – 10
Q2
8:53
8:53
Spencer Porath 26 Yd Field Goal
Field Goal Good
10 – 13
Q3
10:23
10:23
Aneyas Williams 3 Yd Run (Spencer Porath Kick)
Rushing Touchdown
10 – 20
Q3
8:52
8:52
DJ McKinney 55 Yd Interception Return (Spencer Porath Kick)
Interception Return Touchdown
10 – 27
Q3
0:14
0:14
Gavin Lahm 36 Yd Field Goal
Field Goal Good
13 – 27
Q4
10:48
10:48
Aneyas Williams 5 Yd Run (Spencer Porath Kick)
Rushing Touchdown
13 – 34
Q4
1:51
1:51
Nolan James Jr. 28 Yd pass from CJ Carr (Spencer Porath Kick)
Passing Touchdown
13 – 41
Game Leaders
WisconsinNotre Dame
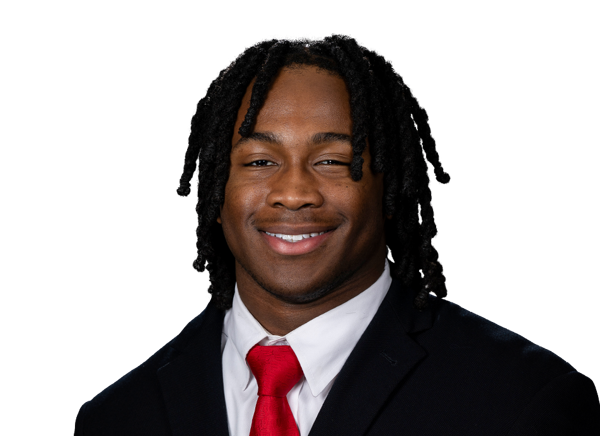
 C. Joseph QB
Passing Yards
 C. Carr QB
 A. Sama III RB
Rushing Yards
 A. Williams RB
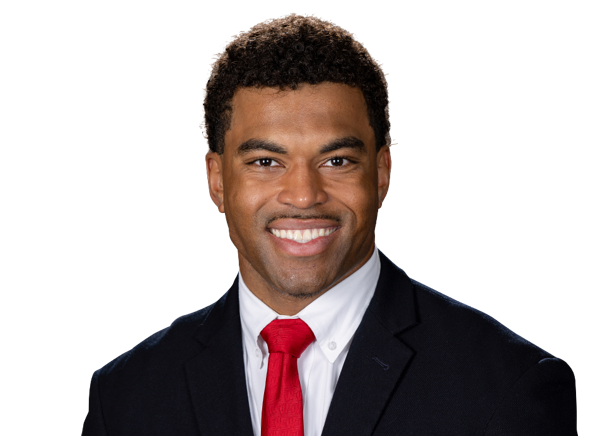
 M. Coleman WR
Receiving Yards
 J. Faison WR
 S. Cheeks LB
Sacks
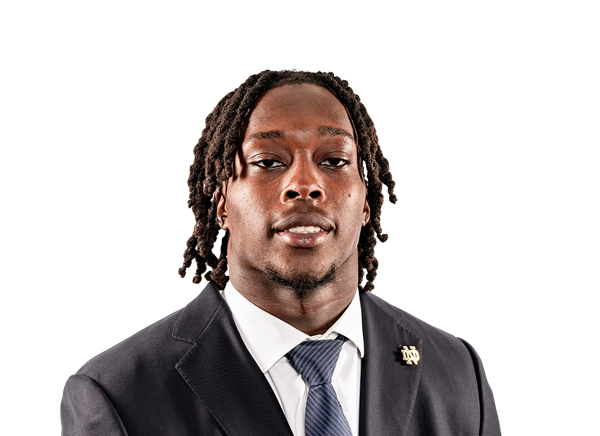 B. Traore DL
 M. Posa LB
Tackles
 D. Bowen LB
Player Box Score
Wisconsin| Player | C/ATT | YDS | AVG | TD | INT |
|---|---|---|---|---|---|
| Colton Joseph#1 | 19/30 | 217 | 7.2 | 1 | 1 |
Notre Dame| Player | C/ATT | YDS | AVG | TD | INT |
|---|---|---|---|---|---|
| CJ Carr#13 | 19/29 | 239 | 8.2 | 2 | 0 |
Wisconsin| Player | CAR | YDS | AVG | TD | LONG |
|---|---|---|---|---|---|
| Abu Sama III#3 | 15 | 49 | 3.3 | 0 | 7 |
 Darrion Dupree#6 | 4 | 15 | 3.8 | 0 | 8 |
| Colton Joseph#1 | 12 | 3 | 0.3 | 0 | 5 |
Notre Dame| Player | CAR | YDS | AVG | TD | LONG |
|---|---|---|---|---|---|
| Aneyas Williams#22 | 20 | 90 | 4.5 | 2 | 16 |
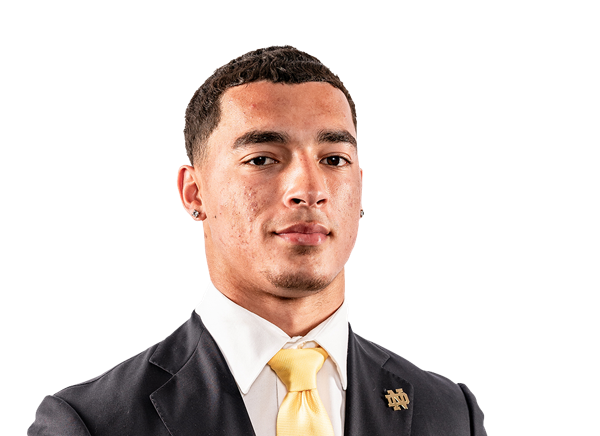 Nolan James Jr.#2 | 7 | 19 | 2.7 | 0 | 7 |
 Kedren Young#21 | 3 | 8 | 2.7 | 0 | 3 |
| CJ Carr#13 | 2 | -6 | -3.0 | 0 | 2 |
Wisconsin| Player | REC | YDS | AVG | TD | LONG |
|---|---|---|---|---|---|
| Malachi Coleman#4 | 4 | 76 | 19.0 | 1 | 28 |
 Tyrell Henry | 4 | 42 | 10.5 | 0 | 17 |
 Chris Brooks Jr.#2 | 3 | 38 | 12.7 | 0 | 17 |
 Eugene Hilton Jr.#13 | 3 | 31 | 10.3 | 0 | 20 |
 Grant Stec#85 | 3 | 20 | 6.7 | 0 | 8 |
| Darrion Dupree#6 | 1 | 7 | 7.0 | 0 | 7 |
 Jacob Harris#89 | 1 | 3 | 3.0 | 0 | 3 |
Notre Dame| Player | REC | YDS | AVG | TD | LONG |
|---|---|---|---|---|---|
| Jordan Faison#6 | 4 | 81 | 20.3 | 0 | 30 |
| Nolan James Jr.#2 | 4 | 67 | 16.8 | 1 | 28 |
 Micah Gilbert#14 | 3 | 34 | 11.3 | 0 | 18 |
 Cooper Flanagan#87 | 2 | 13 | 6.5 | 0 | 8 |
| Aneyas Williams#22 | 1 | 11 | 11.0 | 0 | 11 |
| Kedren Young#21 | 1 | 11 | 11.0 | 0 | 11 |
 James Flanigan#88 | 2 | 10 | 5.0 | 1 | 7 |
 Ty Washington#7 | 1 | 6 | 6.0 | 0 | 6 |
 Jaden Greathouse#1 | 1 | 6 | 6.0 | 0 | 6 |
Wisconsin| Player | TOT | SOLO | SACKS | TFL | PD | QB HUR | TD |
|---|---|---|---|---|---|---|---|
| Mason Posa#8 | 15 | 5 | 0 | 0 | 0 | 0 | 0 |
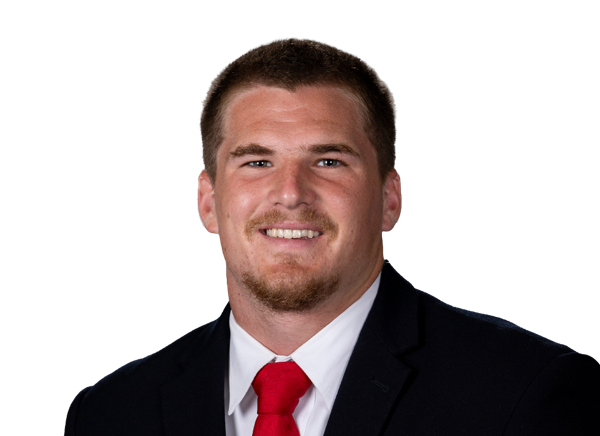 Matthew Jung#29 | 9 | 4 | 0 | 0 | 1 | 0 | 0 |
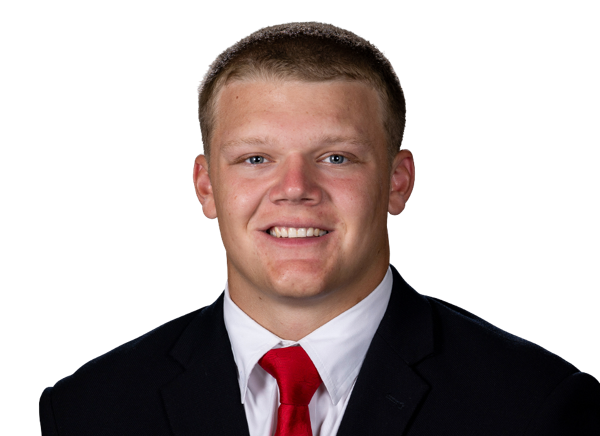 Cooper Catalano#44 | 9 | 1 | 0 | 0 | 0 | 1 | 0 |
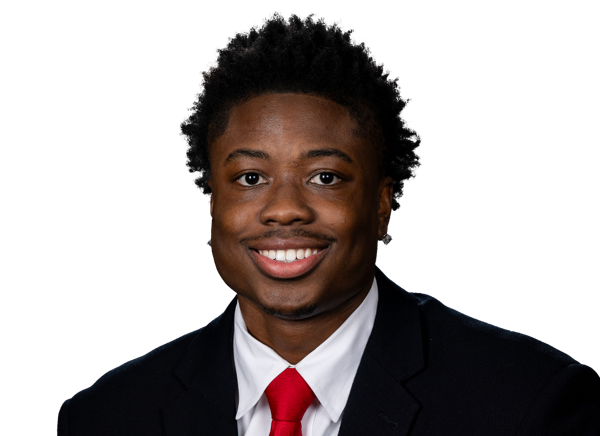 Javan Robinson#2 | 6 | 4 | 0 | 0 | 1 | 0 | 0 |
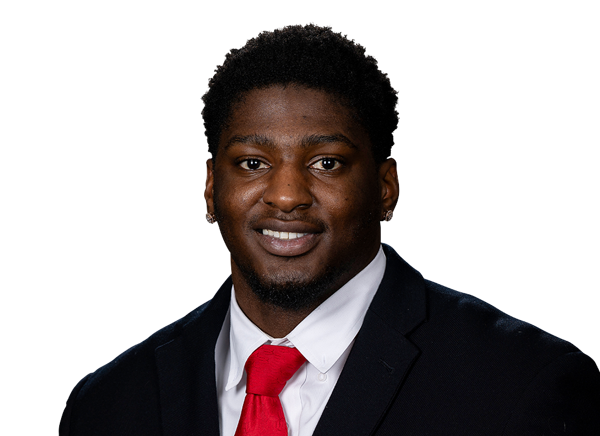 Justus Boone | 4 | 3 | 0 | 0 | 0 | 0 | 0 |
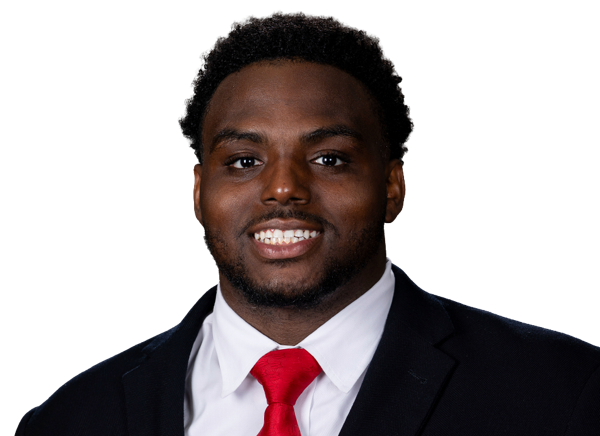 Micheal Garner#51 | 4 | 1 | 0 | 0 | 0 | 1 | 0 |
 Hammond Russell IV#91 | 3 | 1 | 0 | 0 | 0 | 0 | 0 |
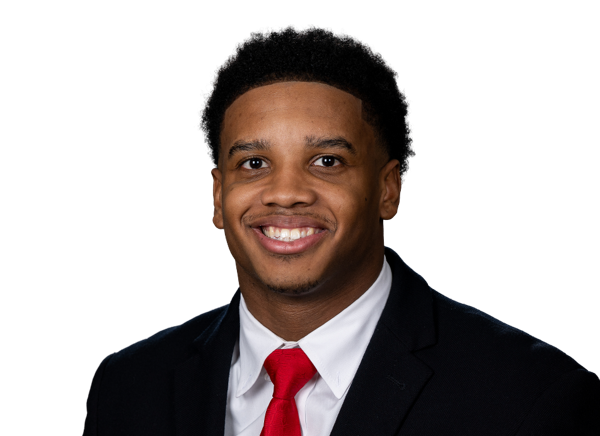 Bryce West#5 | 3 | 0 | 0 | 0 | 2 | 0 | 0 |
| Sebastian Cheeks#15 | 2 | 2 | 1 | 1 | 1 | 0 | 0 |
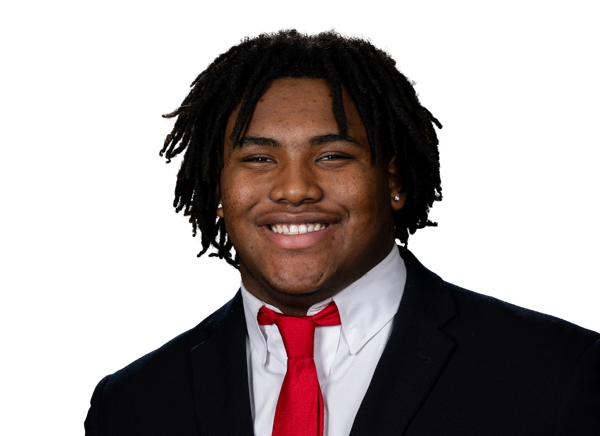 Jai'mier Scott#6 | 2 | 2 | 0 | 0 | 0 | 0 | 0 |
 Charles Perkins#30 | 2 | 1 | 0 | 0 | 0 | 0 | 0 |
 Carson Van Dinter#11 | 2 | 1 | 0 | 0 | 0 | 0 | 0 |
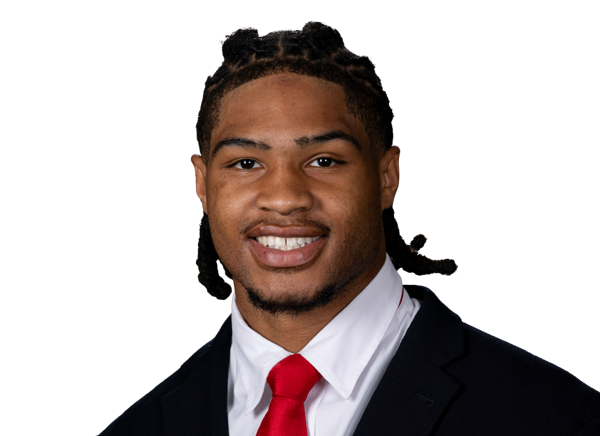 Marvin Burks Jr.#4 | 1 | 1 | 0 | 0 | 0 | 0 | 0 |
 Nicolas Clayton#12 | 1 | 1 | 0 | 0 | 0 | 0 | 0 |
 Tyreese Fearbry#7 | 1 | 0 | 0 | 0 | 0 | 0 | 0 |
 Junior Poyser#97 | 1 | 0 | 0 | 0 | 0 | 0 | 0 |
 Mason Lane#38 | 1 | 0 | 0 | 0 | 0 | 0 | 0 |
 Cairo Skanes#21 | 1 | 0 | 0 | 0 | 0 | 0 | 0 |
Notre Dame| Player | TOT | SOLO | SACKS | TFL | PD | QB HUR | TD |
|---|---|---|---|---|---|---|---|
| Drayk Bowen#34 | 9 | 4 | 0 | 1 | 0 | 0 | 0 |
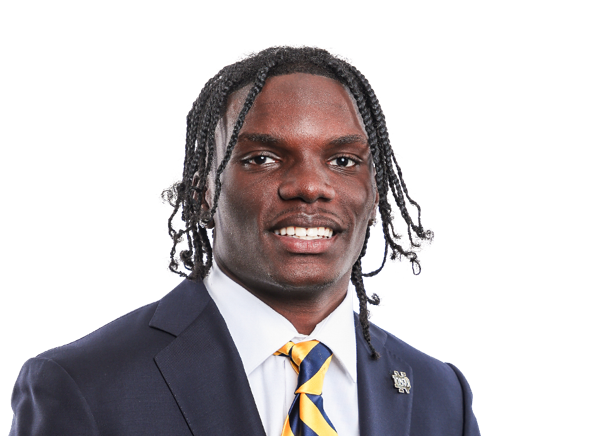 Adon Shuler#8 | 7 | 4 | 0 | 0 | 0 | 0 | 0 |
 Jaiden Ausberry#4 | 7 | 3 | 0 | 0 | 0 | 0 | 0 |
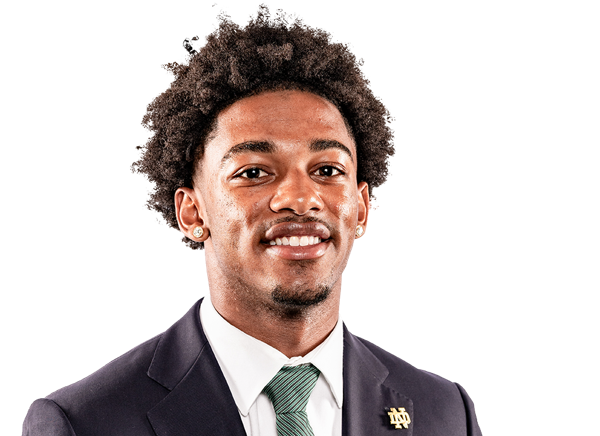 Leonard Moore#15 | 5 | 5 | 0 | 0 | 1 | 0 | 0 |
 Tionne Gray | 5 | 1 | 0 | 0.5 | 0 | 0 | 0 |
 Luke Talich#28 | 4 | 4 | 0 | 0 | 0 | 0 | 0 |
 Bryce Young#95 | 4 | 3 | 0 | 1 | 0 | 0 | 0 |
| Boubacar Traore#5 | 3 | 3 | 1 | 2 | 0 | 1 | 0 |
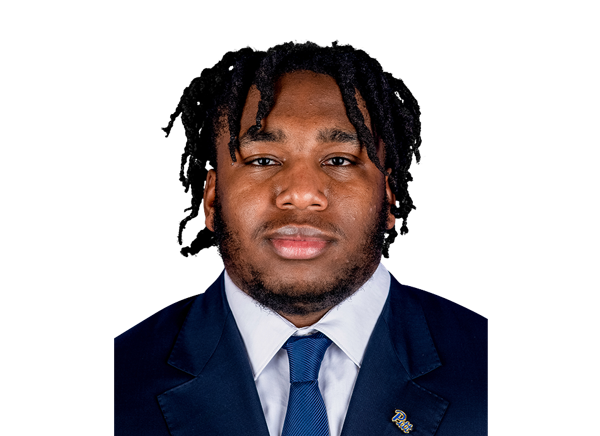 Francis Brewu#7 | 3 | 1 | 1 | 1 | 0 | 0 | 0 |
 Christian Gray#29 | 2 | 2 | 0 | 0 | 0 | 0 | 0 |
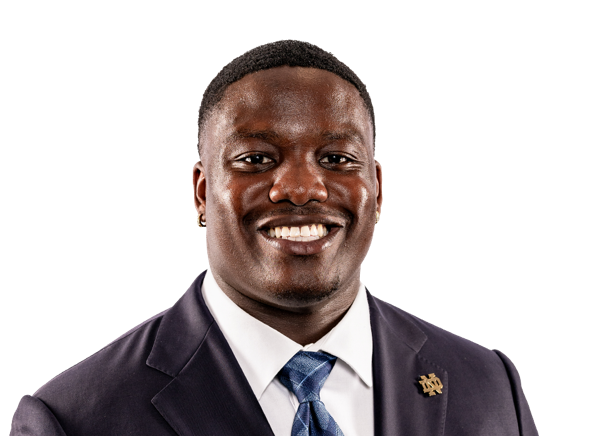 Armel Mukam#88 | 1 | 1 | 0 | 0 | 0 | 0 | 0 |
 Loghan Thomas#10 | 1 | 1 | 0 | 0 | 0 | 0 | 0 |
 Brandon Logan#25 | 1 | 1 | 0 | 0 | 0 | 0 | 0 |
 Jayden Sanders#12 | 1 | 1 | 0 | 0 | 2 | 0 | 0 |
 Brauntae Johnson#9 | 1 | 1 | 0 | 0 | 1 | 0 | 0 |
 Joseph Vinci#96 | 1 | 1 | 0 | 0 | 0 | 0 | 0 |
 Jason Onye#47 | 1 | 0 | 0 | 0 | 0 | 0 | 0 |
 Jaylen Sneed#3 | 1 | 0 | 0 | 0 | 0 | 0 | 0 |
 Rodney Dunham#44 | 1 | 0 | 0 | 0.5 | 0 | 0 | 0 |
| Ja'Kobe Clapper#23 | 1 | 0 | 0 | 0 | 0 | 0 | 0 |
 Matt Jeffery#33 | 1 | 0 | 0 | 0 | 0 | 0 | 0 |
 DJ McKinney#2 | 0 | 0 | 0 | 0 | 1 | 0 | 1 |
Wisconsin| Player | FUM | LOST | REC |
|---|---|---|---|
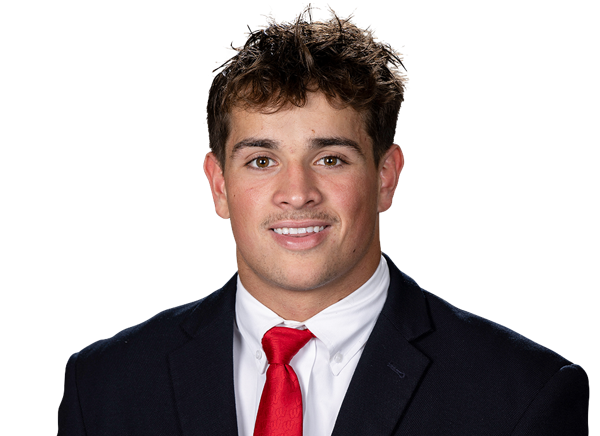 Harrison Bortolotti#32 | 1 | 1 | 0 |
Notre Dame| Player | FUM | LOST | REC |
|---|---|---|---|
| CJ Carr#13 | 1 | 0 | 0 |
 Kahanu Kia#43 | 0 | 0 | 1 |
Wisconsin| Player | FG | PCT | LONG | XP | PTS |
|---|---|---|---|---|---|
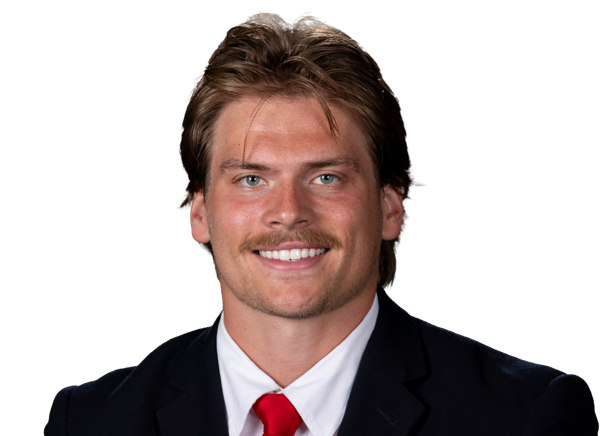 Gavin Lahm#97 | 2/2 | 100.0 | 36 | 1/1 | 7 |
Notre Dame| Player | FG | PCT | LONG | XP | PTS |
|---|---|---|---|---|---|
 Spencer Porath#35 | 2/2 | 100.0 | 52 | 5/5 | 11 |
Wisconsin| Player | NO | YDS | AVG | TB | In 20 | LONG |
|---|---|---|---|---|---|---|
 Sean West#91 | 5 | 225 | 45.0 | 1 | 2 | 70 |
Notre Dame| Player | NO | YDS | AVG | TB | In 20 | LONG |
|---|---|---|---|---|---|---|
| Jasper Scaife#39 | 2 | 87 | 43.5 | 0 | 0 | 46 |
| Team | 1 | 21 | 21.0 | 0 | 0 | 21 |
Wisconsin| Player | NO | YDS | AVG | LONG | TD |
|---|---|---|---|---|---|
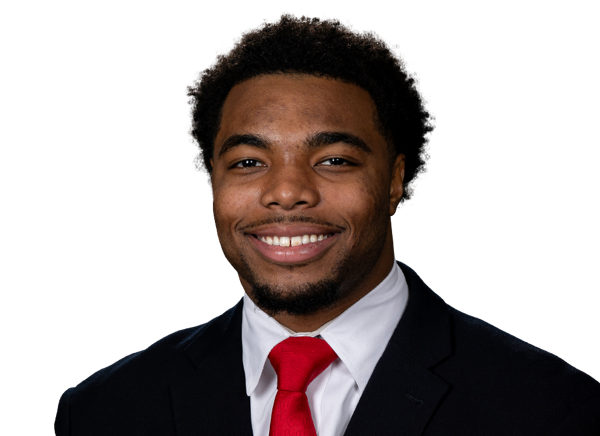 Nate Palmer#15 | 2 | 43 | 21.5 | 22 | 0 |
| Harrison Bortolotti#32 | 1 | 8 | 8.0 | 8 | 0 |
Notre Dame| Player | NO | YDS | AVG | LONG | TD |
|---|---|---|---|---|---|
| Aneyas Williams#22 | 2 | 42 | 21.0 | 29 | 0 |
Wisconsin| Player | NO | YDS | AVG | LONG | TD |
|---|---|---|---|---|---|
| Tyrell Henry | 1 | 3 | 3.0 | 3 | 0 |
Notre Dame| Player | NO | YDS | AVG | LONG | TD |
|---|---|---|---|---|---|
| Jordan Faison#6 | 1 | 12 | 12.0 | 12 | 0 |
Notre Dame| Player | INT | YDS | TD |
|---|---|---|---|
| DJ McKinney#2 | 1 | 55 | 1 |
Drive Summary
WIS
Punt
9
ND
Punt
-5
WIS
Field Goal
28
ND
Field Goal
48
ND
Touchdown
13
WIS
Punt
4
ND
Punt
4
WIS
Touchdown
48
ND
Field Goal
67
WIS
Punt
39
ND
Punt
1
WIS
Punt
25
ND
End Of Half
2
ND
Touchdown
70
WIS
Interception Touchdown
20
WIS
Field Goal
47
ND
Touchdown
75
WIS
Punt
27
ND
Touchdown
88
WIS
End of Half
47
Injury Report
No current injury report is available for this matchup.
Head-to-Head
Historical meetings are not available for this matchup.
Game Information
StageWeek 1
Season2026
KickoffSun, Sep 6, 7:30 pm
VenueLambeau Field
LocationGreen Bay, WI
SurfaceGrass
SiteNeutral Site
BroadcastNBC
Attendance75,939
Division Standings
FBS — Big Ten Conference
| Team | W | L | T | Pct | PF | PA | Home | Away | Strk |
|---|---|---|---|---|---|---|---|---|---|
 USC | 7 | 2 | 0 | 0.778 | 292 | 218 | 5-1 | 2-1 | W1 |
 Illinois | 5 | 3 | 0 | 0.625 | 232 | 194 | 3-2 | 2-1 | W3 |
 Indiana | 8 | 1 | 0 | 0.889 | 292 | 112 | 5-1 | 3-0 | W2 |
 Iowa | 6 | 2 | 0 | 0.750 | 226 | 100 | 4-1 | 2-1 | W1 |
 Maryland | 2 | 6 | 0 | 0.250 | 215 | 253 | 1-4 | 1-2 | L6 |
 Michigan | 5 | 3 | 0 | 0.625 | 170 | 131 | 4-2 | 1-1 | W1 |
 Michigan State | 2 | 6 | 0 | 0.250 | 159 | 206 | 2-3 | 0-3 | L6 |
 Minnesota | 5 | 3 | 0 | 0.625 | 202 | 164 | 4-1 | 1-2 | L1 |
 Nebraska | 5 | 3 | 0 | 0.625 | 259 | 125 | 4-2 | 1-1 | L3 |
 Northwestern | 6 | 2 | 0 | 0.750 | 269 | 150 | 5-0 | 1-2 | L1 |
 Ohio State | 6 | 2 | 0 | 0.750 | 293 | 124 | 4-0 | 2-2 | L1 |
 Oregon | 5 | 3 | 0 | 0.625 | 266 | 171 | 4-1 | 1-2 | W1 |
 Penn State | 4 | 4 | 0 | 0.500 | 232 | 149 | 3-2 | 1-2 | W1 |
 Purdue | 3 | 5 | 0 | 0.375 | 236 | 257 | 2-3 | 1-2 | L2 |
 UCLA | 8 | 0 | 0 | 1.000 | 268 | 107 | 5-0 | 3-0 | W8 |
 Washington | 5 | 3 | 0 | 0.625 | 212 | 169 | 3-2 | 2-1 | W2 |
 Rutgers | 2 | 6 | 0 | 0.250 | 222 | 261 | 1-4 | 1-2 | L2 |
| Wisconsin | 5 | 3 | 0 | 0.625 | 189 | 137 | 4-0 | 1-3 | L1 |
FBS — FBS Independents
| Team | W | L | T | Pct | PF | PA | Home | Away | Strk |
|---|---|---|---|---|---|---|---|---|---|
| Notre Dame | 7 | 1 | 0 | 0.875 | 323 | 107 | 4-0 | 3-1 | W1 |
 UConn | 4 | 4 | 0 | 0.500 | 275 | 202 | 2-2 | 2-2 | L1 |
Wisconsin
10th in Big Ten
VS
Notre Dame
1st in FBS Indep.
Quarterbacks & Specialists
#1
Colton Joseph
#91
Sean West
Receivers & Backs
#32
Harrison Bortolotti
#2
Chris Brooks Jr.
#4
Malachi Coleman
#6
Darrion Dupree
#89
Jacob Harris
Tyrell Henry
#13
Eugene Hilton Jr.
#38
Mason Lane
#15
Nate Palmer
#3
Abu Sama III
#85
Grant Stec
Defensive Line & Linebackers
Justus Boone
#44
Cooper Catalano
#15
Sebastian Cheeks
#12
Nicolas Clayton
#7
Tyreese Fearbry
#51
Micheal Garner
#30
Charles Perkins
#8
Mason Posa
#97
Junior Poyser
#91
Hammond Russell IV
Defensive Backs
#4
Marvin Burks Jr.
#29
Matthew Jung
#2
Javan Robinson
#6
Jai'mier Scott
#21
Cairo Skanes
#11
Carson Van Dinter
#5
Bryce West
Other
#97
Gavin Lahm
Quarterbacks & Specialists
#13
CJ Carr
#39
Jasper Scaife
#96
Joseph Vinci
Receivers & Backs
#6
Jordan Faison
#87
Cooper Flanagan
#88
James Flanigan
#14
Micah Gilbert
#1
Jaden Greathouse
#2
Nolan James Jr.
#33
Matt Jeffery
#7
Ty Washington
#22
Aneyas Williams
#21
Kedren Young
Defensive Line & Linebackers
#4
Jaiden Ausberry
#34
Drayk Bowen
#7
Francis Brewu
#23
Ja'Kobe Clapper
#44
Rodney Dunham
Tionne Gray
#43
Kahanu Kia
#88
Armel Mukam
#47
Jason Onye
#3
Jaylen Sneed
#10
Loghan Thomas
#5
Boubacar Traore
#95
Bryce Young
Defensive Backs
#29
Christian Gray
#9
Brauntae Johnson
#25
Brandon Logan
#2
DJ McKinney
#15
Leonard Moore
#12
Jayden Sanders
#8
Adon Shuler
#28
Luke Talich
Other
#35
Spencer Porath
Wisconsin
5th in Big Ten
VS
Notre Dame
Passing
56.0
Completion Percentage
66.8
112
Completions
165
3.00
Interception Percentage
0.40
6
Interceptions
1
75
Longest Pass
70
1,439
Net Passing Yards
2,054
179.9
Net Passing Yards Per Game
256.8
200
Passing Attempts
247
5.50
Passing Touchdown %
7.70
11
Passing Touchdowns
19
128.6
Passer Rating
161.1
10
Total Sacks
2
47
Sack Yards Lost
9
7.2
Yards Per Pass Attempt
8.3
1,439
Passing Yards
2,054
0
Passing Fumbles Lost
0
8
Team Games Played
8
318.3
Yards Per Game
442.8
23.6
Total Points Per Game
40.4
189
Total Points
323
23
Total Touchdowns
42
179.9
Passing Yards Per Game
256.8
112-200
Comp-Att
165-247
10-47
Sacks-Yards Lost
2-9
Rushing
262
Rushing Attempts
290
1,107
Rushing Yards
1,488
4.2
Yards Per Rush Attempt
5.1
72
Long Rushing
97
0
20+ Yard Rushing Plays
0
9
Rushing Touchdowns
20
138.4
Rushing Yards Per Game
186.0
0
Rushing Fumbles
0
0
Rushing Fumbles Lost
0
61
Rushing 1st downs
74
8
Team Games Played
8
2,546
Total Yards
3,542
472
Total Offensive Plays
539
23.6
Total Points Per Game
40.4
189
Total Points
323
23
Total Touchdowns
42
Receiving
112
Receptions
165
0
Receiving Targets
0
1,439
Receiving Yards
2,054
1,439
Receiving Yards
2,054
11
Receiving Touchdowns
19
75
Long Reception
70
0
20+ Yard Receiving Plays
0
179.9
Receiving Yards Per Game
256.8
0
Receiving Fumbles
0
0
Receiving Fumbles Lost
0
705
Receiving Yards After Catch
837
58
Receiving First Downs
99
8
Team Games Played
8
12.8
Yards Per Reception
12.4
23.6
Total Points Per Game
40.4
189
Total Points
323
23
Total Touchdowns
42
Miscellaneous
128
Total 1st downs
182
61
Rushing 1st downs
74
58
Passing 1st downs
99
9
1st downs by penalty
9
43
Third Down Conversions
40
103
Third Down Attempts
92
41.75
3rd down %
43.48
8
Fourth Down Conversions
14
14
First Downs Attempts
19
57.14
4th down %
73.68
53
Total Penalties
24
464
Total Penalty Yards
231
13304
Possession Time Seconds
15344
0.00
Red Zone Field Goal Percentage
0.00
0.00
Red Zone Scoring Percentage
0.00
0.00
Red Zone Efficiency Percentage
0.00
0.00
Red Zone Touchdown Percentage
0.00
9
Total Takeaways
10
9
Total Giveaways
2
0
Turnover Ratio
8
0
Fumbles Lost
0
43-103
3rd down efficiency
40-92
8-14
4th down efficiency
14-19
53-464
Total-Yards
24-231
Defense
321
Solo Tackles
257
202
Assist Tackles
170
523
Total Tackles
427
14
Sacks
15
134
Sack Yards
108
54
Stuffs
62
42
Passes Defended
26
10.7
Average Interception Yards
12.0
27
Long Interception
55
0
Miscellaneous Touchdowns
0
5
Kicks Blocked
2
35
Tackles For Loss
32
8
Team Games Played
8
Defensive Interceptions
7
Interceptions
8
75
Interception Yards
96
0
Interception Touchdowns
1
7-75
INT: Total
8-96
General
11
Fumbles
4
6
Forced Fumbles
7
3
Fumbles Recovered
9
1
Fumbles Touchdowns
2
8
Games Played
8
11-0
Fumbles-Lost
4-0
Returning
11
Kick Returns
7
257
Kick Return Yards
141
23.4
Yards Per Kick Return
20.1
42
Long Kick Return
29
0
Kick Return Touchdowns
0
5
Punt Returns
14
47
Punt Return Yards
138
9.4
Yards Per Punt Return
9.9
30
Long Punt Return
37
1
Punt Return Touchdowns
0
0
Punt Return Fair Catches
0
0
Kick Return Fumbles Lost
0
0
Punt Return Fumbles Lost
0
8
Team Games Played
8
5-47
Punt: Total
14-138
Kicking
10
Field Goal Made
10
12
Field Goal Attempts
11
83.3
Field Goal Percentage
90.9
51
Long Field Goal Made
52
0
Field Goal Attempts 1-19
0
1
Field Goal Attempts 20-29
2
6
Field Goal Attempts 30-39
7
3
Field Goal Attempts 40-49
1
2
Field Goal Attempts 50+
1
21
Extra Points Made
39
22
Extra Point Attempts
40
95.5
Extra Point Percentage
97.5
0
Field Goals Made 1-19
0
1
Field Goals Made 20-29
2
6
Field Goals Made 30-39
6
2
Field Goals Made 40-49
1
1
Field Goals Made 50+
1
51
Total Kicking Points
69
8
Team Games Played
8
45
Touchback Percentage
52
0.0
Average Kickoff Return Yards
0.0
0
Kickoff Return Yards
0
0
Kickoff Returns
0
0-0
Kickoffs: Total
0-0
10-12
FG: Good-Attempts
10-11
Punting
31
Punts
16
1,356
Punt Yards
702
70
Long Punt
60
43.7
Gross Average Punt Yards
43.9
43.7
Net Average Punt Yards
43.9
0
Punts Blocked
0
15
Punts Inside 20
5
2
Touchbacks
0
6
Fair Catches
5
10
Punt Returns
6
0
Punt Return Yards
0
0.0
Average Punt Return Yards
0.0
8
Team Games Played
8
31-1,356
Punt: Total Yards
16-702
Scoring
9
Rushing Touchdowns
20
11
Receiving Touchdowns
19
1
Return Touchdowns
0
22
Total Touchdowns
41
10
Field Goals
10
21
Kick Extra Points
39
0
Total Two Point Conversions
1
189
Total Points
323
23.6
Total Points Per Game
40.4