

Youngstown State vs Kentucky Live Score (5 Sep, 2026)
Score by Quarter
| Team | Q1 | Q2 | Q3 | Q4 | Final |
|---|---|---|---|---|---|
 Youngstown State | 0 | 7 | 6 | 0 | 13 |
 Kentucky | 14 | 14 | 7 | 10 | 45 |
Scoring Plays
Q1
11:29
11:29
CJ Baxter run for 15 yds, for a TD (A. Zouagui KICK)
Rushing Touchdown
0 – 7
Q1
6:25
6:25
CJ Baxter run for 5 yds, for a TD (A. Zouagui KICK)
Rushing Touchdown
0 – 14
Q2
11:30
11:30
K. Minchey pass to M. Skinner for 10 yds, for a TD (A. Zouagui KICK)
Passing Touchdown
0 – 21
Q2
1:51
1:51
K. Minchey pass to W. Rodriguez for 2 yds, for a TD (A. Zouagui KICK)
Passing Touchdown
0 – 28
Q2
0:20
0:20
B. Brungard pass to L. Wyche-El for 6 yds, for a TD (A. Lastovka KICK)
Passing Touchdown
7 – 28
Q3
8:19
8:19
K. Minchey pass to P. Jean for 26 yds, for a TD (A. Zouagui KICK)
Passing Touchdown
7 – 35
Q3
3:41
3:41
J. Gilbert run for 9 yds, for a TD (A. Lastovka PAT MISSED)
Rushing Touchdown
13 – 35
Q4
12:48
12:48
K. Minchey pass to K. Darby for 37 yds, for a TD (A. Zouagui KICK)
Passing Touchdown
13 – 42
Q4
5:29
5:29
A. Zouagui 28 yd FG GOOD
Field Goal Good
13 – 45
Game Leaders
Youngstown StateKentucky
 B. Brungard QB
Passing Yards
 K. Minchey QBB. Brungard QB
Rushing Yards
 J. Patterson RB
 L. Wyche-El WR
Receiving Yards
 K. Darby WR
 D. Inglis LB
Tackles
 J. Castell DB
—
Sacks
 A. Breaux DT
Player Box Score
Youngstown State| Player | C/ATT | YDS | AVG | TD | INT |
|---|---|---|---|---|---|
| Beau Brungard | 23/35 | 243 | 6.9 | 1 | 0 |
 Malachi Lewis | 1/3 | 3 | 1.0 | 0 | 0 |
Kentucky| Player | C/ATT | YDS | AVG | TD | INT |
|---|---|---|---|---|---|
| Kenny Minchey | 18/27 | 301 | 11.1 | 4 | 0 |
Youngstown State| Player | CAR | YDS | AVG | TD | LONG |
|---|---|---|---|---|---|
| Beau Brungard | 12 | 29 | 2.4 | 0 | 7 |
 Jaden Gilbert | 5 | 20 | 4.0 | 1 | 9 |
| Lynn Wyche-El | 2 | 16 | 8.0 | 0 | 11 |
 Antuan Gardner | 3 | 5 | 1.7 | 0 | 4 |
 Fresh Walters | 1 | 3 | 3.0 | 0 | 3 |
 Tahir Mills | 3 | -4 | -1.3 | 0 | 2 |
| Malachi Lewis | 1 | -4 | -4.0 | 0 | 0 |
 Dorian Williams | 1 | -6 | -6.0 | 0 | 0 |
Kentucky| Player | CAR | YDS | AVG | TD | LONG |
|---|---|---|---|---|---|
| Jason Patterson | 11 | 78 | 7.1 | 0 | 22 |
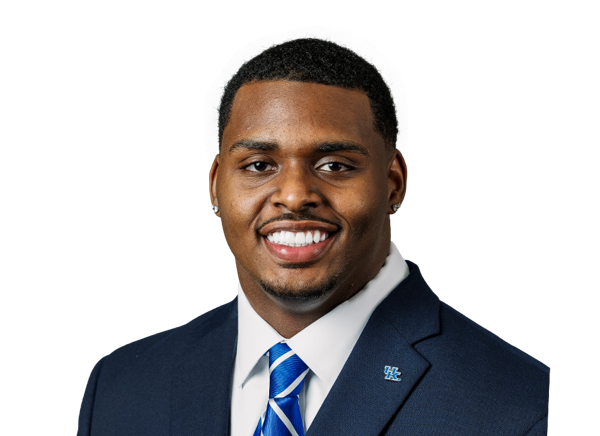 CJ Baxter | 9 | 48 | 5.3 | 2 | 15 |
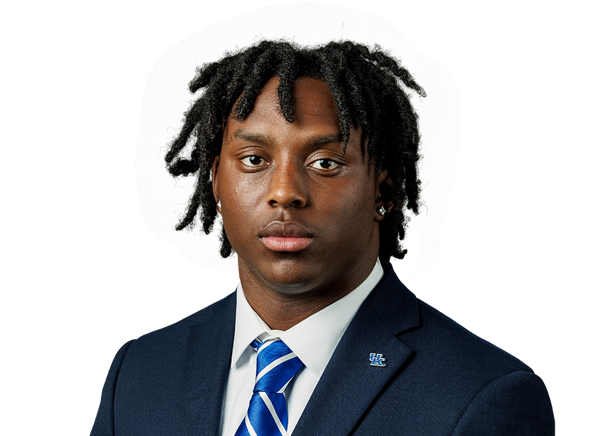 Martels Carter Jr. | 5 | 37 | 7.4 | 0 | 15 |
| Kenny Minchey | 1 | 17 | 17.0 | 0 | 17 |
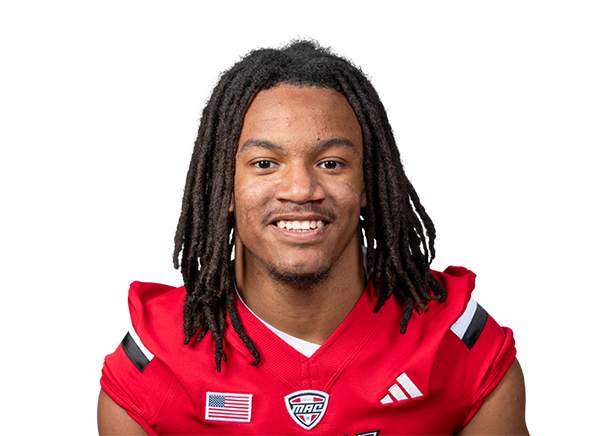 Ahmir Smith | 2 | 13 | 6.5 | 0 | 8 |
| Kenny Darby | 1 | 9 | 9.0 | 0 | 9 |
 Callum Wither | 1 | 3 | 3.0 | 0 | 3 |
 Mikkel Skinner | 1 | 3 | 3.0 | 0 | 3 |
 Team | 3 | -3 | -1.0 | 0 | 3 |
Youngstown State| Player | REC | YDS | AVG | TD | LONG |
|---|---|---|---|---|---|
| Lynn Wyche-El | 7 | 111 | 15.9 | 1 | 28 |
 Lorenzo Jenkins | 3 | 46 | 15.3 | 0 | 30 |
| Jaden Gilbert | 5 | 24 | 4.8 | 0 | 9 |
 Jeremiah Sanders | 2 | 23 | 11.5 | 0 | 13 |
 Alex McDonald | 1 | 15 | 15.0 | 0 | 15 |
| Dorian Williams | 1 | 11 | 11.0 | 0 | 11 |
| Bryan Hunt | 1 | 6 | 6.0 | 0 | 6 |
| Tahir Mills | 2 | 6 | 3.0 | 0 | 3 |
| Fresh Walters | 1 | 2 | 2.0 | 0 | 2 |
| Antuan Gardner | 1 | 2 | 2.0 | 0 | 2 |
Kentucky| Player | REC | YDS | AVG | TD | LONG |
|---|---|---|---|---|---|
| Kenny Darby | 3 | 74 | 24.7 | 1 | 37 |
| Mikkel Skinner | 4 | 61 | 15.3 | 1 | 28 |
 Willie Rodriguez | 4 | 48 | 12.0 | 0 | 20 |
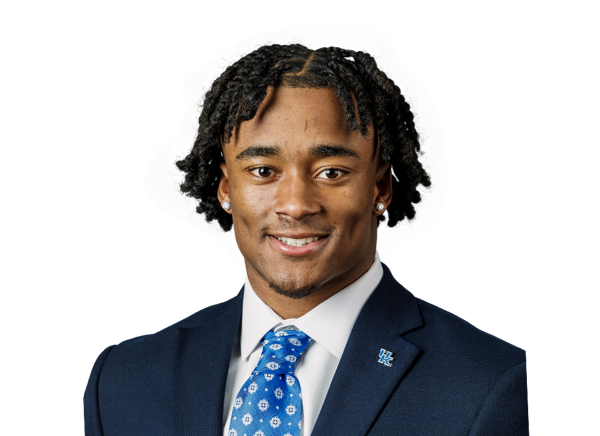 Brock Coffman | 1 | 38 | 38.0 | 0 | 38 |
 Henry Boyer | 1 | 31 | 31.0 | 0 | 31 |
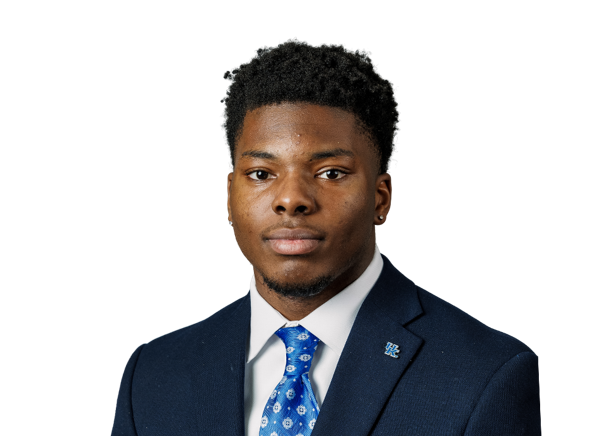 Prince Jean | 2 | 27 | 13.5 | 1 | 26 |
| Jason Patterson | 1 | 16 | 16.0 | 0 | 16 |
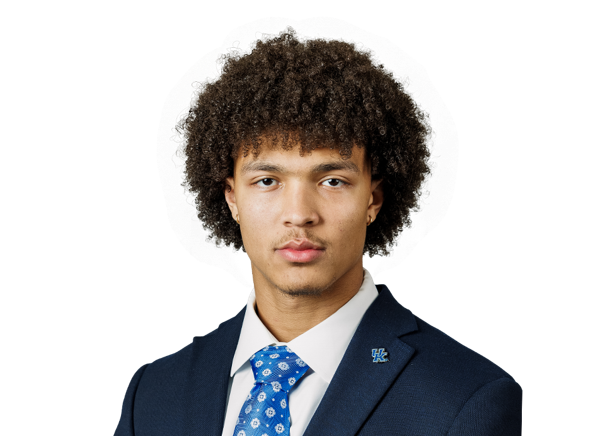 Nic Anderson | 1 | 4 | 4.0 | 0 | 4 |
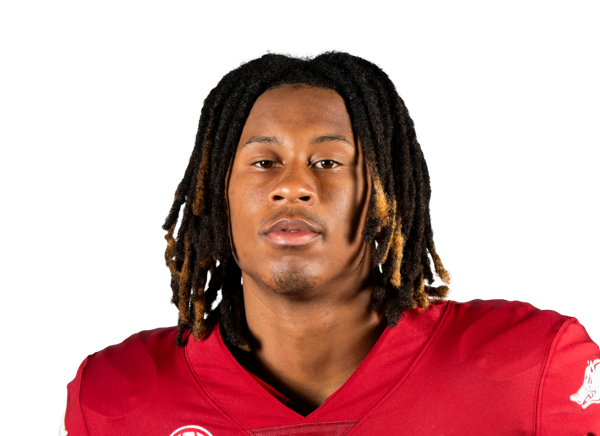 Ja'Kayden Ferguson | 1 | 2 | 2.0 | 0 | 2 |
Youngstown State| Player | TOT | SOLO | SACKS | TFL | PD | QB HUR | TD |
|---|---|---|---|---|---|---|---|
| Danny Inglis | 6 | 2 | 0 | 0.5 | 0 | 0 | 0 |
 Graydon Rollins | 6 | 1 | 0 | 0 | 0 | 0 | 0 |
| Darvens Tunis | 5 | 2 | 0 | 0 | 0 | 0 | 0 |
| Roderick Owens Jr. | 5 | 2 | 0 | 0 | 0 | 0 | 0 |
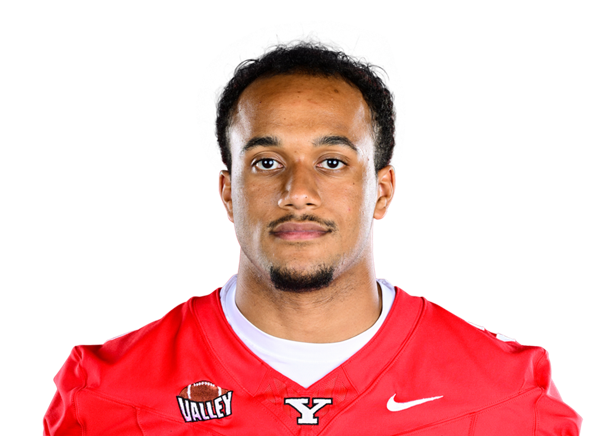 Carston Marshall | 5 | 1 | 0 | 0.5 | 1 | 0 | 0 |
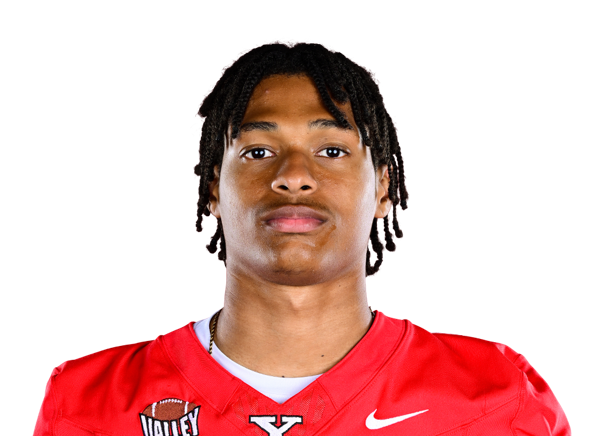 Jussiah Williams-West | 4 | 3 | 0 | 0 | 0 | 0 | 0 |
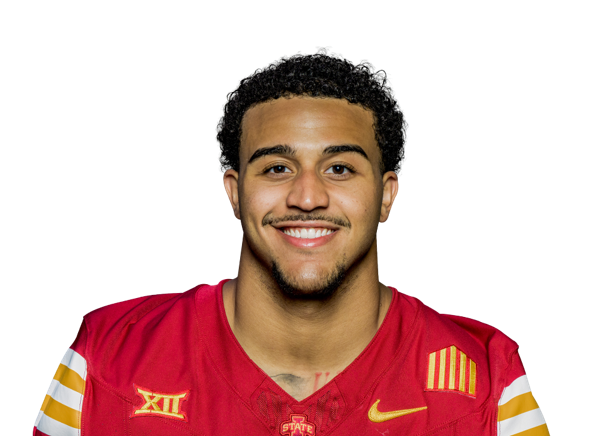 Cam Smith | 4 | 2 | 0 | 0 | 0 | 0 | 0 |
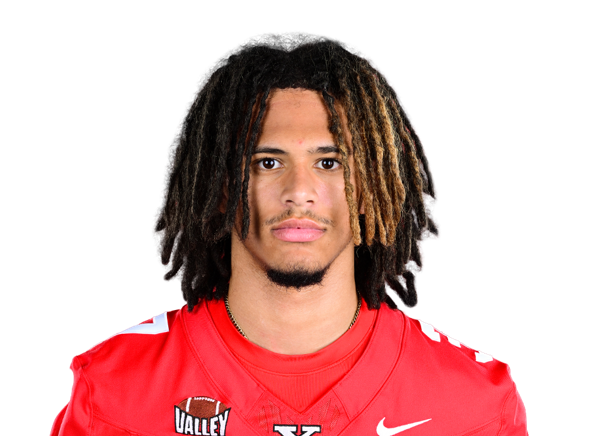 Maximillian Johnson | 4 | 2 | 0 | 0 | 0 | 0 | 0 |
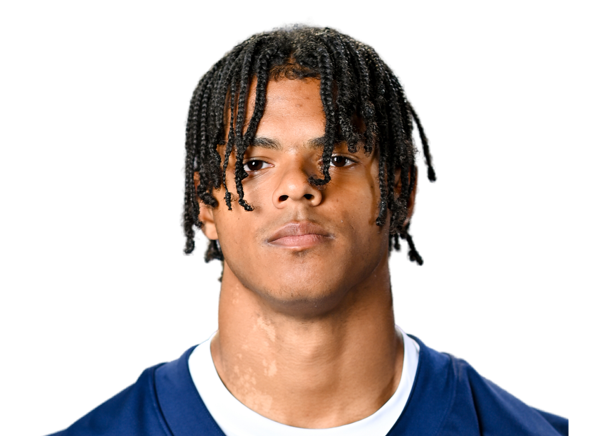 Raleigh Collins III | 3 | 3 | 0 | 0 | 0 | 0 | 0 |
 Michael Wells | 3 | 1 | 0 | 0 | 1 | 0 | 0 |
| Dev Holman | 3 | 1 | 0 | 0 | 1 | 0 | 0 |
 Michael Wright Jr. | 3 | 0 | 0 | 0.5 | 0 | 0 | 0 |
 D'Shawn Kirby | 3 | 0 | 0 | 0 | 0 | 0 | 0 |
 Conlan Greene | 2 | 0 | 0 | 0 | 0 | 0 | 0 |
 Dominic Julius | 1 | 1 | 0 | 0 | 0 | 0 | 0 |
| Dorian Williams | 1 | 1 | 0 | 0 | 0 | 0 | 0 |
 Stephen Henderson | 1 | 1 | 0 | 0 | 0 | 0 | 0 |
 Ross Davidson | 1 | 1 | 0 | 0 | 0 | 0 | 0 |
| Julius Jackson | 1 | 1 | 0 | 0 | 0 | 0 | 0 |
 Danny Nittoli | 1 | 0 | 0 | 0 | 0 | 0 | 0 |
 Jordan Pritchard-Sewell | 1 | 0 | 0 | 0 | 0 | 1 | 0 |
 Thomas Jolly | 1 | 0 | 0 | 0.5 | 0 | 0 | 0 |
| AJ Snyder | 1 | 0 | 0 | 0 | 0 | 0 | 0 |
 Brandon Chambers Jr. | 0 | 0 | 0 | 0 | 2 | 0 | 0 |
 Andrew Jackson-Dunaway | 0 | 0 | 0 | 0 | 0 | 1 | 0 |
Kentucky| Player | TOT | SOLO | SACKS | TFL | PD | QB HUR | TD |
|---|---|---|---|---|---|---|---|
 Isaiah McMillian | 7 | 5 | 0 | 1 | 1 | 0 | 0 |
 Elijah Barnes | 7 | 4 | 0 | 0 | 1 | 0 | 0 |
| Jordan Castell | 7 | 2 | 0 | 2 | 0 | 0 | 0 |
 Grant Godfrey | 7 | 1 | 0 | 0 | 0 | 2 | 0 |
 Ty Bryant | 5 | 2 | 0 | 0 | 0 | 0 | 0 |
 Grant Grayton | 5 | 2 | 0 | 0 | 0 | 0 | 0 |
 Tavion Wallace | 4 | 3 | 0 | 0 | 0 | 1 | 0 |
 Cyrus Reyes | 4 | 2 | 0 | 0 | 1 | 0 | 0 |
 Cedric Works | 2 | 2 | 0 | 0 | 0 | 0 | 0 |
 Mi'Quise Humphrey-Grace | 2 | 1 | 0 | 0 | 0 | 1 | 0 |
 Nasir Addison | 2 | 0 | 0 | 0 | 0 | 0 | 0 |
 Sam Greene | 2 | 0 | 0 | 0 | 0 | 0 | 0 |
| Ahmad Breaux | 1 | 1 | 1 | 1 | 0 | 0 | 0 |
 Devin Smith | 1 | 1 | 1 | 1 | 0 | 0 | 0 |
 Jaden Williams | 1 | 1 | 0 | 0 | 1 | 0 | 0 |
 Kalen Edwards | 1 | 1 | 0 | 0 | 0 | 0 | 0 |
 Antwan Smith | 1 | 1 | 0 | 0 | 0 | 0 | 0 |
 Tyler Thomas | 1 | 0 | 0 | 0 | 0 | 0 | 0 |
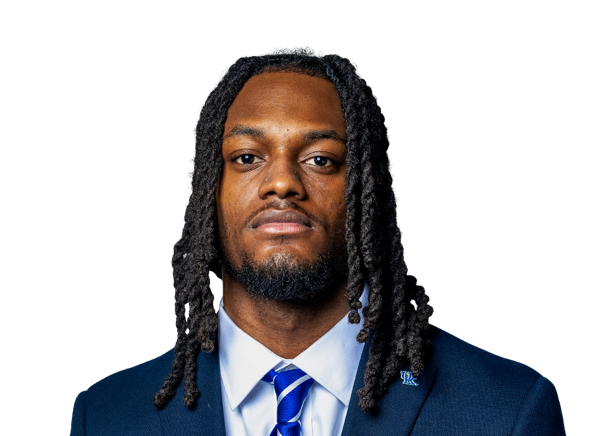 Jaden Smith | 1 | 0 | 0 | 0 | 0 | 0 | 0 |
 Ben Duncum | 0 | 0 | 0 | 0 | 0 | 1 | 0 |
Youngstown State| Player | FUM | LOST | REC |
|---|---|---|---|
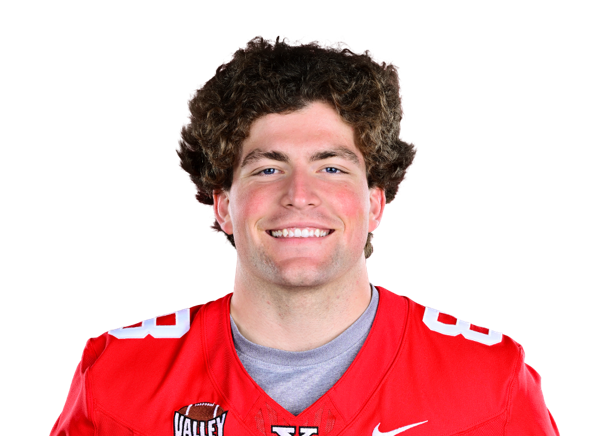 Payton Bjork | 1 | 1 | 0 |
| Beau Brungard | 1 | 0 | 0 |
Kentucky| Player | FUM | LOST | REC |
|---|---|---|---|
| Team | 1 | 0 | 0 |
| Ty Bryant | 0 | 0 | 1 |
Youngstown State| Player | FG | PCT | LONG | XP | PTS |
|---|---|---|---|---|---|
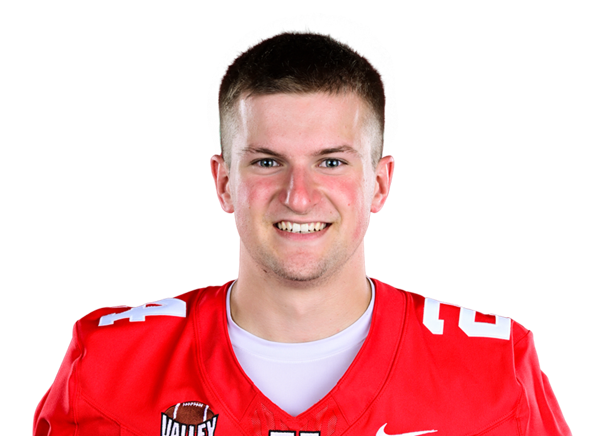 Andrew Lastovka | 0/0 | 0.0 | 0 | 1/2 | 1 |
Kentucky| Player | FG | PCT | LONG | XP | PTS |
|---|---|---|---|---|---|
 Adam Zouagui | 1/1 | 100.0 | 28 | 6/6 | 9 |
Youngstown State| Player | NO | YDS | AVG | TB | In 20 | LONG |
|---|---|---|---|---|---|---|
 Evan Anderson | 3 | 142 | 47.3 | 1 | 1 | 53 |
| Lachlan Amore | 2 | 82 | 41.0 | 0 | 0 | 44 |
Kentucky| Player | NO | YDS | AVG | TB | In 20 | LONG |
|---|---|---|---|---|---|---|
 Thomas O'Hara | 2 | 84 | 42.0 | 0 | 1 | 45 |
Kentucky| Player | NO | YDS | AVG | LONG | TD |
|---|---|---|---|---|---|
 Andrew Weber | 1 | 19 | 19.0 | 19 | 0 |
Youngstown State| Player | NO | YDS | AVG | LONG | TD |
|---|---|---|---|---|---|
| Payton Bjork | 1 | 1 | 1.0 | 1 | 0 |
Kentucky| Player | NO | YDS | AVG | LONG | TD |
|---|---|---|---|---|---|
| Brock Coffman | 3 | 25 | 8.3 | 11 | 0 |
| Andrew Weber | 1 | 4 | 4.0 | 4 | 0 |
Drive Summary
UK
Touchdown
74
YSU
Punt
8
UK
Touchdown
60
YSU
Downs
35
UK
Touchdown
59
YSU
Punt
37
UK
Punt
8
UK
Touchdown
28
YSU
Touchdown
75
UK
End Of Half
-1
YSU
Punt
-3
UK
Touchdown
75
YSU
Touchdown
75
UK
Punt
33
YSU
Punt
12
UK
Touchdown
60
YSU
Downs
51
UK
Field Goal
66
YSU
Punt
16
UK
End Of Quarter
14
Injury Report
No current injury report is available for this matchup.
Head-to-Head
Historical meetings are not available for this matchup.
Game Information
StageWeek 1
Season2026
KickoffSat, Sep 5, 1:00 pm
VenueKroger Field
LocationLexington, KY
SurfaceArtificial Turf
BroadcastSECN+
Division Standings
FCS — Missouri Valley Football Conference
| Team | W | L | T | Pct | PF | PA | Home | Away | Strk |
|---|---|---|---|---|---|---|---|---|---|
 Illinois State | 1 | 0 | 0 | 1.000 | 28 | 24 | 0-0 | 1-0 | W1 |
 North Dakota | 0 | 1 | 0 | 0.000 | 7 | 34 | 0-0 | 0-1 | L1 |
 South Dakota | 0 | 1 | 0 | 0.000 | 24 | 38 | 0-0 | 0-1 | L1 |
 South Dakota State | 0 | 1 | 0 | 0.000 | 18 | 34 | 0-0 | 0-1 | L1 |
 Southern Illinois | 0 | 1 | 0 | 0.000 | 10 | 48 | 0-0 | 0-1 | L1 |
| Youngstown State | 0 | 1 | 0 | 0.000 | 13 | 45 | 0-0 | 0-1 | L1 |
 Northern Iowa | 0 | 1 | 0 | 0.000 | 0 | 55 | 0-0 | 0-1 | L1 |
 Murray State | 0 | 2 | 0 | 0.000 | 14 | 97 | 0-0 | 0-2 | L2 |
 Indiana State | 0 | 1 | 0 | 0.000 | 19 | 44 | 0-0 | 0-1 | L1 |
FBS — Southeastern Conference
| Team | W | L | T | Pct | PF | PA | Home | Away | Strk |
|---|---|---|---|---|---|---|---|---|---|
 Alabama | 7 | 2 | 0 | 0.778 | 337 | 183 | 4-1 | 3-1 | W2 |
| Kentucky | 7 | 2 | 0 | 0.778 | 269 | 232 | 4-1 | 3-1 | L1 |
 Missouri | 6 | 3 | 0 | 0.667 | 272 | 181 | 4-1 | 2-2 | L1 |
 Oklahoma | 5 | 4 | 0 | 0.556 | 199 | 173 | 3-2 | 2-2 | W1 |
 South Carolina | 6 | 3 | 0 | 0.667 | 312 | 211 | 4-2 | 2-1 | W4 |
 Arkansas | 3 | 6 | 0 | 0.333 | 180 | 247 | 2-3 | 1-3 | L2 |
 Auburn | 5 | 4 | 0 | 0.556 | 219 | 237 | 4-2 | 1-2 | W1 |
 Florida | 5 | 4 | 0 | 0.556 | 292 | 248 | 3-2 | 2-2 | L2 |
 Georgia | 8 | 1 | 0 | 0.889 | 370 | 126 | 5-1 | 3-0 | W2 |
 LSU | 6 | 3 | 0 | 0.667 | 334 | 159 | 5-1 | 1-2 | L1 |
 Mississippi State | 4 | 5 | 0 | 0.444 | 236 | 250 | 2-3 | 2-2 | L5 |
 Ole Miss | 6 | 3 | 0 | 0.667 | 304 | 234 | 5-1 | 1-2 | L1 |
 Tennessee | 7 | 2 | 0 | 0.778 | 292 | 136 | 5-1 | 2-1 | W1 |
 Texas A&M | 4 | 5 | 0 | 0.444 | 235 | 168 | 4-1 | 0-4 | L2 |
 Texas | 7 | 2 | 0 | 0.778 | 280 | 157 | 5-1 | 2-1 | W3 |
 Vanderbilt | 4 | 5 | 0 | 0.444 | 207 | 265 | 3-2 | 1-3 | W1 |
Youngstown State
1st in MVFC
VS
Kentucky
2nd in SEC
Quarterbacks & Specialists
#42
Lachlan Amore
#37
Evan Anderson
#12
Beau Brungard
#10
Malachi Lewis
Receivers & Backs
#88
Payton Bjork
#4
Antuan Gardner
#7
Jaden Gilbert
#8
Bryan Hunt
#11
Lorenzo Jenkins
#17
Alex McDonald
Tahir Mills
#6
Jeremiah Sanders
#5
Fresh Walters
#2
Dorian Williams
#1
Lynn Wyche-El
Defensive Line & Linebackers
#90
Conlan Greene
#23
Stephen Henderson
#13
Danny Inglis
#48
Andrew Jackson-Dunaway
#95
Thomas Jolly
#97
D'Shawn Kirby
#5
Carston Marshall
#33
Danny Nittoli
#9
Jordan Pritchard-Sewell
#35
Graydon Rollins
#49
AJ Snyder
#3
Michael Wells
#45
Michael Wright Jr.
Defensive Backs
#19
Brandon Chambers Jr.
#7
Raleigh Collins III
#21
Ross Davidson
#22
Dev Holman
#6
Julius Jackson
#37
Maximillian Johnson
#14
Dominic Julius
#36
Roderick Owens Jr.
#1
Cam Smith
#18
Darvens Tunis
Jussiah Williams-West
Other
#24
Andrew Lastovka
Quarterbacks & Specialists
#3
Kenny Minchey
#48
Thomas O'Hara
#10
Callum Wither
Receivers & Backs
#4
Nic Anderson
#1
CJ Baxter
#87
Henry Boyer
#12
Brock Coffman
#19
Kenny Darby
#5
Ja'Kayden Ferguson
#83
Prince Jean
#26
Jason Patterson
#81
Willie Rodriguez
#8
Mikkel Skinner
#28
Ahmir Smith
Defensive Line & Linebackers
Elijah Barnes
#6
Ahmad Breaux
#92
Ben Duncum
#93
Kalen Edwards
#22
Grant Godfrey
#2
Sam Greene
#90
Mi'Quise Humphrey-Grace
#4
Antwan Smith
#32
Devin Smith
#97
Tyler Thomas
#25
Tavion Wallace
#91
Jaden Williams
#15
Cedric Works
Defensive Backs
#21
Nasir Addison
#14
Ty Bryant
Martels Carter Jr.
#5
Jordan Castell
#30
Grant Grayton
#27
Isaiah McMillian
#13
Cyrus Reyes
#24
Jaden Smith
#36
Andrew Weber
Other
#88
Adam Zouagui
Youngstown State
1st in MVFC
VS
Kentucky
2nd in SEC
Passing
73.3
Completion Percentage
68.4
200
Completions
160
1.50
Interception Percentage
0.40
4
Interceptions
1
75
Longest Pass
53
2,480
Net Passing Yards
1,755
275.6
Net Passing Yards Per Game
219.4
273
Passing Attempts
234
8.40
Passing Touchdown %
6.00
23
Passing Touchdowns
14
174.5
Passer Rating
150.3
13
Total Sacks
16
66
Sack Yards Lost
90
9.1
Yards Per Pass Attempt
7.5
2,480
Passing Yards
1,755
0
Passing Fumbles Lost
0
9
Team Games Played
8
468.3
Yards Per Game
386.4
38.2
Total Points Per Game
32.9
344
Total Points
263
47
Total Touchdowns
33
275.6
Passing Yards Per Game
219.4
200-273
Comp-Att
160-234
13-66
Sacks-Yards Lost
16-90
Rushing
320
Rushing Attempts
278
1,735
Rushing Yards
1,336
5.4
Yards Per Rush Attempt
4.8
65
Long Rushing
77
0
20+ Yard Rushing Plays
0
23
Rushing Touchdowns
16
192.8
Rushing Yards Per Game
167.0
0
Rushing Fumbles
0
0
Rushing Fumbles Lost
0
91
Rushing 1st downs
69
9
Team Games Played
8
4,215
Total Yards
3,091
606
Total Offensive Plays
528
38.2
Total Points Per Game
32.9
344
Total Points
263
47
Total Touchdowns
33
Receiving
200
Receptions
160
0
Receiving Targets
0
2,480
Receiving Yards
1,755
2,480
Receiving Yards
1,755
23
Receiving Touchdowns
14
75
Long Reception
53
0
20+ Yard Receiving Plays
0
275.6
Receiving Yards Per Game
219.4
0
Receiving Fumbles
0
0
Receiving Fumbles Lost
0
95
Receiving Yards After Catch
1083
120
Receiving First Downs
82
9
Team Games Played
8
12.4
Yards Per Reception
11.0
38.2
Total Points Per Game
32.9
344
Total Points
263
47
Total Touchdowns
33
Miscellaneous
223
Total 1st downs
164
91
Rushing 1st downs
69
121
Passing 1st downs
82
11
1st downs by penalty
12
56
Third Down Conversions
31
100
Third Down Attempts
92
56.00
3rd down %
33.70
9
Fourth Down Conversions
10
14
First Downs Attempts
16
64.29
4th down %
62.50
55
Total Penalties
36
532
Total Penalty Yards
335
16295
Possession Time Seconds
15022
0.00
Red Zone Field Goal Percentage
0.00
0.00
Red Zone Scoring Percentage
0.00
0.00
Red Zone Efficiency Percentage
0.00
0.00
Red Zone Touchdown Percentage
0.00
8
Total Takeaways
8
6
Total Giveaways
5
2
Turnover Ratio
3
0
Fumbles Lost
0
56-100
3rd down efficiency
31-92
9-14
4th down efficiency
10-16
55-532
Total-Yards
36-335
Defense
269
Solo Tackles
263
310
Assist Tackles
272
579
Total Tackles
535
16
Sacks
21
116
Sack Yards
113
68
Stuffs
59
36
Passes Defended
37
9.3
Average Interception Yards
13.4
21
Long Interception
43
0
Miscellaneous Touchdowns
0
4
Kicks Blocked
0
40
Tackles For Loss
37
9
Team Games Played
8
Defensive Interceptions
7
Interceptions
12
65
Interception Yards
161
0
Interception Touchdowns
2
7-65
INT: Total
12-161
General
5
Fumbles
9
7
Forced Fumbles
5
4
Fumbles Recovered
7
0
Fumbles Touchdowns
0
9
Games Played
8
5-0
Fumbles-Lost
9-0
Returning
11
Kick Returns
10
288
Kick Return Yards
171
26.2
Yards Per Kick Return
17.1
93
Long Kick Return
27
1
Kick Return Touchdowns
0
10
Punt Returns
11
110
Punt Return Yards
91
11.0
Yards Per Punt Return
8.3
44
Long Punt Return
55
0
Punt Return Touchdowns
1
0
Punt Return Fair Catches
0
0
Kick Return Fumbles Lost
0
0
Punt Return Fumbles Lost
0
9
Team Games Played
8
10-110
Punt: Total
11-91
Kicking
5
Field Goal Made
10
5
Field Goal Attempts
14
100.0
Field Goal Percentage
71.4
39
Long Field Goal Made
52
0
Field Goal Attempts 1-19
0
2
Field Goal Attempts 20-29
4
3
Field Goal Attempts 30-39
5
0
Field Goal Attempts 40-49
4
0
Field Goal Attempts 50+
1
43
Extra Points Made
31
45
Extra Point Attempts
31
95.6
Extra Point Percentage
100.0
0
Field Goals Made 1-19
0
2
Field Goals Made 20-29
3
3
Field Goals Made 30-39
4
0
Field Goals Made 40-49
2
0
Field Goals Made 50+
1
58
Total Kicking Points
61
9
Team Games Played
8
63
Touchback Percentage
81
0.0
Average Kickoff Return Yards
0.0
0
Kickoff Return Yards
0
0
Kickoff Returns
0
0-0
Kickoffs: Total
0-0
5-5
FG: Good-Attempts
10-14
Punting
25
Punts
27
1,069
Punt Yards
1,135
73
Long Punt
58
42.8
Gross Average Punt Yards
42.0
42.8
Net Average Punt Yards
42.0
0
Punts Blocked
0
10
Punts Inside 20
7
2
Touchbacks
2
5
Fair Catches
7
10
Punt Returns
9
0
Punt Return Yards
0
0.0
Average Punt Return Yards
0.0
9
Team Games Played
8
25-1,069
Punt: Total Yards
27-1,135
Scoring
23
Rushing Touchdowns
16
23
Receiving Touchdowns
14
1
Return Touchdowns
1
47
Total Touchdowns
31
5
Field Goals
10
43
Kick Extra Points
31
2
Total Two Point Conversions
2
344
Total Points
263
38.2
Total Points Per Game
32.9