

Angels vs Giants Live Score (25 Jul, 2026)
Game Information
Stage
Standard
Season
2026
First Pitch
Sat, Jul 25, 4:05 pm
Venue
Oracle Park
Location
San Francisco, California
Attendance
39,102
Live Situation
0Balls
1Strikes
0Outs
—Pitcher
—At Bat
Pitch Sequence
1
STRIKE SWINGING
Splitter
88 MPH
2
BALL IN PLAY
Splitter
89 MPH
Injury Report
Team Stats
 LAA
SF


2
Runs
9
9
Hits
11
1
Errors
0
0
Home Runs
2
5
Walks
2
6
Strikeouts
8
Player Box Score
Los Angeles Angels
| Player | H-AB | AB | R | H | RBI | HR | BB | K | #P | AVG | OBP | SLG |
|---|---|---|---|---|---|---|---|---|---|---|---|---|
 Zach Neto | 0-3 | 3 | 0 | 0 | 0 | 0 | 0 | 1 | 12 | .236 | .326 | .445 |
 Oswald Peraza | 0-1 | 1 | 0 | 0 | 0 | 0 | 0 | 1 | 3 | .239 | .283 | .371 |
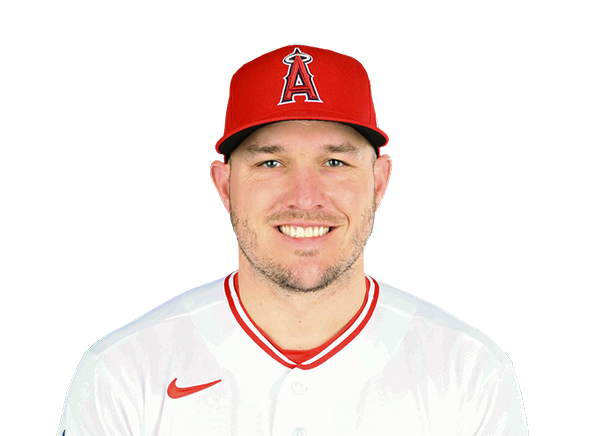 Mike Trout | 2-3 | 3 | 0 | 2 | 0 | 0 | 1 | 0 | 19 | .237 | .392 | .458 |
 Josh Lowe | 0-0 | 0 | 0 | 0 | 0 | 0 | 1 | 0 | 7 | .207 | .258 | .359 |
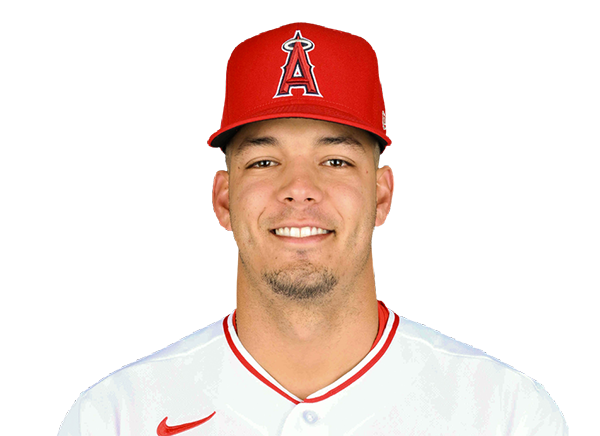 Vaughn Grissom | 1-4 | 4 | 0 | 1 | 1 | 0 | 1 | 1 | 18 | .255 | .321 | .398 |
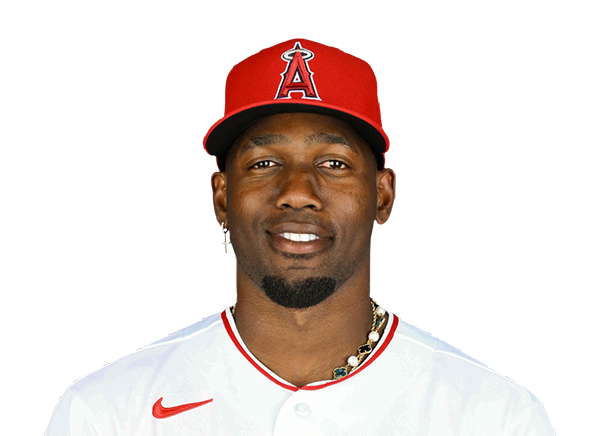 Jorge Soler | 0-5 | 5 | 0 | 0 | 0 | 0 | 0 | 1 | 12 | .201 | .288 | .366 |
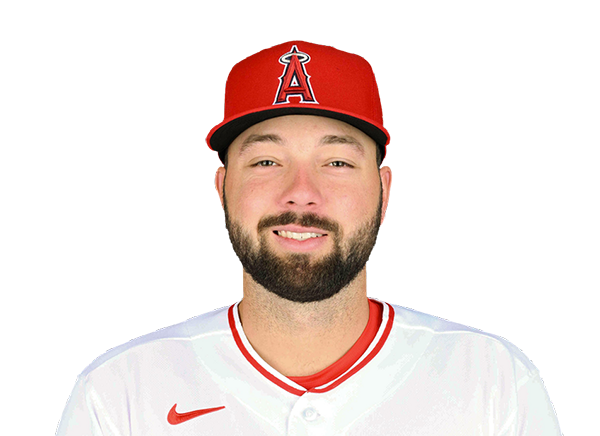 Nolan Schanuel | 1-4 | 4 | 0 | 1 | 0 | 0 | 0 | 1 | 12 | .282 | .353 | .392 |
 Jo Adell | 1-2 | 2 | 0 | 1 | 0 | 0 | 1 | 1 | 11 | .243 | .291 | .398 |
 Wade Meckler | 0-1 | 1 | 0 | 0 | 0 | 0 | 0 | 0 | 3 | .297 | .366 | .399 |
 Denzer Guzman | 0-4 | 4 | 0 | 0 | 0 | 0 | 0 | 0 | 10 | .240 | .286 | .368 |
 Jose Siri | 2-3 | 3 | 2 | 2 | 0 | 0 | 1 | 0 | 13 | .281 | .340 | .490 |
 Logan O'Hoppe | 2-4 | 4 | 0 | 2 | 0 | 0 | 0 | 0 | 13 | .216 | .278 | .304 |
San Francisco Giants
| Player | H-AB | AB | R | H | RBI | HR | BB | K | #P | AVG | OBP | SLG |
|---|---|---|---|---|---|---|---|---|---|---|---|---|
 Luis Arraez | 2-4 | 4 | 2 | 2 | 1 | 0 | 0 | 1 | 13 | .326 | .363 | .449 |
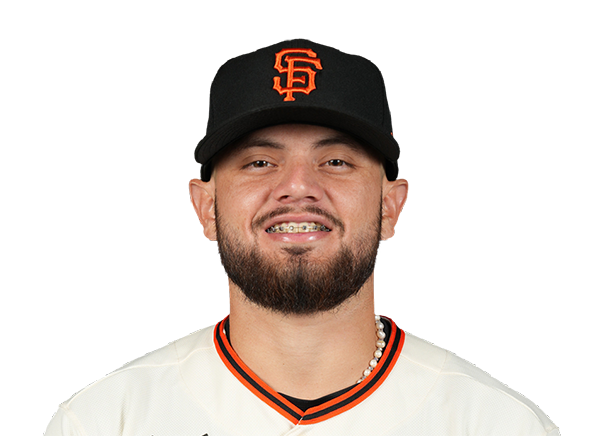 Jesus Rodriguez | 0-1 | 1 | 0 | 0 | 0 | 0 | 0 | 0 | 7 | .239 | .300 | .413 |
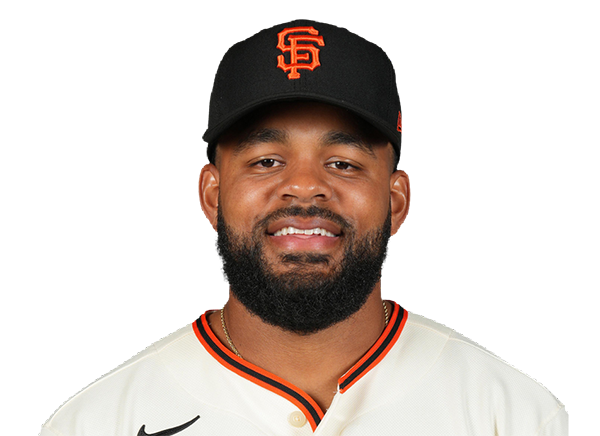 Heliot Ramos | 1-5 | 5 | 1 | 1 | 0 | 0 | 0 | 1 | 17 | .262 | .296 | .441 |
 Bryce Eldridge | 0-3 | 3 | 0 | 0 | 0 | 0 | 1 | 2 | 21 | .263 | .361 | .465 |
 Drew Cavanaugh | 0-1 | 1 | 0 | 0 | 0 | 0 | 0 | 0 | 2 | .225 | .340 | .225 |
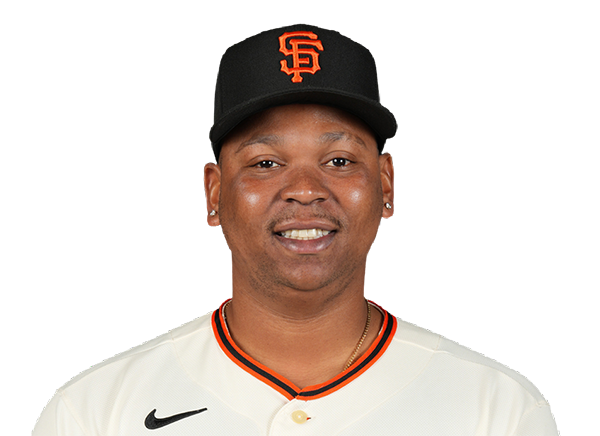 Rafael Devers | 3-4 | 4 | 2 | 3 | 4 | 1 | 0 | 0 | 13 | .249 | .319 | .489 |
 Christian Koss | 0-0 | 0 | 0 | 0 | 0 | 0 | 0 | 0 | 0 | .143 | .217 | .190 |
 Casey Schmitt | 1-4 | 4 | 1 | 1 | 1 | 0 | 0 | 0 | 9 | .272 | .302 | .487 |
 Jung Hoo Lee | 2-3 | 3 | 1 | 2 | 3 | 1 | 0 | 1 | 14 | .302 | .336 | .435 |
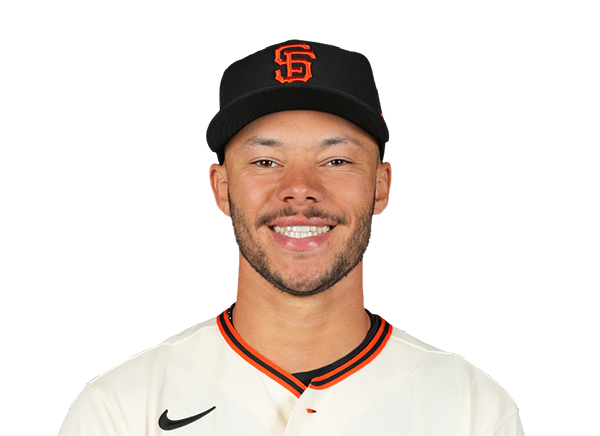 Grant McCray | 0-0 | 0 | 0 | 0 | 0 | 0 | 0 | 0 | 0 | .000 | .250 | .000 |
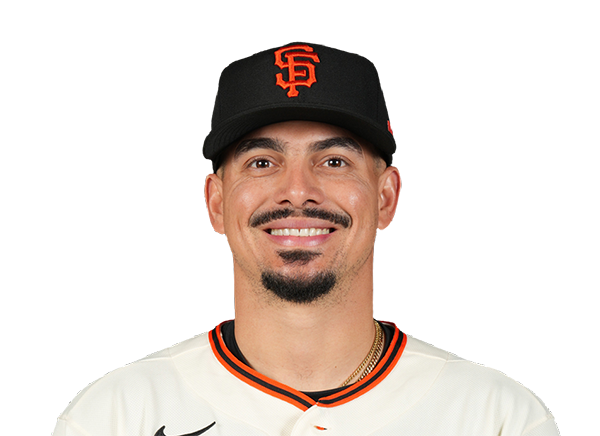 Willy Adames | 1-4 | 4 | 0 | 1 | 0 | 0 | 0 | 2 | 15 | .225 | .276 | .429 |
 Drew Gilbert | 1-3 | 3 | 1 | 1 | 0 | 0 | 1 | 1 | 19 | .235 | .320 | .357 |
 Daniel Susac | 0-3 | 3 | 1 | 0 | 0 | 0 | 0 | 0 | 15 | .250 | .297 | .319 |
Los Angeles Angels
| Player | IP | H | R | ER | BB | K | HR | PC-ST | ERA | PC |
|---|---|---|---|---|---|---|---|---|---|---|
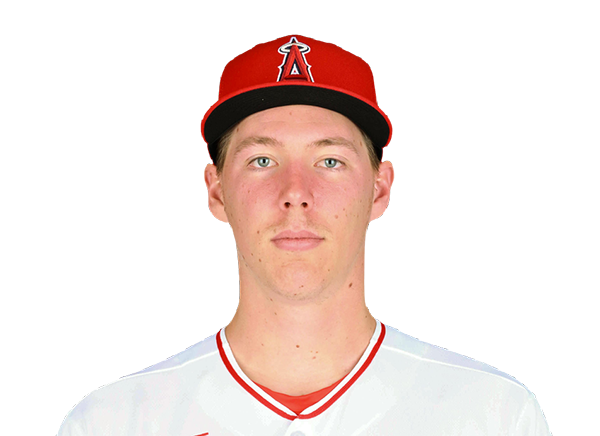 Ryan Johnson | 3.1 | 8 | 8 | 8 | 1 | 4 | 1 | 69-46 | 7.34 | 69 |
 Brent Suter | 2.2 | 2 | 1 | 1 | 0 | 4 | 1 | 44-29 | 4.42 | 44 |
 Kirby Yates | 1.0 | 1 | 0 | 0 | 1 | 0 | 0 | 21-14 | 3.65 | 21 |
 Tyler Heineman | 1.0 | 0 | 0 | 0 | 0 | 0 | 0 | 11-8 | 10.38 | 11 |
San Francisco Giants
| Player | IP | H | R | ER | BB | K | HR | PC-ST | ERA | PC |
|---|---|---|---|---|---|---|---|---|---|---|
 Robbie Ray | 6.0 | 6 | 0 | 0 | 2 | 5 | 0 | 80-54 | 3.16 | 80 |
 Tristan Beck | 2.0 | 1 | 1 | 1 | 1 | 0 | 0 | 29-17 | 6.39 | 29 |
 Keaton Winn | 1.0 | 2 | 1 | 1 | 2 | 1 | 0 | 24-15 | 3.38 | 24 |
H2H / Season Series
SF3–4
LAA
SF9–2
LAA
SF7–6
LAA
SF0–2
LAA
LAA1–4
SF
Last 5 Games
| Date | Opponent | Result |
|---|---|---|
| Aug 22 |  @ TEX | W3–0 |
| Aug 21 | @ TEX | L1–2 |
| Aug 20 |  @ HOU | W18–3 |
| Aug 19 | @ HOU | L2–3 |
| Aug 18 | @ HOU | W3–1 |
| Date | Opponent | Result |
|---|---|---|
| Aug 22 |  @ BOS | L2–3 |
| Aug 21 | @ BOS | L4–6 |
| Aug 20 |  @ CLE | L2–5 |
| Aug 19 | @ CLE | W1–0 |
| Aug 18 | @ CLE | L1–8 |
Standings
American League
| Team | W | L | PCT | GB | DIFF | STRK |
|---|---|---|---|---|---|---|
1 Rays | 76 | 53 | .589 | - | +42 | L3 |
2 White Sox | 67 | 62 | .519 | 9 | +42 | L1 |
| 3Astros | 65 | 65 | .500 | 11.5 | -43 | L1 |
4 Yankees | 73 | 56 | .566 | 3 | +95 | L1 |
| 5Red Sox | 70 | 59 | .543 | 6 | +98 | W2 |
| 6Rangers | 64 | 66 | .492 | 12.5 | -48 | L1 |
| 7Guardians | 64 | 66 | .492 | 12.5 | -14 | W3 |
8 Blue Jays | 64 | 67 | .489 | 13 | -50 | W1 |
9 Twins | 63 | 67 | .485 | 13.5 | -47 | L2 |
10 Orioles | 63 | 67 | .485 | 13.5 | -33 | W2 |
11 Mariners | 62 | 68 | .477 | 14.5 | -44 | W2 |
12 Tigers | 61 | 68 | .473 | 15 | +77 | L4 |
13 Royals | 57 | 74 | .435 | 20 | -95 | W7 |
| 14Angels | 52 | 78 | .400 | 24.5 | -68 | W1 |
15 Athletics | 50 | 80 | .385 | 26.5 | -188 | W1 |
National League
| Team | W | L | PCT | GB | DIFF | STRK |
|---|---|---|---|---|---|---|
1 Brewers | 81 | 49 | .623 | - | +163 | W3 |
2 Dodgers | 79 | 51 | .608 | 2 | +147 | W5 |
3 Braves | 75 | 55 | .577 | 6 | +108 | L2 |
4 Cubs | 74 | 56 | .569 | 7 | +98 | L3 |
5 Phillies | 72 | 58 | .554 | 9 | +25 | W8 |
6 Padres | 70 | 60 | .538 | 11 | +9 | W2 |
7 Diamondbacks | 68 | 62 | .523 | 13 | +7 | L1 |
8 Marlins | 66 | 64 | .508 | 15 | +17 | W2 |
9 Cardinals | 66 | 65 | .504 | 15.5 | 0 | L2 |
10 Pirates | 63 | 68 | .481 | 18.5 | +29 | L2 |
11 Reds | 62 | 68 | .477 | 19 | -92 | W1 |
12 Nationals | 61 | 70 | .466 | 20.5 | +14 | L3 |
13 Mets | 59 | 71 | .454 | 22 | -39 | W1 |
| 14Giants | 52 | 77 | .403 | 28.5 | -79 | L3 |
15 Rockies | 50 | 79 | .388 | 30.5 | -131 | L5 |
LAA
VS
SF
Pitchers
Ryan Johnson
Brent Suter
Kirby Yates
Tyler Heineman
Catchers
Logan O'Hoppe
Infielders
Zach Neto
Oswald Peraza
Vaughn Grissom
Nolan Schanuel
Denzer Guzman
Outfielders
Mike Trout
Josh Lowe
Jo Adell
Wade Meckler
Jose Siri
Designated Hitters
Jorge Soler
Pitchers
Robbie Ray
Tristan Beck
Keaton Winn
Catchers
Daniel Susac
Infielders
Luis Arraez
Jesus Rodriguez
Rafael Devers
Christian Koss
Casey Schmitt
Willy Adames
Outfielders
Heliot Ramos
Jung Hoo Lee
Grant McCray
Drew Gilbert
Designated Hitters
Bryce Eldridge
Drew Cavanaugh
Angels
VS
Giants
Batting
130
Team Games Played
129
4347
At Bats
4381
1025
Hits
1082
515
Runs Batted In
499
128
Home Runs
143
72
Stolen Bases
57
.236
Batting Average
.247
534
Runs
519
195
Doubles
214
12
Triples
24
1628
Total Bases
1773
406
Walks
343
1226
Strikeouts
1029
.310
On Base Percentage
.305
.375
Slugging Percentage
.405
.684
OBP Pct + SLG Pct
.710
130
Games Played
129
130
Games Started
129
72
Hit By Pitch
41
0.0
Wins Above Replacement
0.0
0.0
Offensive Wins Above Replacement
0.0
22
Caught Stealing
18
1
Is Qualified
1
508.3
Runs Created
545.3
3.9
Runs Created Per 27 Outs
4.3
.083
Walks Per Plate Appearance
.071
0.33
Walk To Strikeout Ratio
0.33
.139
Isolated Power
.158
.244
Secondary Average
.245
3.90
Pitches Per Plate Appearance
3.86
335
Extra Base Hits
381
4871
Plate Appearances
4823
34.0
At Bats Per Home Run
30.6
20
Sacrifice Hit
22
24
Sacrifice Flies
36
Pitching
130
Team Games Played
129
41
Quality Starts
45
52
Wins
52
78
Losses
77
21
Saves
24
70
Holds
63
998
Hits
1061
543
Earned runs
549
137
Home Runs
118
534
Walks
486
1167
Strikeouts
971
9.2
Strikeouts Per 9 Innings
7.7
152.7
Pitches Per Start
147.7
1.34
Walks Plus Hits Per Inning Pitched
1.36
4.26
Earned Run Average
4.35
78
Losses
77
1146.0
Innings pitched
1136.1
.400
Win Percentage
.403
43
Save Opportunities
44
.232
Opponent Batting Average
.247
.323
Opponent's On-base pct.
.329
.377
Opponent's Slugging pct.
.387
.700
Opponent's OPB Pct + SLG Pct
.716
4303
At Bats
4289
180
Doubles
188
16
Triples
28
66
Batters Hit
57
88
Stolen Bases
104
130
Games Played
129
0
Complete Games
1
11
Shutouts
9
54
Wild Pitches
47
570
Runs Batted In
562
2
Balks
4
1146.0
Innings pitched
1136.1
9.2
Strikeouts Per 9 Innings
7.7
23
Caught Stealing
34
130
Games Started
129
0.0
Wins Above Replacement
0.0
1
Is Qualified
1
602
Runs
598
543
Earned Runs
549
1621
Total Bases
1659
Fielding
130
Team Games Played
129
1146
Full Innings
1136
4581
Total Chances
4707
3438
Putouts
3409
1067
Assists
1214
76
Errors
84
195
Double Plays
214
0.983
Fielding Percentage
0.982
35.4
Range Factor
36.6
0.0
Zone Rating
0.0
130
Games Played
129
0
Games Started
0
0.0
Defensive Wins Above Replacement
0.0
1
Qualified
1