

Angels vs Marlins Live Score (7 Aug, 2026)
Game Information
Stage
Standard
Season
2026
First Pitch
Fri, Aug 7, 7:10 pm
Venue
loanDepot park
Location
Miami, Florida
Attendance
16,506
Home Runs
Zach Neto
20 HR
.230 AVG
50 RBI
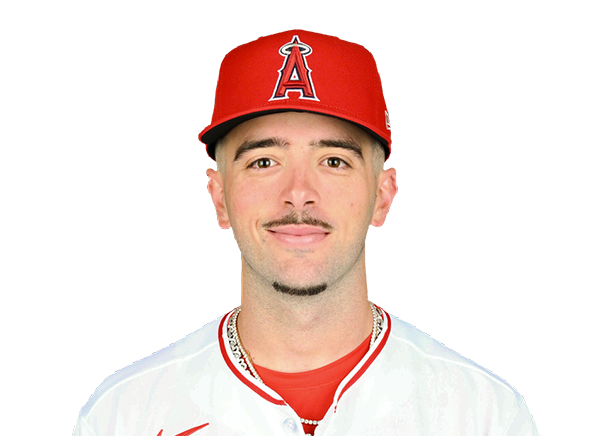
Heriberto Hernandez
16 HR
.229 AVG
43 RBI
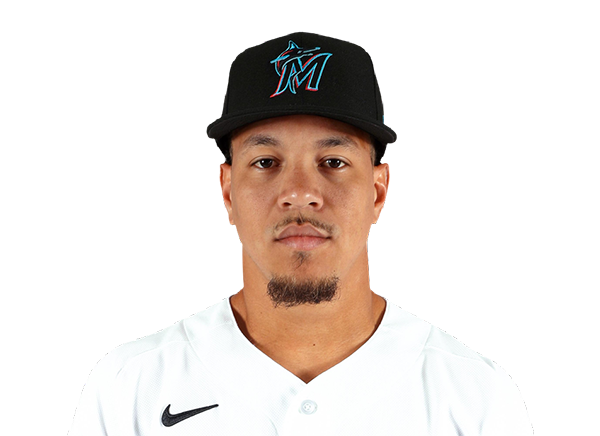
Batting Average
Nolan Schanuel
.273 AVG
.343 OBP
.384 SLG

Otto Lopez
.318 AVG
.351 OBP
.474 SLG

Runs Batted In
Zach Neto
50 RBI
20 HR
.230 AVG
Otto Lopez
51 RBI
9 HR
.318 AVG
Earned Run Average
Reid Detmers
4.12 ERA
3 W
150 K

Sandy Alcantara
3.68 ERA
12 W
120 K
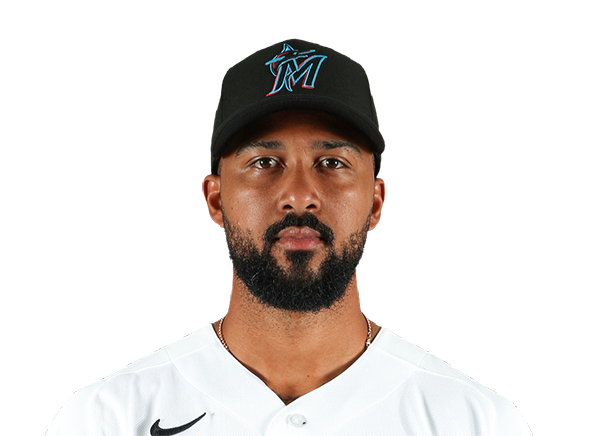
Wins
Walbert Urena
7 W
2.54 ERA
95 K
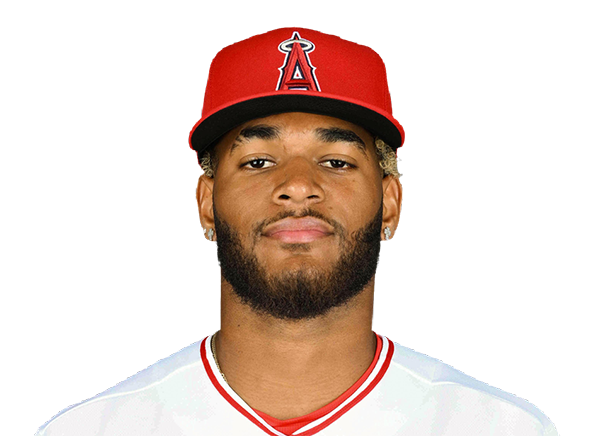
Sandy Alcantara
12 W
3.68 ERA
120 K
Strikeouts
Reid Detmers
150 K
3 W
4.12 ERA
Max Meyer
121 K
9 W
2.68 ERA

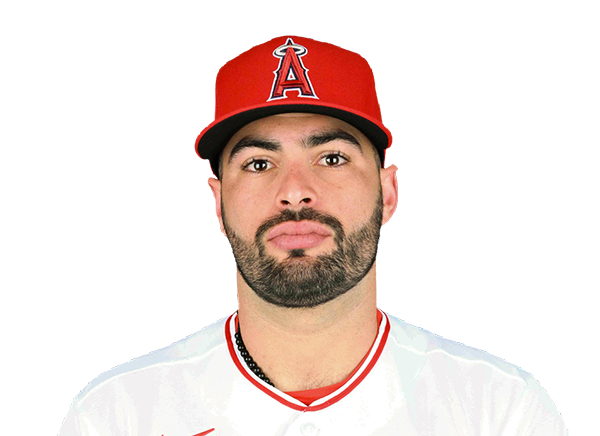
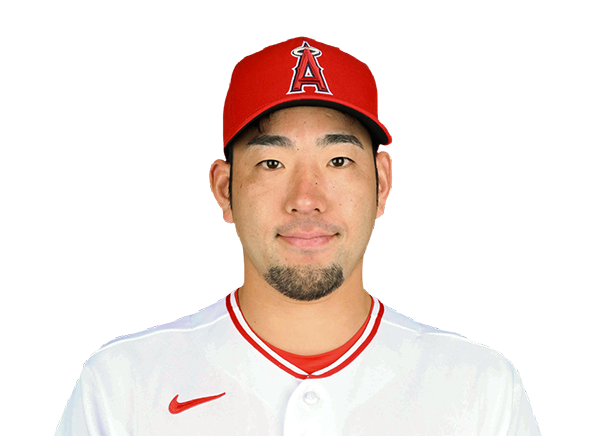
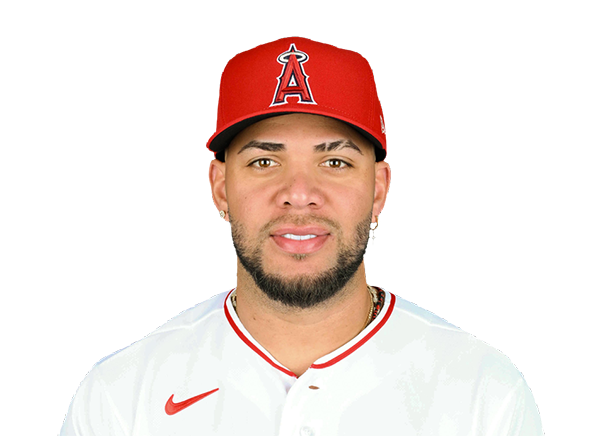
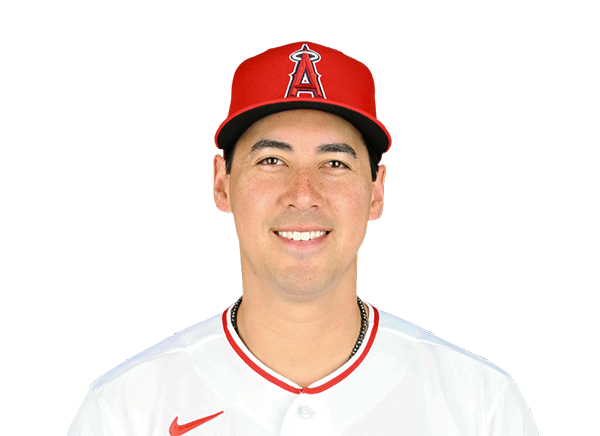
Injury Report



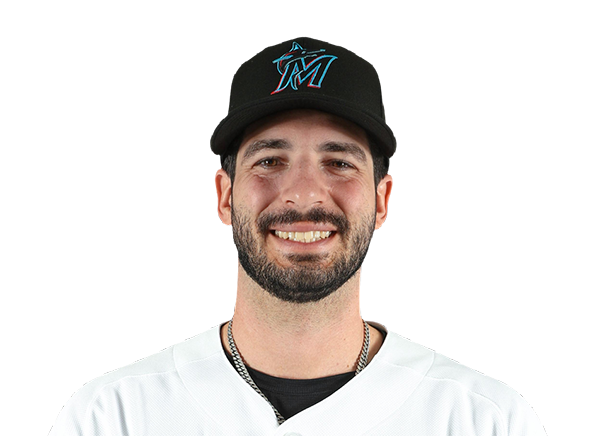
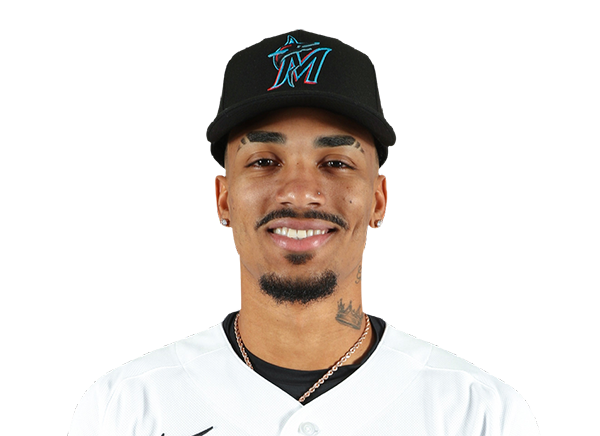
Team Stats
 LAA
MIA


Array
Runs
Array
6
Hits
12
0
Errors
1
—
Home Runs
—
—
Walks
—
—
Strikeouts
—
Standings
American League
| Team | W | L | PCT | GB | DIFF | STRK |
|---|---|---|---|---|---|---|
1 Rays | 76 | 52 | .594 | - | +43 | L2 |
2 White Sox | 67 | 61 | .523 | 9 | +47 | W1 |
3 Astros | 65 | 64 | .504 | 11.5 | -42 | W1 |
4 Yankees | 73 | 56 | .566 | 3.5 | +95 | L1 |
5 Red Sox | 69 | 59 | .539 | 7 | +97 | W1 |
6 Rangers | 64 | 65 | .496 | 12.5 | -45 | W2 |
7 Blue Jays | 64 | 67 | .489 | 13.5 | -50 | W1 |
8 Twins | 63 | 66 | .488 | 13.5 | -45 | L1 |
9 Guardians | 63 | 66 | .488 | 13.5 | -15 | W2 |
10 Orioles | 62 | 67 | .481 | 14.5 | -34 | W1 |
11 Tigers | 61 | 67 | .477 | 15 | +79 | L3 |
12 Mariners | 61 | 68 | .473 | 15.5 | -45 | W1 |
13 Royals | 56 | 74 | .431 | 21 | -97 | W6 |
| 14Angels | 51 | 78 | .395 | 25.5 | -71 | L1 |
15 Athletics | 49 | 80 | .380 | 27.5 | -189 | L5 |
National League
| Team | W | L | PCT | GB | DIFF | STRK |
|---|---|---|---|---|---|---|
1 Brewers | 81 | 49 | .623 | - | +163 | W3 |
2 Dodgers | 78 | 51 | .605 | 2.5 | +146 | W4 |
3 Braves | 75 | 55 | .577 | 6 | +108 | L2 |
4 Cubs | 74 | 55 | .574 | 6.5 | +99 | L2 |
5 Phillies | 71 | 58 | .550 | 9.5 | +16 | W7 |
6 Padres | 69 | 60 | .535 | 11.5 | +7 | W1 |
7 Diamondbacks | 68 | 61 | .527 | 12.5 | +13 | W2 |
8 Cardinals | 66 | 64 | .508 | 15 | +9 | L1 |
| 9Marlins | 65 | 64 | .504 | 15.5 | +15 | W1 |
10 Pirates | 63 | 67 | .485 | 18 | +30 | L1 |
11 Reds | 61 | 68 | .473 | 19.5 | -98 | L2 |
12 Nationals | 61 | 69 | .469 | 20 | +16 | L2 |
13 Mets | 58 | 71 | .450 | 22.5 | -44 | L1 |
14 Giants | 52 | 76 | .406 | 28 | -78 | L2 |
15 Rockies | 50 | 78 | .391 | 30 | -130 | L4 |
LAA
VS
MIA
Pitchers

George Klassen
Catchers

Tyler Heineman
Infielders
Nolan Schanuel
Zach Neto
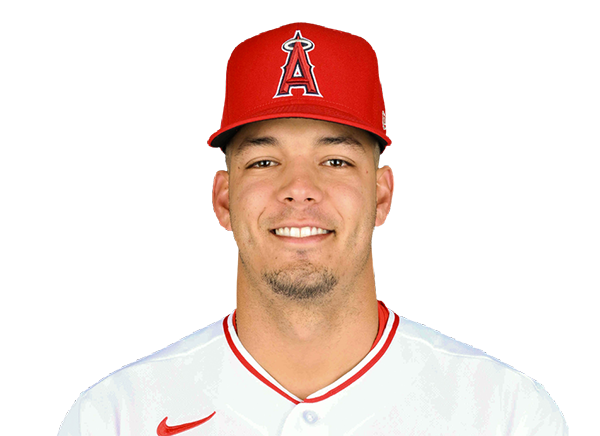
Vaughn Grissom
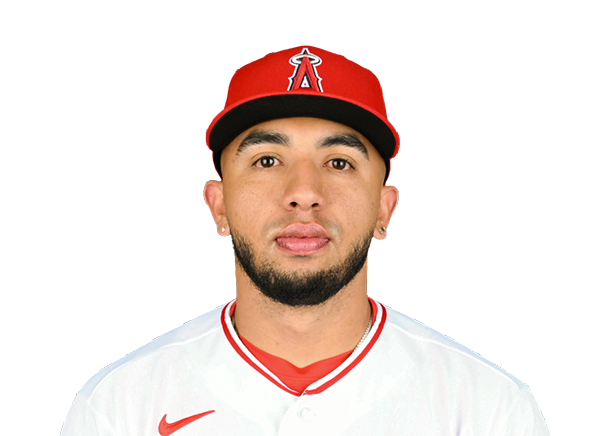
Oswald Peraza
Outfielders
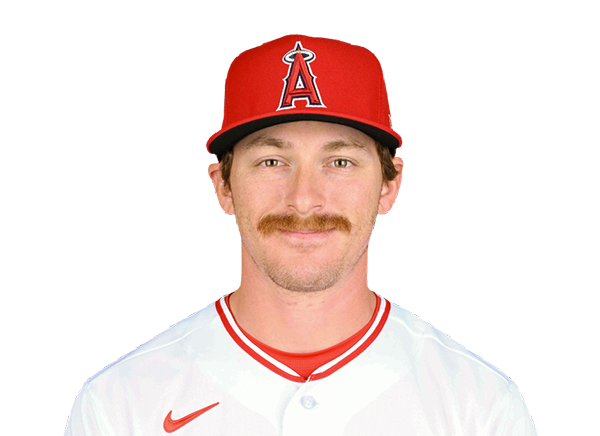
Wade Meckler

Mike Trout

Josh Lowe
Designated Hitters
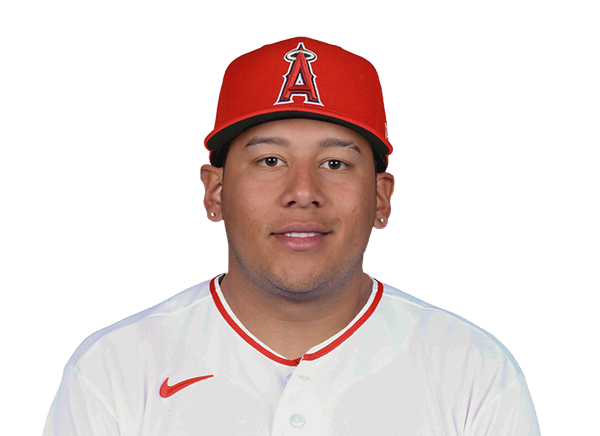
Moises Ballesteros
Pitchers
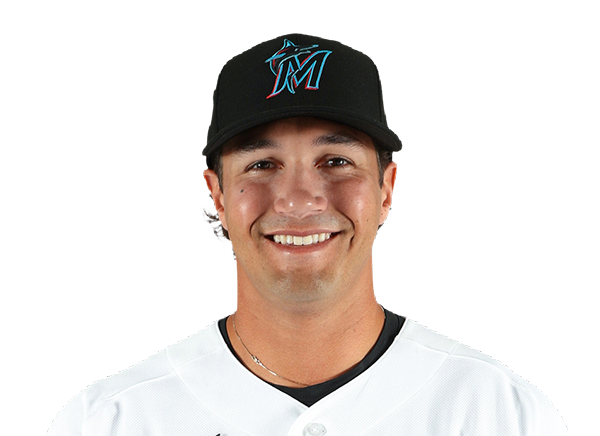
Tyler Phillips
Catchers

Joe Mack
Infielders

Kyle Stowers
Otto Lopez
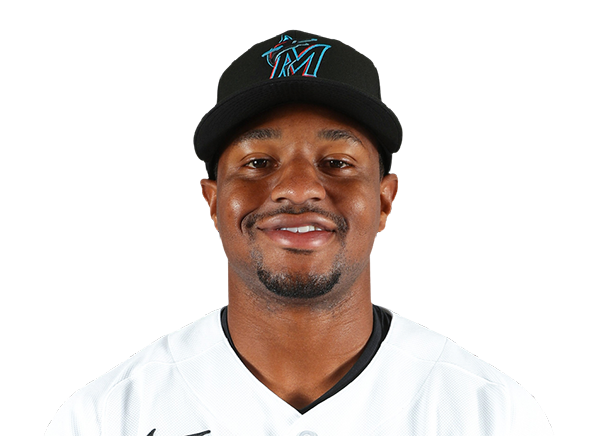
Xavier Edwards
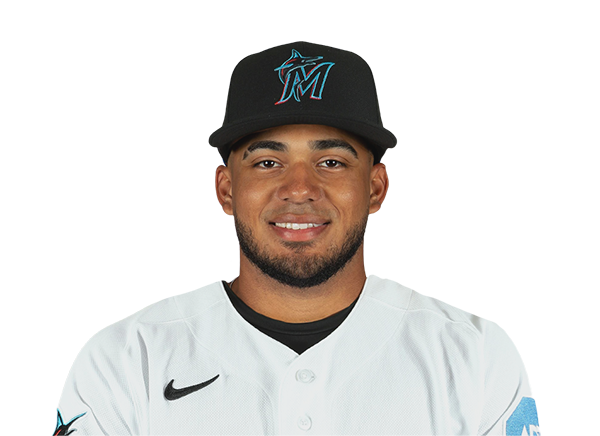
Leo Jimenez
Outfielders
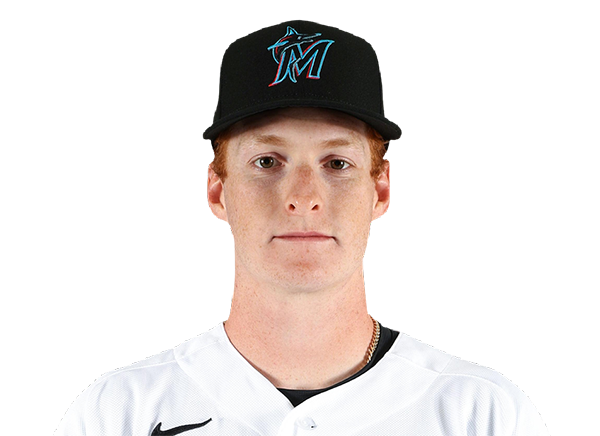
Owen Caissie
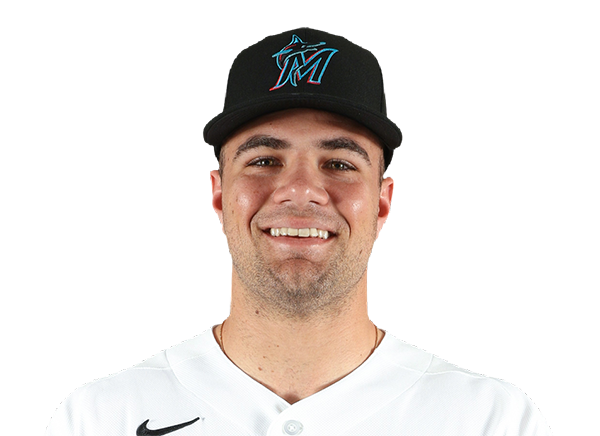
Jakob Marsee

Esteury Ruiz
Designated Hitters

Griffin Conine
Angels
VS
Marlins
Batting
116
Team Games Played
117
3882
At Bats
3886
918
Hits
969
462
Runs Batted In
486
122
Home Runs
118
57
Stolen Bases
124
.236
Batting Average
.249
481
Runs
505
172
Doubles
192
11
Triples
25
1478
Total Bases
1565
368
Walks
390
1099
Strikeouts
945
.312
On Base Percentage
.325
.381
Slugging Percentage
.403
.692
OBP Pct + SLG Pct
.728
116
Games Played
117
116
Games Started
117
66
Hit By Pitch
62
0.0
Wins Above Replacement
0.0
0.0
Offensive Wins Above Replacement
0.0
18
Caught Stealing
37
1
Is Qualified
1
462.5
Runs Created
527.7
4.0
Runs Created Per 27 Outs
4.6
.085
Walks Per Plate Appearance
.089
0.33
Walk To Strikeout Ratio
0.41
.144
Isolated Power
.153
.249
Secondary Average
.276
3.89
Pitches Per Plate Appearance
3.81
305
Extra Base Hits
335
4355
Plate Appearances
4394
31.8
At Bats Per Home Run
32.9
14
Sacrifice Hit
18
23
Sacrifice Flies
37
Pitching
116
Team Games Played
117
33
Quality Starts
39
45
Wins
58
71
Losses
59
16
Saves
28
64
Holds
66
901
Hits
893
505
Earned runs
457
127
Home Runs
119
493
Walks
391
1033
Strikeouts
974
9.1
Strikeouts Per 9 Innings
8.5
153.9
Pitches Per Start
143.3
1.36
Walks Plus Hits Per Inning Pitched
1.25
4.45
Earned Run Average
4.01
71
Losses
59
1021.1
Innings pitched
1026.0
.388
Win Percentage
.496
36
Save Opportunities
43
.234
Opponent Batting Average
.232
.328
Opponent's On-base pct.
.310
.384
Opponent's Slugging pct.
.378
.713
Opponent's OPB Pct + SLG Pct
.688
3845
At Bats
3853
168
Doubles
170
14
Triples
18
63
Batters Hit
61
86
Stolen Bases
104
116
Games Played
117
0
Complete Games
1
8
Shutouts
10
46
Wild Pitches
35
529
Runs Batted In
479
2
Balks
3
1021.1
Innings pitched
1026.0
9.1
Strikeouts Per 9 Innings
8.5
21
Caught Stealing
29
116
Games Started
117
0.0
Wins Above Replacement
0.0
1
Is Qualified
1
556
Runs
506
505
Earned Runs
457
1478
Total Bases
1456
Fielding
116
Team Games Played
117
1021
Full Innings
1026
4084
Total Chances
4122
3064
Putouts
3078
952
Assists
967
68
Errors
77
172
Double Plays
192
0.983
Fielding Percentage
0.981
35.4
Range Factor
35.5
0.0
Zone Rating
0.0
116
Games Played
117
0
Games Started
0
0.0
Defensive Wins Above Replacement
0.0
1
Qualified
1