

Angels vs Nationals Live Score (11 Sep, 2026)
Game Information
Stage
STD
Season
2026
First Pitch
Fri, Sep 11, 6:45 pm
Venue
Nationals Park
Location
Washington, District of Columbia
Venue Type
Outdoor
Broadcast
MLB.TV
Attendance
17,061
Live Situation
0Balls
0Strikes
0Outs
—Pitcher
—At Bat
Pitch Sequence
1
BALL IN PLAY
Changeup
84 MPH
Injury Report

Team Stats
 LAA
WSH


3
Runs
4
4
Hits
6
1
Errors
0
1
Home Runs
0
3
Walks
5
11
Strikeouts
9
Player Box Score
Los Angeles Angels
| Player | H-AB | AB | R | H | RBI | HR | BB | K | #P | AVG | OBP | SLG |
|---|---|---|---|---|---|---|---|---|---|---|---|---|
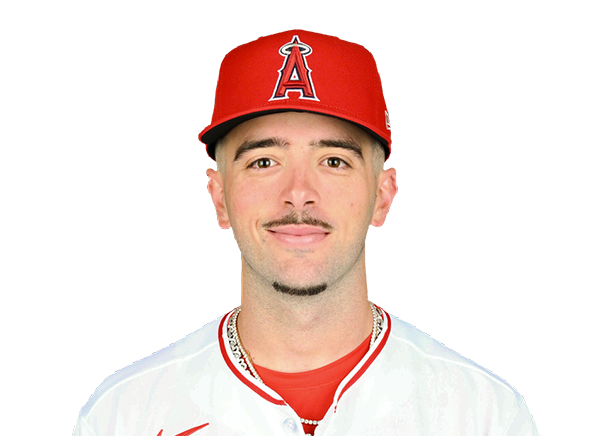 Zach Neto | 0-4 | 4 | 0 | 0 | 0 | 0 | 0 | 2 | 13 | .242 | .322 | .440 |
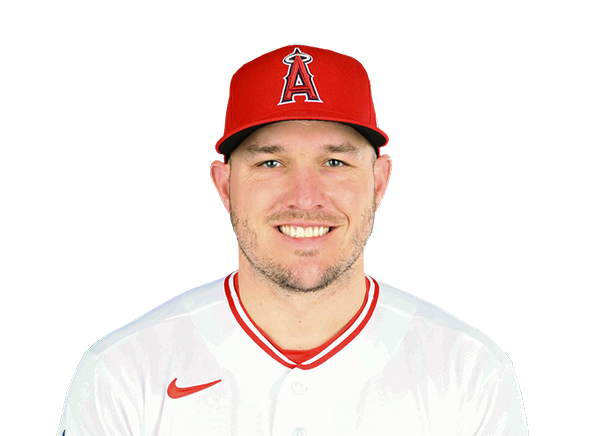 Mike Trout | 1-3 | 3 | 1 | 1 | 1 | 1 | 0 | 2 | 20 | .244 | .376 | .430 |
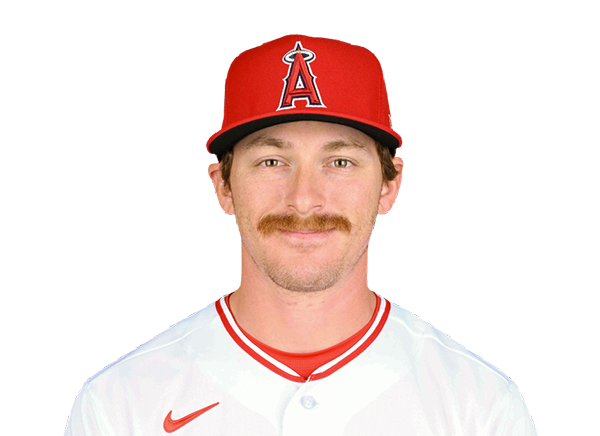 Wade Meckler | 0-3 | 3 | 0 | 0 | 0 | 0 | 0 | 1 | 12 | .294 | .369 | .384 |
 Jose Siri | 0-1 | 1 | 0 | 0 | 0 | 0 | 0 | 0 | 4 | .223 | .279 | .394 |
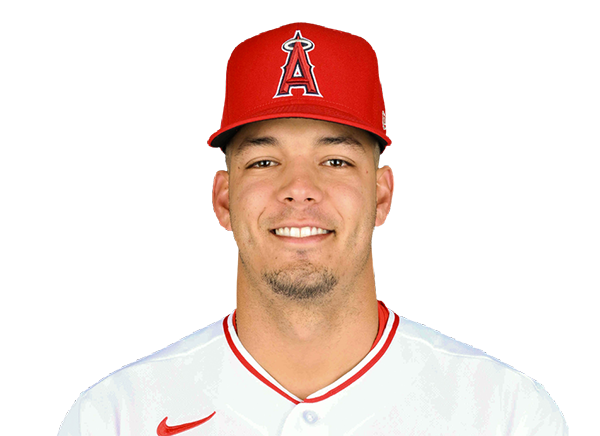 Vaughn Grissom | 0-3 | 3 | 1 | 0 | 0 | 0 | 1 | 0 | 19 | .243 | .307 | .381 |
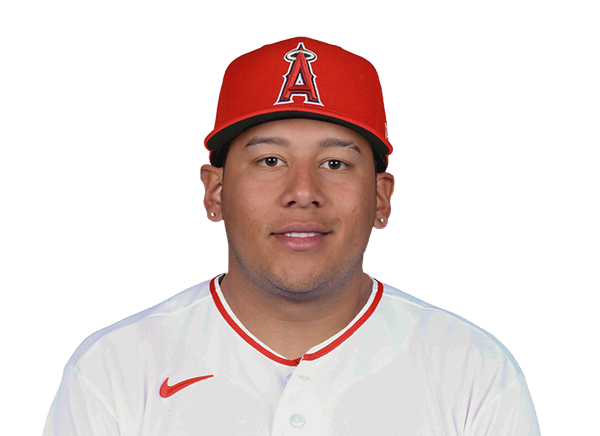 Moises Ballesteros | 0-2 | 2 | 0 | 0 | 0 | 0 | 1 | 1 | 14 | .218 | .281 | .342 |
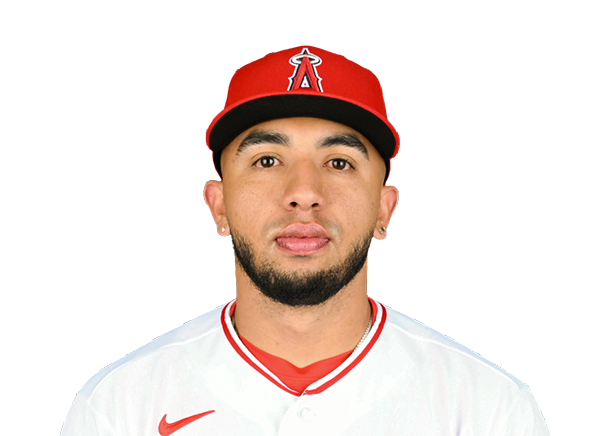 Oswald Peraza | 0-0 | 0 | 1 | 0 | 0 | 0 | 1 | 0 | 7 | .225 | .282 | .340 |
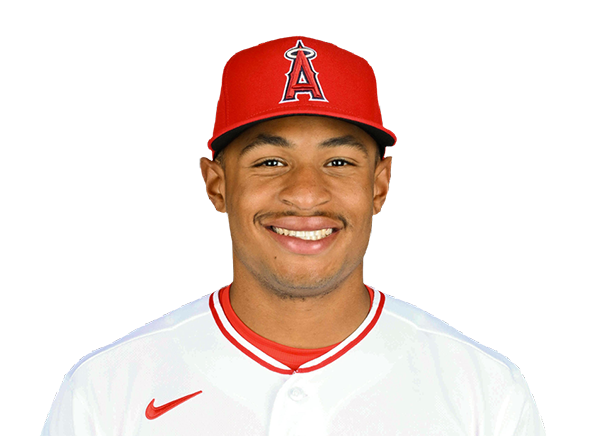 Christian Moore | 2-4 | 4 | 0 | 2 | 2 | 0 | 0 | 1 | 18 | .195 | .253 | .287 |
 Josh Lowe | 0-2 | 2 | 0 | 0 | 0 | 0 | 0 | 2 | 14 | .205 | .275 | .352 |
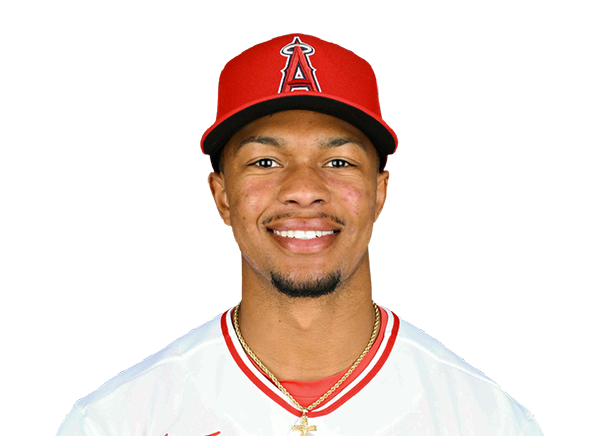 Kyren Paris | 0-1 | 1 | 0 | 0 | 0 | 0 | 0 | 0 | 1 | .000 | .167 | .000 |
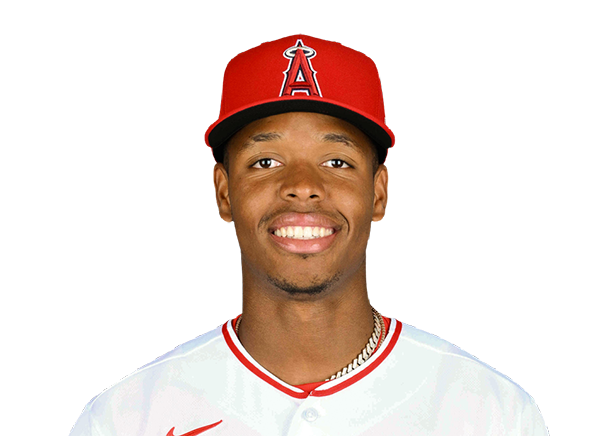 Denzer Guzman | 0-3 | 3 | 0 | 0 | 0 | 0 | 0 | 1 | 12 | .224 | .266 | .351 |
 Adam Frazier | 1-3 | 3 | 0 | 1 | 0 | 0 | 0 | 1 | 8 | .236 | .309 | .341 |
Washington Nationals
| Player | H-AB | AB | R | H | RBI | HR | BB | K | #P | AVG | OBP | SLG |
|---|---|---|---|---|---|---|---|---|---|---|---|---|
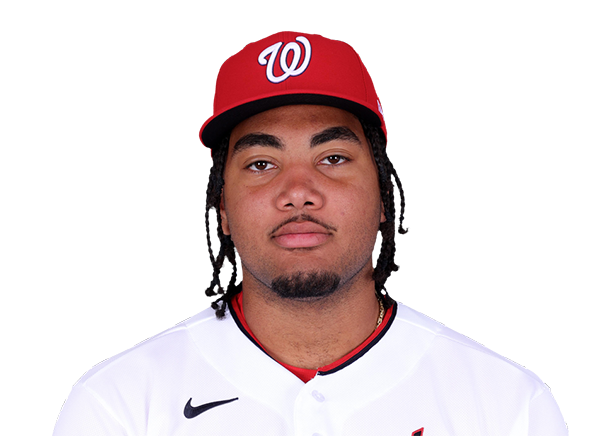 James Wood | 1-3 | 3 | 0 | 1 | 1 | 0 | 1 | 1 | 16 | .266 | .393 | .526 |
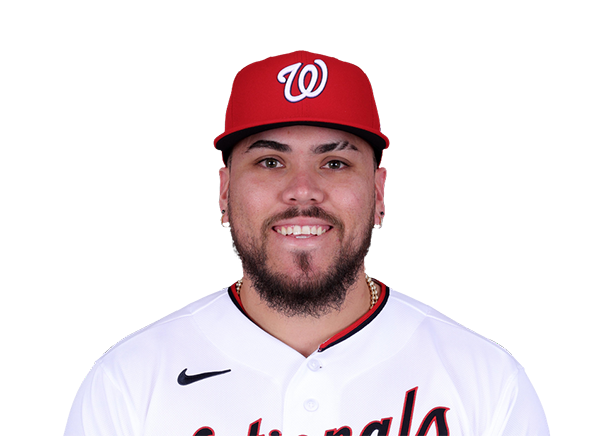 Andres Chaparro | 0-3 | 3 | 0 | 0 | 0 | 0 | 0 | 2 | 9 | .249 | .349 | .497 |
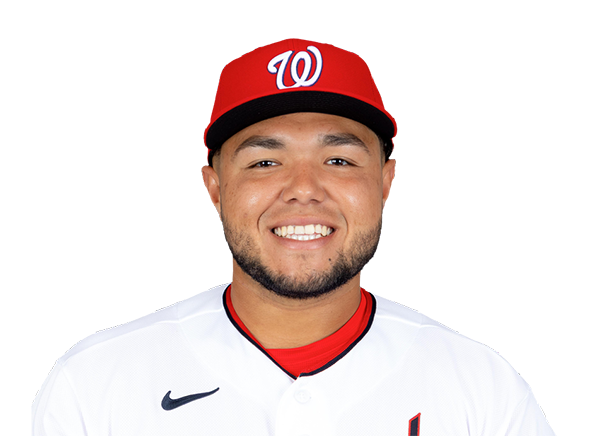 Abimelec Ortiz | 0-1 | 1 | 0 | 0 | 0 | 0 | 0 | 1 | 6 | .204 | .239 | .380 |
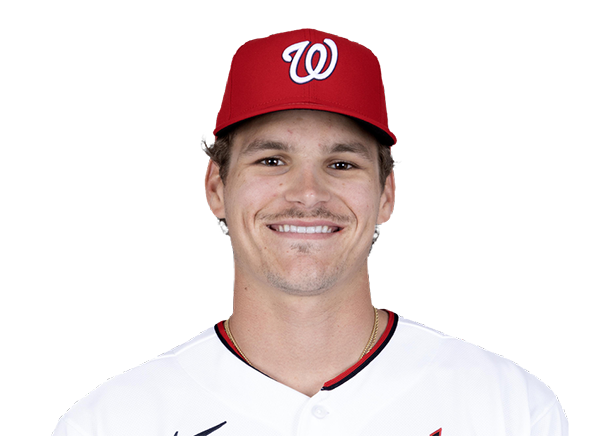 Brady House | 1-2 | 2 | 0 | 1 | 0 | 0 | 2 | 0 | 23 | .244 | .306 | .401 |
 CJ Abrams | 2-4 | 4 | 1 | 2 | 0 | 0 | 0 | 1 | 15 | .261 | .338 | .492 |
 Dylan Crews | 1-4 | 4 | 1 | 1 | 0 | 0 | 0 | 0 | 15 | .225 | .294 | .376 |
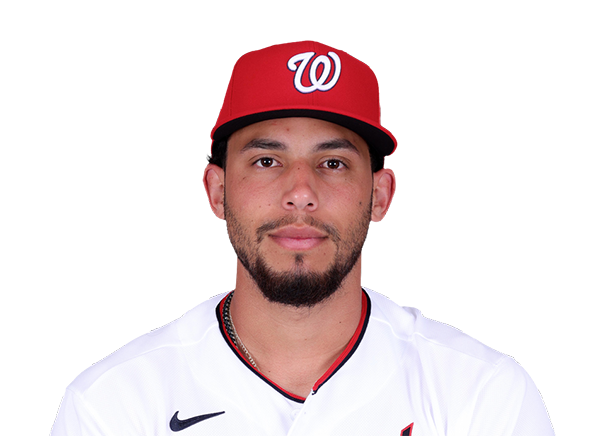 Yohandy Morales | 0-4 | 4 | 1 | 0 | 0 | 0 | 0 | 0 | 9 | .261 | .261 | .609 |
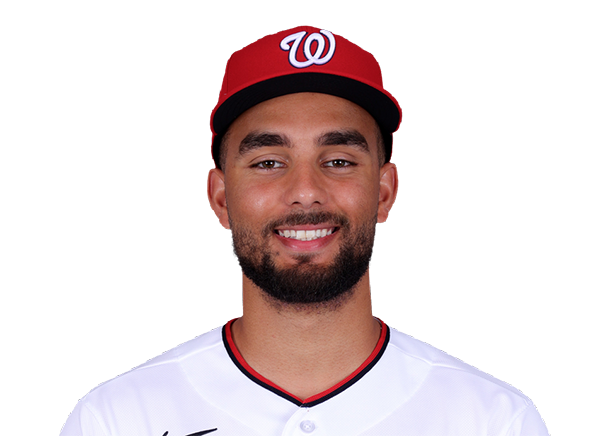 Harry Ford | 0-2 | 2 | 1 | 0 | 0 | 0 | 1 | 0 | 16 | .188 | .310 | .365 |
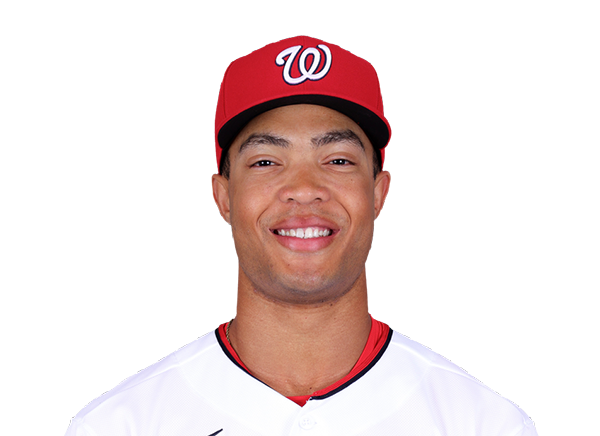 Andrew Pinckney | 0-0 | 0 | 0 | 0 | 1 | 0 | 0 | 0 | 4 | .273 | .308 | .500 |
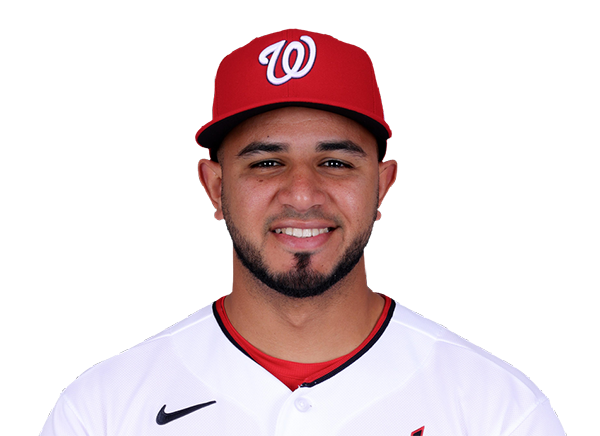 Keibert Ruiz | 0-0 | 0 | 0 | 0 | 0 | 0 | 0 | 0 | 0 | .283 | .320 | .457 |
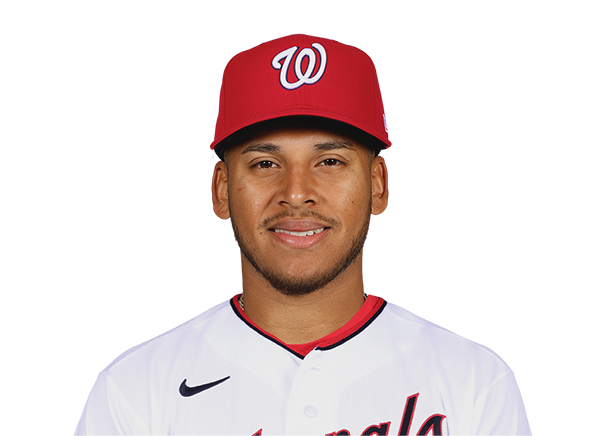 Jorbit Vivas | 1-3 | 3 | 0 | 1 | 2 | 0 | 1 | 1 | 20 | .241 | .336 | .331 |
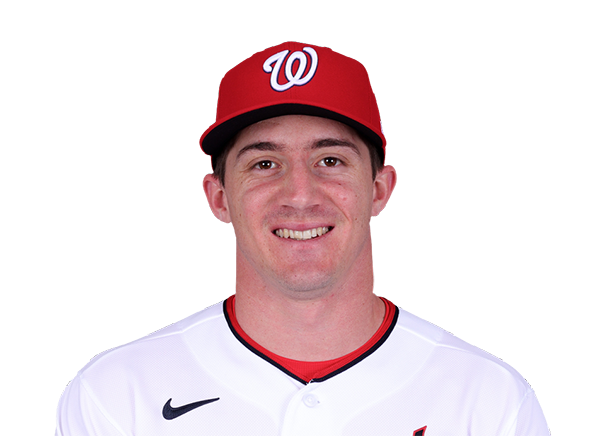 Jacob Young | 0-2 | 2 | 0 | 0 | 0 | 0 | 0 | 2 | 13 | .248 | .316 | .389 |
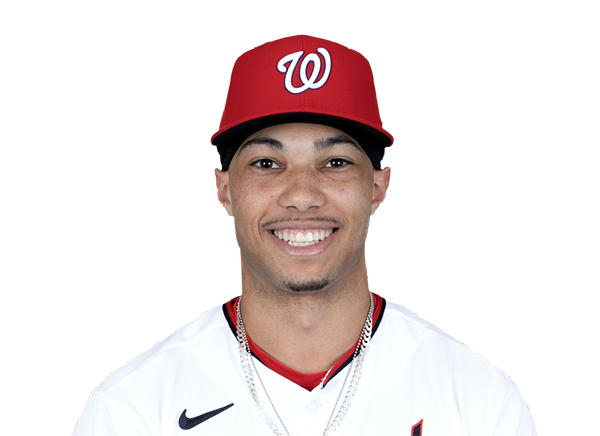 Daylen Lile | 0-2 | 2 | 0 | 0 | 0 | 0 | 0 | 1 | 7 | .248 | .301 | .430 |
Los Angeles Angels
| Player | IP | H | R | ER | BB | K | HR | PC-ST | ERA | PC |
|---|---|---|---|---|---|---|---|---|---|---|
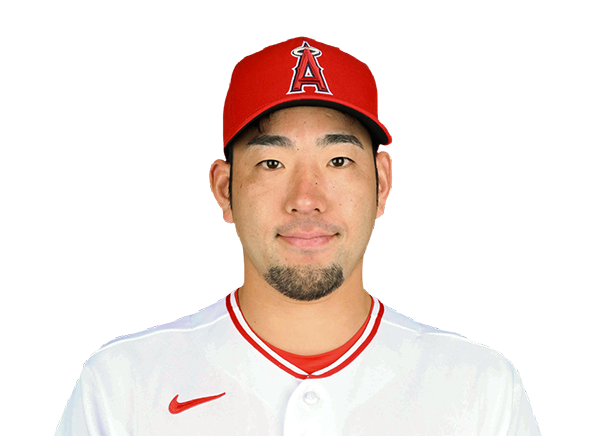 Yusei Kikuchi | 4.0 | 3 | 1 | 1 | 4 | 5 | 0 | 88-54 | 4.75 | 88 |
 Luke Murphy | 1.0 | 0 | 0 | 0 | 0 | 0 | 0 | 8-5 | 4.20 | 8 |
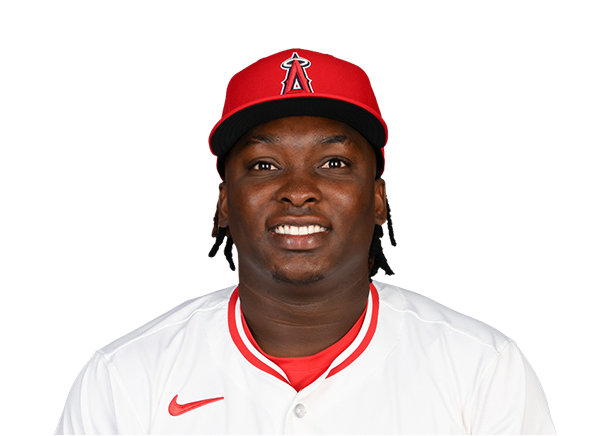 Jose Fermin | 1.0 | 0 | 0 | 0 | 0 | 1 | 0 | 15-9 | 3.20 | 15 |
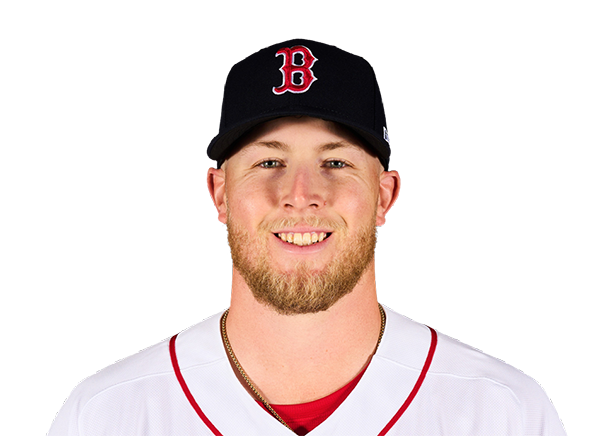 Ryan Watson | 1.0 | 0 | 0 | 0 | 0 | 2 | 0 | 13-8 | 4.12 | 13 |
 Samy Natera Jr. | 1.0 | 3 | 3 | 3 | 1 | 1 | 0 | 29-18 | 3.13 | 29 |
Washington Nationals
| Player | IP | H | R | ER | BB | K | HR | PC-ST | ERA | PC |
|---|---|---|---|---|---|---|---|---|---|---|
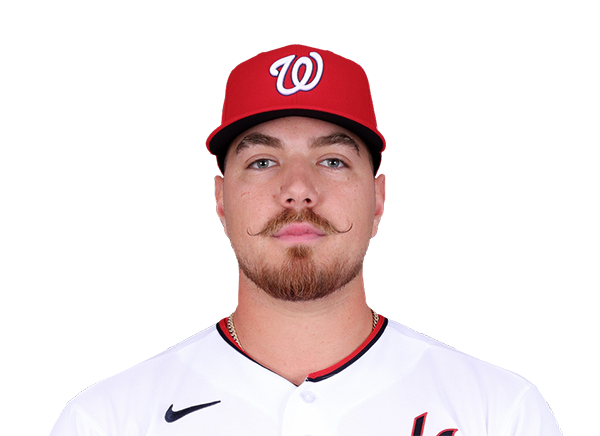 Cade Cavalli | 6.0 | 3 | 2 | 2 | 2 | 9 | 1 | 96-60 | 3.12 | 96 |
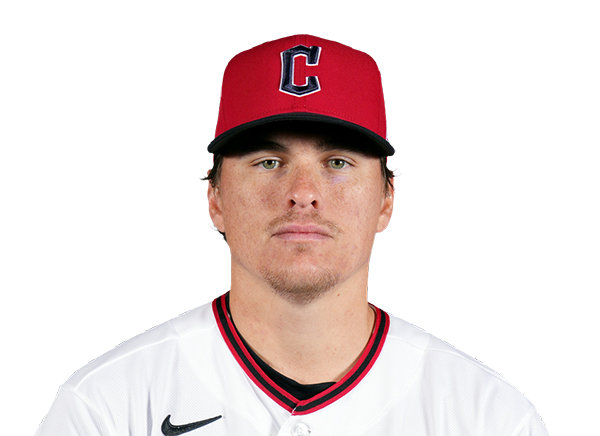 Will Dion | 1.0 | 0 | 0 | 0 | 0 | 1 | 0 | 8-5 | 3.79 | 8 |
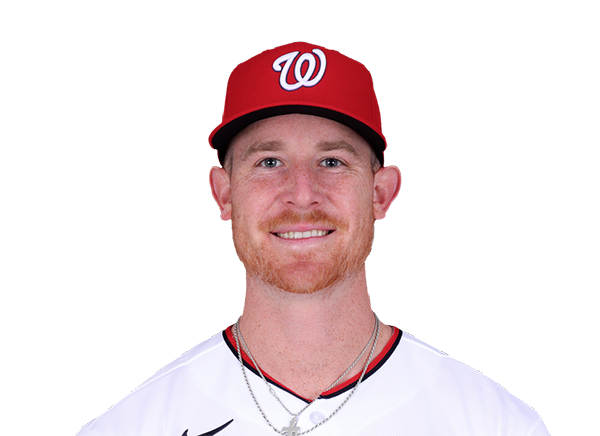 Clayton Beeter | 1.0 | 0 | 0 | 0 | 0 | 1 | 0 | 13-8 | 4.50 | 13 |
 Erik Tolman | 1.0 | 1 | 1 | 1 | 1 | 0 | 0 | 25-15 | 2.89 | 25 |
H2H / Season Series
WSH4–3
LAA
Last 5 Games
| Date | Opponent | Result |
|---|---|---|
| Sep 11 | @ WSH | L3–4 |
| Sep 9 |  @ BOS | W6–4 |
| Sep 8 | @ BOS | W6–1 |
| Sep 7 | @ BOS | L2–5 |
| Sep 6 |  @ PIT | L0–1 |
| Date | Opponent | Result |
|---|---|---|
| Sep 11 | vs LAA | W4–3 |
| Sep 9 |  @ SD | L2–9 |
| Sep 8 | @ SD | L4–5 |
| Sep 7 | @ SD | L2–3 |
| Sep 6 |  @ LAD | L5–7 |
Standings
American League
| Team | W | L | PCT | GB | DIFF | STRK |
|---|---|---|---|---|---|---|
1 Rays | 88 | 59 | .599 | - | +58 | W1 |
2 White Sox | 75 | 72 | .510 | 13 | +35 | L4 |
3 Astros | 75 | 73 | .507 | 13.5 | -42 | L1 |
4 Yankees | 85 | 62 | .578 | 3 | +133 | W4 |
| 5Red Sox | 80 | 68 | .541 | 8.5 | +81 | L3 |
6 Guardians | 75 | 73 | .507 | 13.5 | -13 | W1 |
7 Blue Jays | 73 | 75 | .493 | 15.5 | -42 | L2 |
8 Rangers | 72 | 76 | .486 | 16.5 | -49 | L3 |
9 Orioles | 72 | 76 | .486 | 16.5 | -24 | W2 |
10 Twins | 69 | 78 | .469 | 19 | -56 | L2 |
11 Mariners | 69 | 79 | .466 | 19.5 | -75 | L1 |
12 Tigers | 68 | 79 | .463 | 20 | +59 | W2 |
13 Royals | 66 | 82 | .446 | 22.5 | -87 | W2 |
14 Athletics | 60 | 88 | .405 | 28.5 | -186 | W2 |
| 15Angels | 56 | 91 | .381 | 32 | -74 | L1 |
National League
| Team | W | L | PCT | GB | DIFF | STRK |
|---|---|---|---|---|---|---|
1 Brewers | 92 | 56 | .622 | - | +192 | W4 |
| 2Dodgers | 90 | 57 | .612 | 1.5 | +173 | W8 |
3 Braves | 87 | 61 | .588 | 5 | +111 | W2 |
4 Cubs | 82 | 66 | .554 | 10 | +138 | W1 |
5 Phillies | 82 | 66 | .554 | 10 | +36 | L2 |
| 6Padres | 79 | 68 | .537 | 12.5 | +19 | W5 |
7 Diamondbacks | 79 | 69 | .534 | 13 | +7 | W1 |
| 8Pirates | 74 | 74 | .500 | 18 | +26 | L1 |
9 Cardinals | 73 | 75 | .493 | 19 | -8 | W1 |
10 Marlins | 72 | 76 | .486 | 20 | +3 | L4 |
11 Reds | 69 | 78 | .469 | 22.5 | -142 | L4 |
12 Mets | 68 | 79 | .463 | 23.5 | -42 | L1 |
| 13Nationals | 68 | 81 | .456 | 24.5 | +1 | W1 |
14 Giants | 62 | 86 | .419 | 30 | -74 | L1 |
15 Rockies | 55 | 92 | .374 | 36.5 | -158 | L5 |
LAA
VS
WSH
Pitchers
Yusei Kikuchi
Catchers
Moises Ballesteros
Infielders
Zach Neto
Vaughn Grissom
Christian Moore
Denzer Guzman
Outfielders
Mike Trout
Wade Meckler
Josh Lowe
Designated Hitters
Adam Frazier
Pitchers
Cade Cavalli
Catchers
Harry Ford
Infielders
Brady House
CJ Abrams
Yohandy Morales
Jorbit Vivas
Outfielders
James Wood
Dylan Crews
Jacob Young
Designated Hitters
Andres Chaparro
Angels
VS
Nationals
Batting
147
Team Games Played
149
4908
At Bats
5075
1152
Hits
1252
568
Runs Batted In
720
142
Home Runs
198
80
Stolen Bases
160
.235
Batting Average
.247
594
Runs
760
222
Doubles
260
13
Triples
29
1826
Total Bases
2164
448
Walks
518
1393
Strikeouts
1249
.309
On Base Percentage
.323
.372
Slugging Percentage
.426
.681
OBP Pct + SLG Pct
.749
147
Games Played
149
147
Games Started
149
90
Hit By Pitch
66
0.0
Wins Above Replacement
0.0
0.0
Offensive Wins Above Replacement
0.0
24
Caught Stealing
36
1
Is Qualified
1
566.8
Runs Created
724.3
3.9
Runs Created Per 27 Outs
4.9
.081
Walks Per Plate Appearance
.091
0.32
Walk To Strikeout Ratio
0.41
.137
Isolated Power
.180
.240
Secondary Average
.306
3.92
Pitches Per Plate Appearance
3.82
377
Extra Base Hits
487
5503
Plate Appearances
5714
34.6
At Bats Per Home Run
25.6
27
Sacrifice Hit
18
27
Sacrifice Flies
34
Pitching
147
Team Games Played
149
50
Quality Starts
34
56
Wins
68
91
Losses
81
22
Saves
35
83
Holds
73
1142
Hits
1294
605
Earned runs
695
152
Home Runs
200
592
Walks
543
1313
Strikeouts
1162
9.1
Strikeouts Per 9 Innings
7.9
152.2
Pitches Per Start
150.8
1.34
Walks Plus Hits Per Inning Pitched
1.39
4.20
Earned Run Average
4.74
91
Losses
81
1297.0
Innings pitched
1319.0
.381
Win Percentage
.456
48
Save Opportunities
73
.235
Opponent Batting Average
.256
.324
Opponent's On-base pct.
.334
.377
Opponent's Slugging pct.
.425
.701
Opponent's OPB Pct + SLG Pct
.759
4867
At Bats
5062
202
Doubles
232
17
Triples
12
72
Batters Hit
78
100
Stolen Bases
110
147
Games Played
149
1
Complete Games
0
11
Shutouts
5
58
Wild Pitches
55
635
Runs Batted In
729
3
Balks
1
1297.0
Innings pitched
1319.0
9.1
Strikeouts Per 9 Innings
7.9
29
Caught Stealing
32
147
Games Started
149
0.0
Wins Above Replacement
0.0
1
Is Qualified
1
668
Runs
759
605
Earned Runs
695
1834
Total Bases
2150
Fielding
147
Team Games Played
149
1297
Full Innings
1319
5195
Total Chances
5398
3891
Putouts
3957
1224
Assists
1345
80
Errors
96
222
Double Plays
260
0.985
Fielding Percentage
0.982
35.5
Range Factor
36.2
0.0
Zone Rating
0.0
147
Games Played
149
0
Games Started
0
0.0
Defensive Wins Above Replacement
0.0
1
Qualified
1