

Angels vs Nationals Live Score (12 Sep, 2026)
Game Information
Stage
STD
Season
2026
First Pitch
Sat, Sep 12, 4:05 pm
Venue
Nationals Park
Location
Washington, District of Columbia
Venue Type
Outdoor
Broadcast
MLB.TV
Attendance
25,713
Inning Scores
Live Situation
2Balls
1Strikes
0Outs
—Pitcher
—At Bat
Pitch Sequence
1
BALL
Slider
89 MPH
2
STRIKE LOOKING
Slider
89 MPH
3
BALL
Sinker
96 MPH
4
BALL IN PLAY
Slider
91 MPH
Injury Report
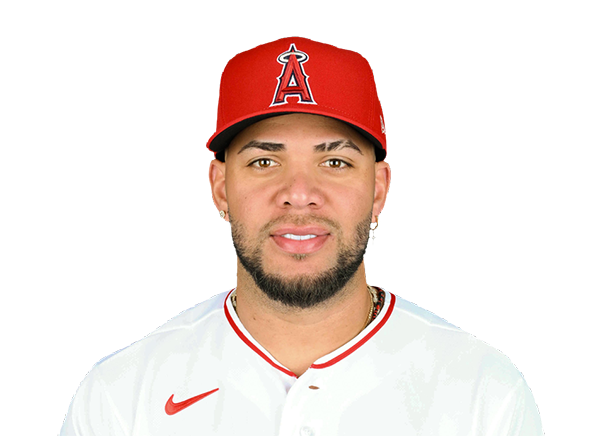
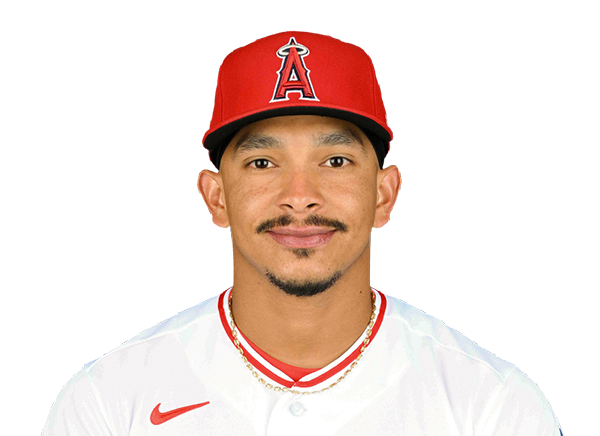



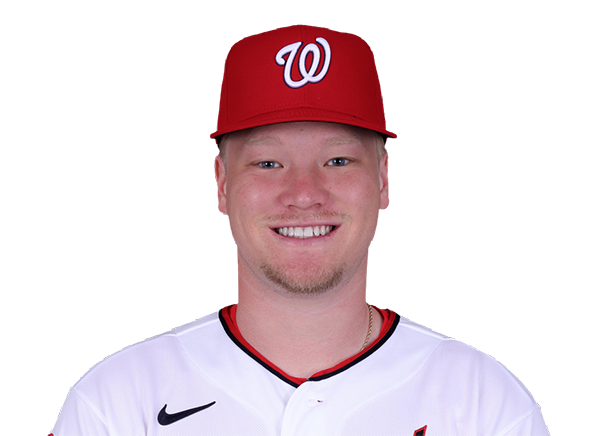
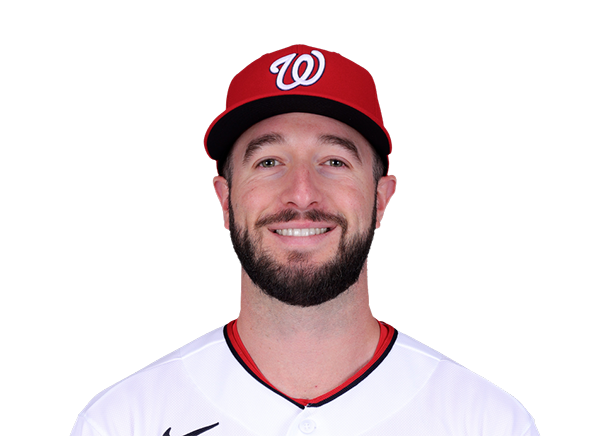
Team Stats
 LAA
WSH

5
Runs
6
4
Hits
11
2
Errors
1
1
Home Runs
0
7
Walks
4
10
Strikeouts
9
Player Box Score
Los Angeles Angels
| Player | H-AB | AB | R | H | RBI | HR | BB | K | #P | AVG | OBP | SLG |
|---|---|---|---|---|---|---|---|---|---|---|---|---|
 Zach Neto |
0-5 | 5 | 0 | 0 | 0 | 0 | 0 | 1 | 13 | .240 | .319 | .436 |
 Mike Trout |
0-3 | 3 | 1 | 0 | 0 | 0 | 2 | 2 | 25 | .243 | .376 | .428 |
 Jose Siri |
1-2 | 2 | 0 | 1 | 0 | 0 | 1 | 0 | 12 | .226 | .285 | .400 |
 Wade Meckler |
1-2 | 2 | 1 | 1 | 1 | 0 | 0 | 0 | 5 | .296 | .370 | .389 |
 Vaughn Grissom |
1-5 | 5 | 1 | 1 | 2 | 1 | 0 | 3 | 20 | .242 | .306 | .387 |
 Christian Moore |
0-4 | 4 | 0 | 0 | 0 | 0 | 1 | 0 | 17 | .187 | .250 | .275 |
 Oswald Peraza |
0-3 | 3 | 1 | 0 | 0 | 0 | 1 | 1 | 17 | .223 | .282 | .336 |
 Denzer Guzman |
1-3 | 3 | 1 | 1 | 1 | 0 | 1 | 0 | 15 | .225 | .269 | .355 |
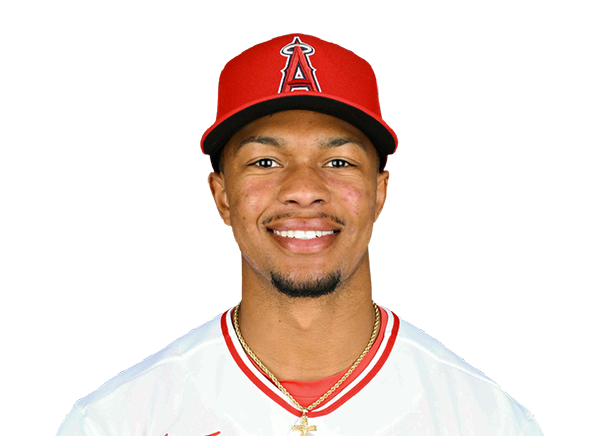 Kyren Paris |
0-3 | 3 | 0 | 0 | 0 | 0 | 1 | 2 | 19 | .000 | .188 | .000 |
 Josh Lowe |
0-0 | 0 | 0 | 0 | 0 | 0 | 0 | 0 | 0 | .205 | .275 | .352 |
 Tyler Heineman |
0-2 | 2 | 0 | 0 | 0 | 0 | 0 | 0 | 5 | .177 | .224 | .226 |
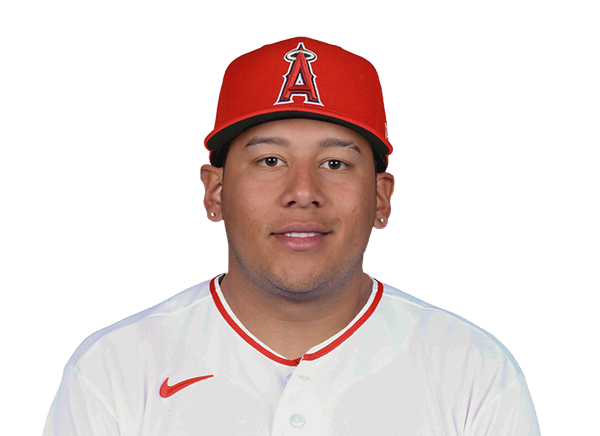 Moises Ballesteros |
0-1 | 1 | 0 | 0 | 1 | 0 | 0 | 1 | 9 | .217 | .280 | .341 |
Washington Nationals
| Player | H-AB | AB | R | H | RBI | HR | BB | K | #P | AVG | OBP | SLG |
|---|---|---|---|---|---|---|---|---|---|---|---|---|
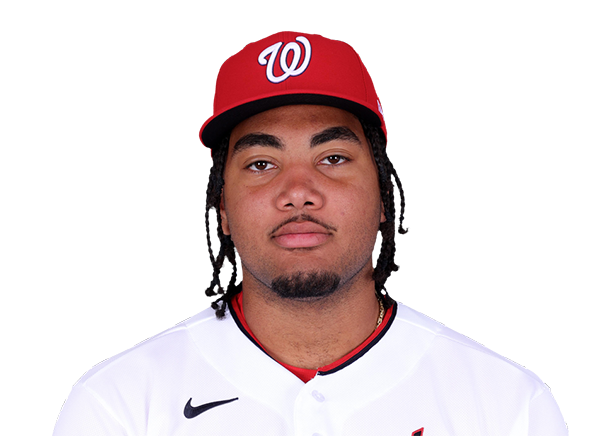 James Wood |
1-4 | 4 | 1 | 1 | 0 | 0 | 1 | 3 | 29 | .266 | .393 | .523 |
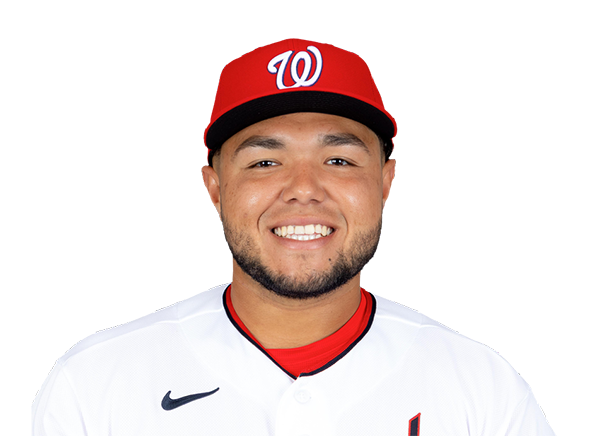 Abimelec Ortiz |
2-2 | 2 | 1 | 2 | 2 | 0 | 1 | 0 | 8 | .218 | .259 | .400 |
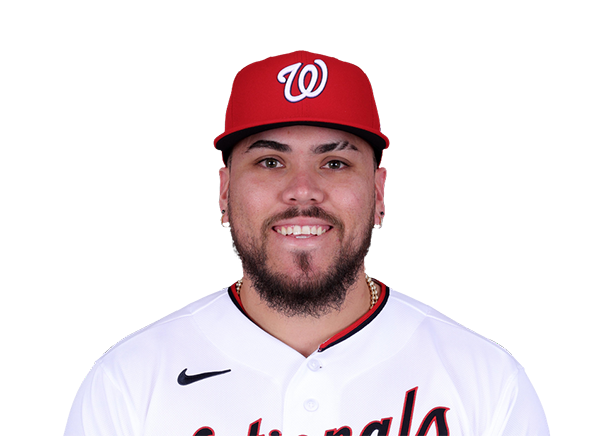 Andres Chaparro |
1-2 | 2 | 0 | 1 | 1 | 0 | 0 | 0 | 3 | .251 | .350 | .497 |
 Dylan Crews |
0-5 | 5 | 0 | 0 | 0 | 0 | 0 | 1 | 15 | .222 | .290 | .371 |
 CJ Abrams |
2-5 | 5 | 1 | 2 | 1 | 0 | 0 | 0 | 17 | .262 | .338 | .493 |
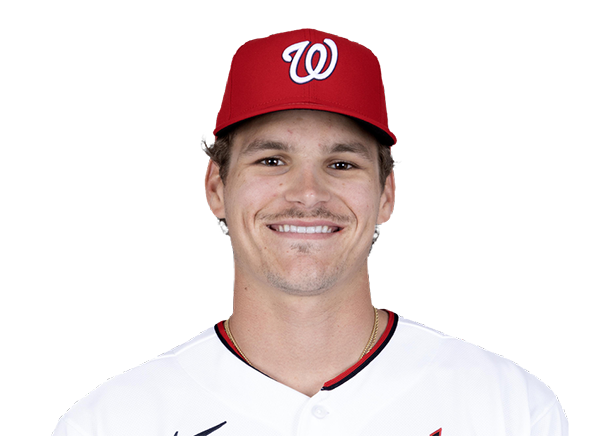 Brady House |
0-5 | 5 | 0 | 0 | 0 | 0 | 0 | 0 | 7 | .240 | .301 | .394 |
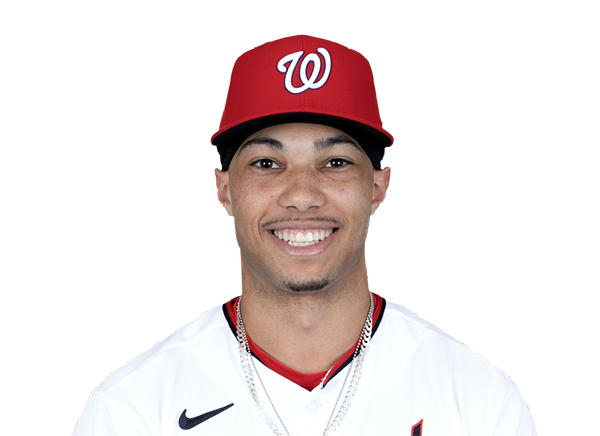 Daylen Lile |
0-4 | 4 | 0 | 0 | 0 | 0 | 1 | 1 | 14 | .246 | .300 | .427 |
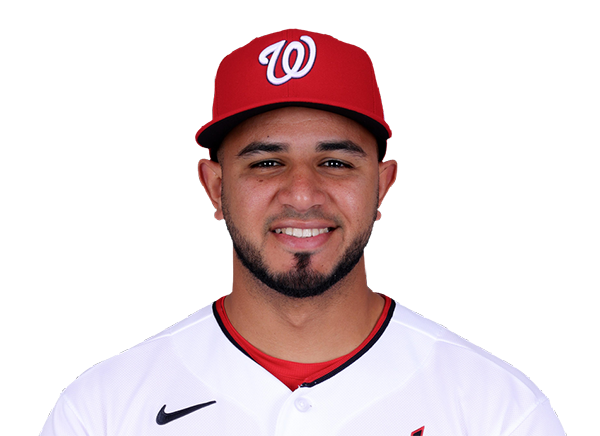 Keibert Ruiz |
3-4 | 4 | 1 | 3 | 0 | 0 | 0 | 0 | 13 | .289 | .325 | .464 |
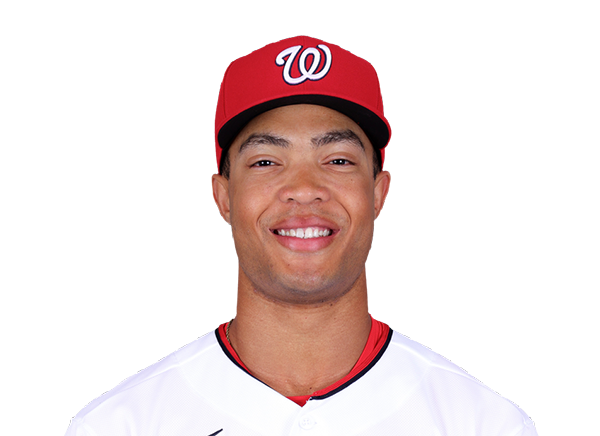 Andrew Pinckney |
0-0 | 0 | 0 | 0 | 0 | 0 | 0 | 0 | 0 | .273 | .308 | .500 |
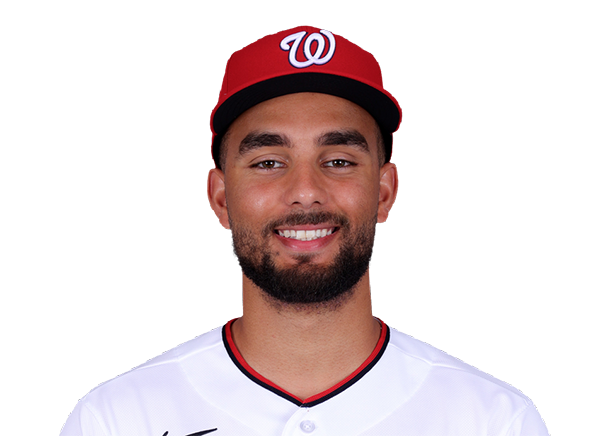 Harry Ford |
0-1 | 1 | 0 | 0 | 0 | 0 | 0 | 0 | 4 | .186 | .307 | .360 |
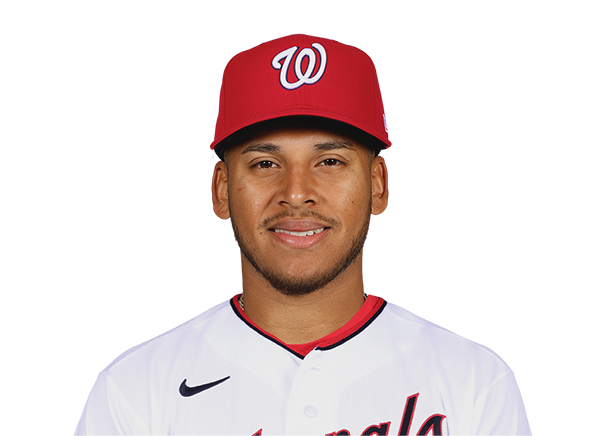 Jorbit Vivas |
1-4 | 4 | 0 | 1 | 0 | 0 | 0 | 3 | 19 | .241 | .335 | .333 |
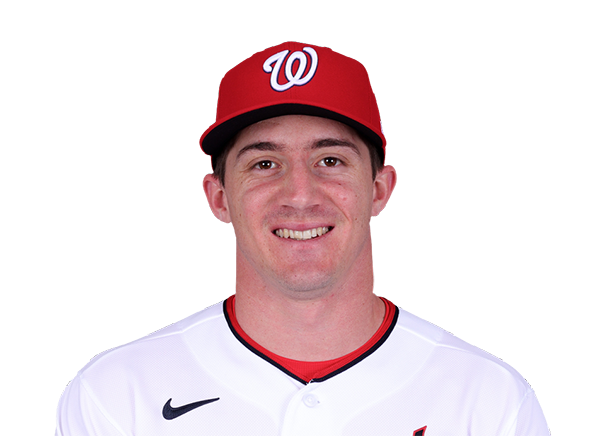 Jacob Young |
1-3 | 3 | 1 | 1 | 1 | 0 | 0 | 1 | 13 | .249 | .317 | .388 |
 Jose Tena |
0-0 | 0 | 1 | 0 | 0 | 0 | 1 | 0 | 7 | .227 | .309 | .377 |
Los Angeles Angels
| Player | IP | H | R | ER | BB | K | HR | PC-ST | ERA | PC |
|---|---|---|---|---|---|---|---|---|---|---|
 Walbert Urena |
6.0 | 9 | 4 | 4 | 2 | 7 | 0 | 101-65 | 2.88 | 101 |
 Blake Weiman |
2.0 | 1 | 0 | 0 | 0 | 1 | 0 | 20-15 | 2.03 | 20 |
 Ben Joyce |
1.0 | 1 | 1 | 1 | 1 | 1 | 0 | 23-13 | 3.65 | 23 |
 Jose Fermin |
0.1 | 0 | 1 | 0 | 1 | 0 | 0 | 5-3 | 3.18 | 5 |
Washington Nationals
| Player | IP | H | R | ER | BB | K | HR | PC-ST | ERA | PC |
|---|---|---|---|---|---|---|---|---|---|---|
 Andrew Alvarez |
7.0 | 1 | 0 | 0 | 4 | 8 | 0 | 97-61 | 3.35 | 97 |
 Brad Lord |
1.0 | 2 | 3 | 3 | 1 | 1 | 1 | 21-14 | 4.06 | 21 |
 Will Dion |
0.2 | 1 | 2 | 2 | 1 | 0 | 0 | 18-12 | 4.17 | 18 |
 Jack Sinclair |
1.1 | 0 | 0 | 0 | 1 | 1 | 0 | 21-13 | 0.00 | 21 |
H2H / Season Series
WSH6–5
LAA
WSH4–3
LAA
Last 5 Games
| Date | Opponent | Result |
|---|---|---|
| Sep 12 | @ WSH | L5–6 |
| Sep 11 | @ WSH | L3–4 |
| Sep 9 |  @ BOS | W6–4 |
| Sep 8 | @ BOS | W6–1 |
| Sep 7 | @ BOS | L2–5 |
| Date | Opponent | Result |
|---|---|---|
| Sep 12 | vs LAA | W6–5 |
| Sep 11 | vs LAA | W4–3 |
| Sep 9 |  @ SD | L2–9 |
| Sep 8 | @ SD | L4–5 |
| Sep 7 | @ SD | L2–3 |
Standings
American League
| Team | W | L | PCT | GB | DIFF | STRK |
|---|---|---|---|---|---|---|
1 Rays | 89 | 59 | .601 | - | +59 | W2 |
2 White Sox | 76 | 72 | .514 | 13 | +36 | W1 |
3 Astros | 75 | 74 | .503 | 14.5 | -43 | L2 |
4 Yankees | 85 | 63 | .574 | 4 | +123 | L1 |
| 5Red Sox | 81 | 68 | .544 | 8.5 | +85 | W1 |
6 Guardians | 75 | 74 | .503 | 14.5 | -14 | L1 |
7 Blue Jays | 74 | 75 | .497 | 15.5 | -38 | W1 |
8 Rangers | 73 | 76 | .490 | 16.5 | -45 | W1 |
9 Orioles | 72 | 77 | .483 | 17.5 | -28 | L1 |
10 Twins | 70 | 78 | .473 | 19 | -55 | W1 |
11 Mariners | 70 | 79 | .470 | 19.5 | -57 | W1 |
12 Tigers | 69 | 79 | .466 | 20 | +63 | W3 |
13 Royals | 66 | 83 | .443 | 23.5 | -91 | L1 |
14 Athletics | 60 | 89 | .403 | 29.5 | -204 | L1 |
| 15Angels | 56 | 92 | .378 | 33 | -75 | L2 |
National League
| Team | W | L | PCT | GB | DIFF | STRK |
|---|---|---|---|---|---|---|
1 Brewers | 93 | 56 | .624 | - | +196 | W5 |
2 Dodgers | 90 | 58 | .608 | 2.5 | +172 | L1 |
3 Braves | 88 | 61 | .591 | 5 | +121 | W3 |
4 Cubs | 83 | 66 | .557 | 10 | +139 | W2 |
5 Phillies | 82 | 67 | .550 | 11 | +26 | L3 |
| 6Padres | 80 | 68 | .541 | 12.5 | +20 | W6 |
7 Diamondbacks | 79 | 70 | .530 | 14 | +3 | L1 |
8 Pirates | 74 | 75 | .497 | 19 | +25 | L2 |
9 Marlins | 73 | 76 | .490 | 20 | +4 | W1 |
10 Cardinals | 73 | 76 | .490 | 20 | -9 | L1 |
11 Reds | 69 | 79 | .466 | 23.5 | -146 | L5 |
12 Mets | 69 | 79 | .466 | 23.5 | -32 | W1 |
| 13Nationals | 69 | 81 | .460 | 24.5 | +2 | W2 |
14 Giants | 62 | 87 | .416 | 31 | -75 | L2 |
15 Rockies | 55 | 93 | .372 | 37.5 | -162 | L6 |
LAA
VS
WSH
Pitchers
Walbert Urena
Catchers
Tyler Heineman
Infielders
Zach Neto
Vaughn Grissom
Christian Moore
Denzer Guzman
Outfielders
Mike Trout
Jose Siri
Kyren Paris
Designated Hitters
Oswald Peraza
Pitchers
Andrew Alvarez
Catchers
Keibert Ruiz
Infielders
Abimelec Ortiz
CJ Abrams
Brady House
Jorbit Vivas
Outfielders
Dylan Crews
Daylen Lile
Jacob Young
Designated Hitters
James Wood
Angels
VS
Nationals
Batting
148
Team Games Played
150
4941
At Bats
5114
1156
Hits
1263
573
Runs Batted In
725
143
Home Runs
198
81
Stolen Bases
165
.234
Batting Average
.247
599
Runs
766
225
Doubles
264
13
Triples
29
1836
Total Bases
2179
455
Walks
522
1403
Strikeouts
1258
.308
On Base Percentage
.323
.372
Slugging Percentage
.426
.680
OBP Pct + SLG Pct
.749
148
Games Played
150
148
Games Started
150
90
Hit By Pitch
66
0.0
Wins Above Replacement
0.0
0.0
Offensive Wins Above Replacement
0.0
25
Caught Stealing
37
1
Is Qualified
1
569.7
Runs Created
730.4
3.9
Runs Created Per 27 Outs
4.9
.082
Walks Per Plate Appearance
.091
0.32
Walk To Strikeout Ratio
0.41
.138
Isolated Power
.179
.241
Secondary Average
.306
3.92
Pitches Per Plate Appearance
3.82
381
Extra Base Hits
491
5544
Plate Appearances
5757
34.6
At Bats Per Home Run
25.8
27
Sacrifice Hit
18
28
Sacrifice Flies
34
Pitching
148
Team Games Played
150
50
Quality Starts
35
56
Wins
69
92
Losses
81
22
Saves
35
83
Holds
73
1153
Hits
1298
610
Earned runs
700
152
Home Runs
201
596
Walks
550
1322
Strikeouts
1172
9.1
Strikeouts Per 9 Innings
7.9
152.2
Pitches Per Start
150.8
1.34
Walks Plus Hits Per Inning Pitched
1.39
4.20
Earned Run Average
4.74
92
Losses
81
1306.1
Innings pitched
1329.0
.378
Win Percentage
.460
49
Save Opportunities
74
.235
Opponent Batting Average
.255
.324
Opponent's On-base pct.
.334
.377
Opponent's Slugging pct.
.424
.701
Opponent's OPB Pct + SLG Pct
.758
4906
At Bats
5095
206
Doubles
235
17
Triples
12
72
Batters Hit
78
105
Stolen Bases
111
148
Games Played
150
1
Complete Games
0
11
Shutouts
5
58
Wild Pitches
56
640
Runs Batted In
734
4
Balks
1
1306.1
Innings pitched
1329.0
9.1
Strikeouts Per 9 Innings
7.9
30
Caught Stealing
33
148
Games Started
150
0.0
Wins Above Replacement
0.0
1
Is Qualified
1
674
Runs
764
610
Earned Runs
700
1849
Total Bases
2160
Fielding
148
Team Games Played
150
1306
Full Innings
1329
5233
Total Chances
5443
3919
Putouts
3987
1232
Assists
1359
82
Errors
97
225
Double Plays
264
0.984
Fielding Percentage
0.982
35.5
Range Factor
36.2
0.0
Zone Rating
0.0
148
Games Played
150
0
Games Started
0
0.0
Defensive Wins Above Replacement
0.0
1
Qualified
1