

Astros vs Athletics Live Score (26 Sep, 2026)
Game Information
Stage
STD
Season
2026
First Pitch
Fri, Sep 25, 9:40 pm
Venue
Sutter Health Park
Location
Sacramento, California
Venue Type
Outdoor
Broadcast
MLB.TV
Attendance
9,012
Live Situation
0Balls
2Strikes
0Outs
—Pitcher
—At Bat
Pitch Sequence
1
STRIKE LOOKING
Four-seam FB
96 MPH
2
STRIKE FOUL
Four-seam FB
95 MPH
3
BALL IN PLAY
Four-seam FB
96 MPH
Injury Report






Team Stats
 HOU
ATH


5
Runs
6
5
Hits
8
2
Errors
0
2
Home Runs
0
6
Walks
4
8
Strikeouts
7
Player Box Score
Houston Astros
| Player | H-AB | AB | R | H | RBI | HR | BB | K | #P | AVG | OBP | SLG |
|---|---|---|---|---|---|---|---|---|---|---|---|---|
 Jeremy Pena | 0-5 | 5 | 0 | 0 | 0 | 0 | 0 | 1 | 20 | .271 | .321 | .461 |
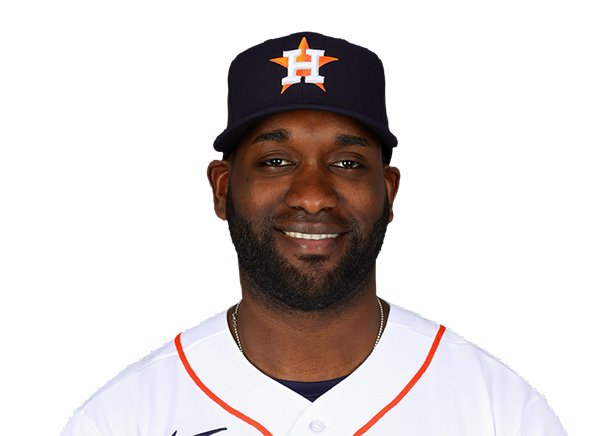 Yordan Alvarez | 1-3 | 3 | 1 | 1 | 0 | 0 | 1 | 1 | 14 | .315 | .433 | .599 |
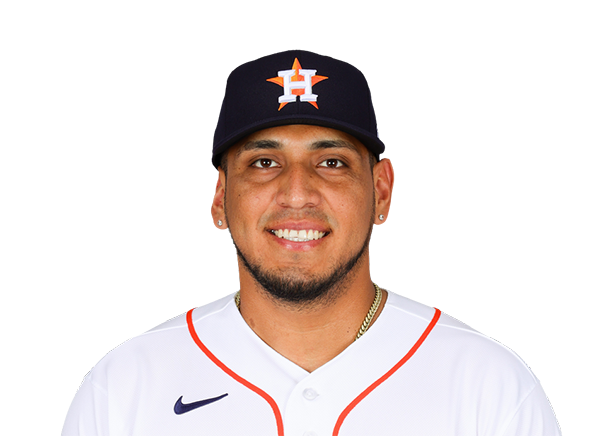 Isaac Paredes | 0-3 | 3 | 1 | 0 | 0 | 0 | 1 | 1 | 23 | .260 | .358 | .442 |
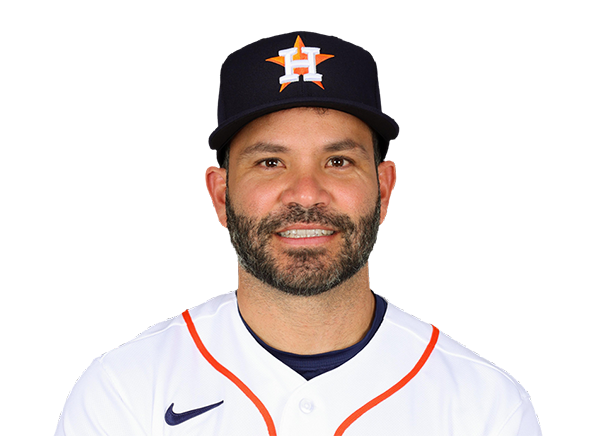 Jose Altuve | 0-3 | 3 | 0 | 0 | 1 | 0 | 0 | 0 | 12 | .249 | .304 | .396 |
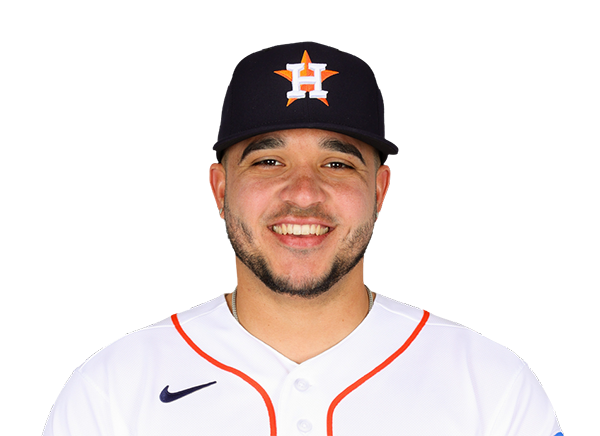 Yainer Diaz | 2-4 | 4 | 0 | 2 | 1 | 0 | 0 | 0 | 12 | .281 | .311 | .458 |
 Christian Walker | 1-3 | 3 | 1 | 1 | 1 | 1 | 1 | 0 | 12 | .223 | .296 | .420 |
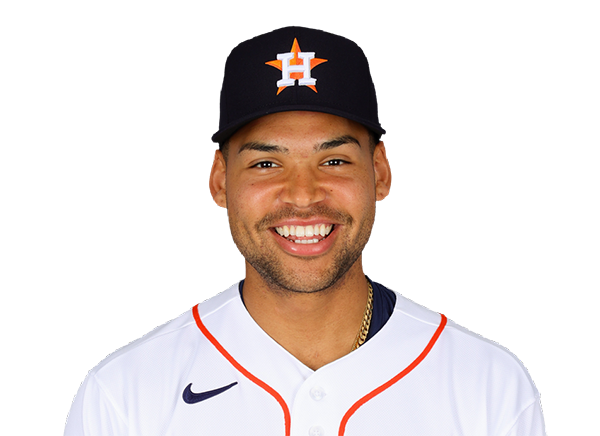 Cam Smith | 1-3 | 3 | 1 | 1 | 1 | 1 | 1 | 2 | 21 | .209 | .275 | .392 |
 Lucas Spence | 0-4 | 4 | 0 | 0 | 0 | 0 | 0 | 2 | 16 | .188 | .264 | .396 |
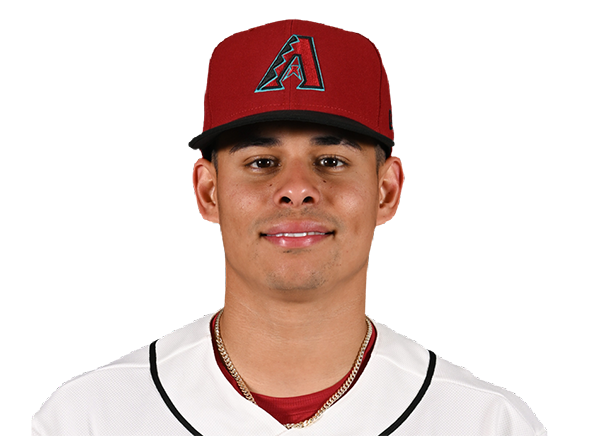 Jorge Barrosa | 0-2 | 2 | 0 | 0 | 0 | 0 | 0 | 1 | 13 | .196 | .284 | .336 |
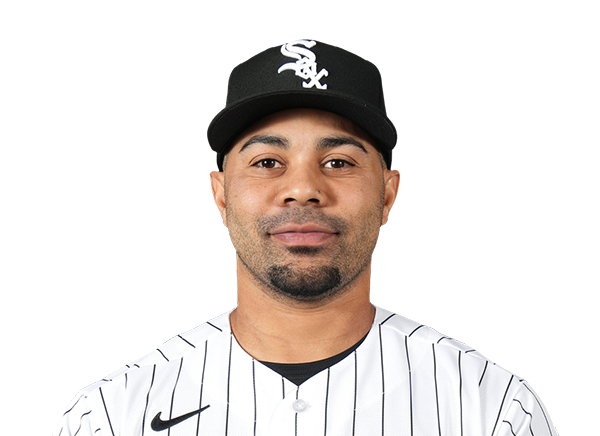 LaMonte Wade Jr. | 0-0 | 0 | 1 | 0 | 0 | 0 | 1 | 0 | 5 | .206 | .310 | .349 |
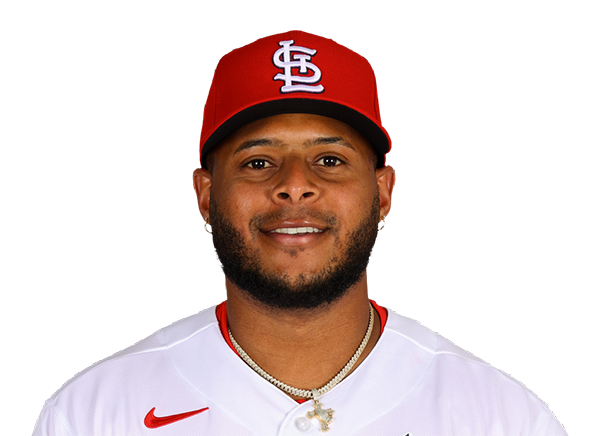 Nelson Velazquez | 0-0 | 0 | 0 | 0 | 0 | 0 | 1 | 0 | 8 | .190 | .259 | .410 |
 Taylor Trammell | 0-0 | 0 | 0 | 0 | 0 | 0 | 0 | 0 | 0 | .196 | .287 | .348 |
Athletics
| Player | H-AB | AB | R | H | RBI | HR | BB | K | #P | AVG | OBP | SLG |
|---|---|---|---|---|---|---|---|---|---|---|---|---|
 Henry Bolte | 2-5 | 5 | 1 | 2 | 2 | 0 | 0 | 0 | 14 | .277 | .359 | .407 |
 Lawrence Butler | 0-4 | 4 | 0 | 0 | 1 | 0 | 1 | 0 | 21 | .237 | .326 | .396 |
 Shea Langeliers | 0-3 | 3 | 0 | 0 | 0 | 0 | 1 | 2 | 19 | .263 | .328 | .478 |
 Jeff McNeil | 1-4 | 4 | 1 | 1 | 0 | 0 | 0 | 1 | 15 | .267 | .315 | .373 |
 Zack Gelof | 0-4 | 4 | 1 | 0 | 0 | 0 | 0 | 1 | 17 | .256 | .323 | .479 |
 Donovan Walton | 0-2 | 2 | 0 | 0 | 0 | 0 | 1 | 1 | 17 | .268 | .367 | .460 |
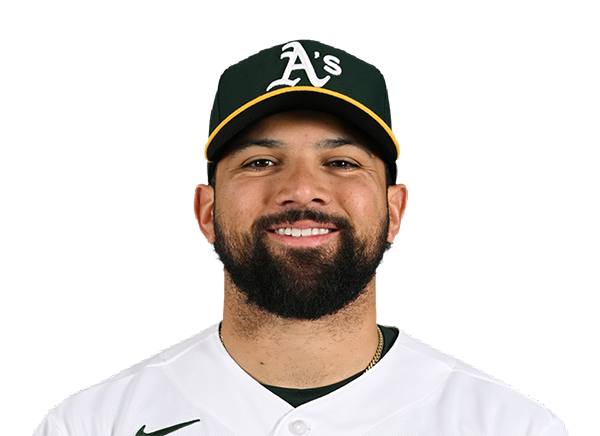 Carlos Cortes | 1-1 | 1 | 0 | 1 | 0 | 0 | 1 | 0 | 11 | .255 | .323 | .404 |
 Michael Stefanic | 1-1 | 1 | 0 | 1 | 2 | 0 | 0 | 0 | 3 | .346 | .393 | .385 |
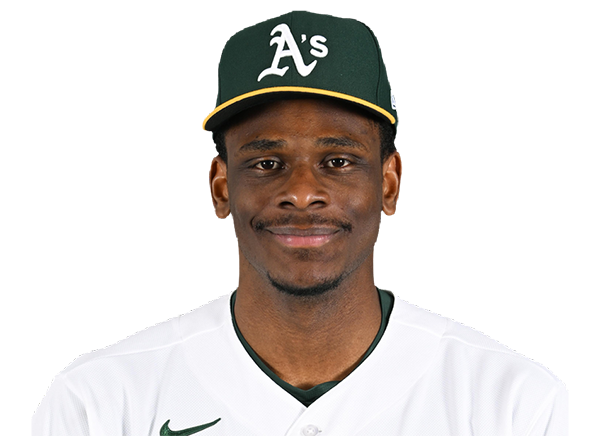 Denzel Clarke | 0-1 | 1 | 1 | 0 | 0 | 0 | 0 | 0 | 8 | .151 | .235 | .164 |
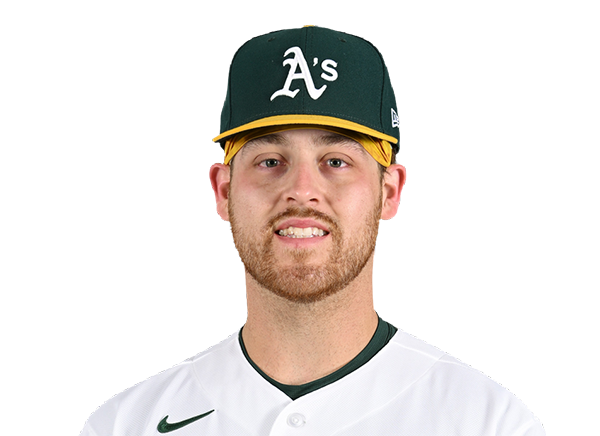 Tommy White | 1-4 | 4 | 1 | 1 | 0 | 0 | 0 | 2 | 18 | .250 | .268 | .326 |
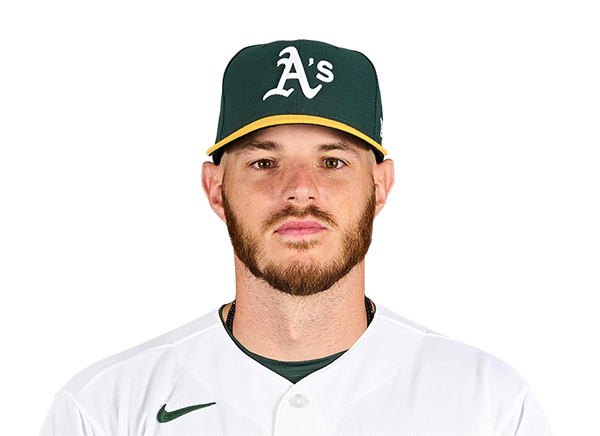 Jonah Heim | 2-4 | 4 | 1 | 2 | 1 | 0 | 0 | 0 | 15 | .206 | .264 | .369 |
Houston Astros
| Player | IP | H | R | ER | BB | K | HR | PC-ST | ERA | PC |
|---|---|---|---|---|---|---|---|---|---|---|
 Hunter Brown | 5.1 | 2 | 2 | 1 | 4 | 4 | 0 | 100-60 | 3.19 | 100 |
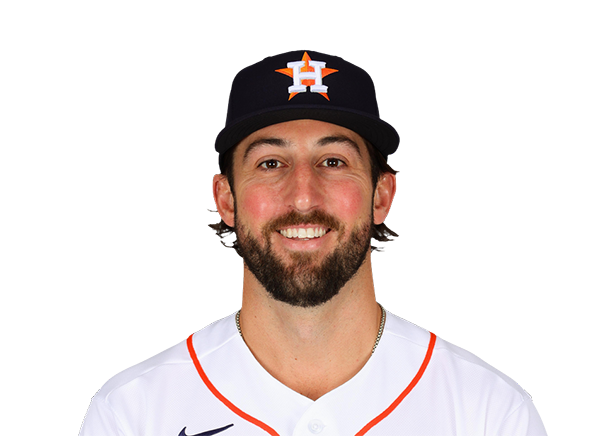 Bennett Sousa | 0.0 | 3 | 3 | 3 | 0 | 0 | 0 | 5-4 | 6.00 | 5 |
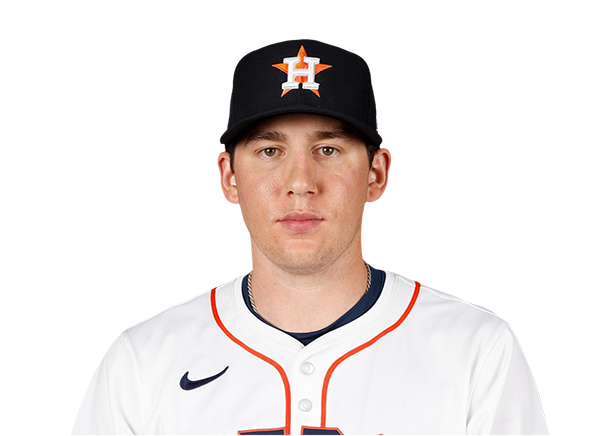 AJ Blubaugh | 0.2 | 1 | 1 | 1 | 0 | 1 | 0 | 15-11 | 3.66 | 15 |
 Logan VanWey | 1.1 | 2 | 0 | 0 | 0 | 2 | 0 | 34-22 | 1.54 | 34 |
 Joshua Hendrickson | 0.2 | 0 | 0 | 0 | 0 | 0 | 0 | 4-3 | 3.38 | 4 |
Athletics
| Player | IP | H | R | ER | BB | K | HR | PC-ST | ERA | PC |
|---|---|---|---|---|---|---|---|---|---|---|
 Jacob Lopez | 6.0 | 2 | 1 | 1 | 2 | 4 | 1 | 94-55 | 5.47 | 94 |
 Seth Johnson | 1.0 | 1 | 1 | 1 | 0 | 1 | 1 | 14-7 | 6.19 | 14 |
 Geoff Hartlieb | 0.1 | 1 | 3 | 3 | 2 | 1 | 0 | 17-7 | 4.78 | 17 |
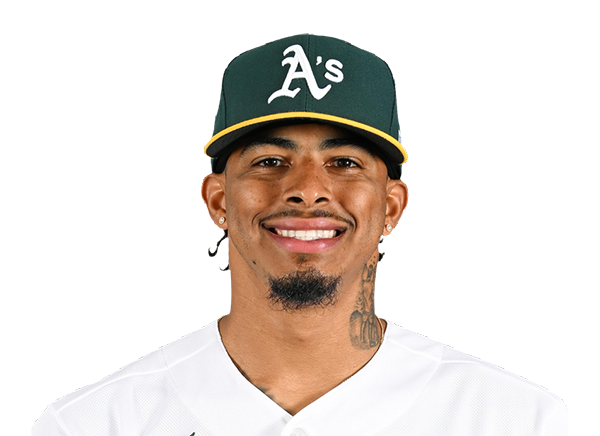 Luis Medina | 0.2 | 1 | 0 | 0 | 1 | 1 | 0 | 17-8 | 3.08 | 17 |
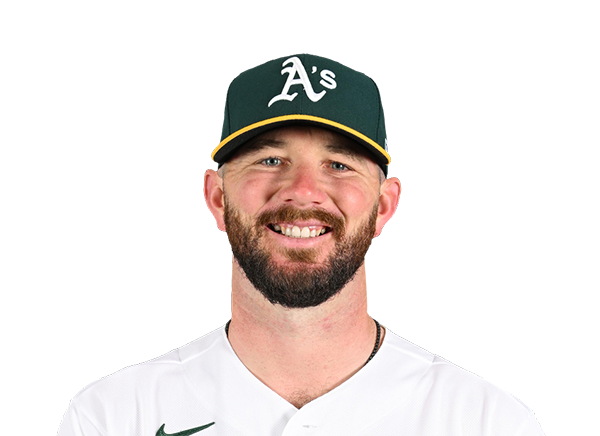 Hogan Harris | 1.0 | 0 | 0 | 0 | 1 | 1 | 0 | 14-10 | 3.33 | 14 |
H2H / Season Series
ATH6–5
HOU
ATH5–7
HOU
HOU6–7
ATH
HOU3–4
ATH
HOU4–0
ATH
HOU0–5
ATH
HOU13–2
ATH
HOU5–1
ATH
ATH12–10
HOU
ATH0–11
HOU
Last 5 Games
| Date | Opponent | Result |
|---|---|---|
| Sep 25 | @ ATH | L5–6 |
| Sep 24 | @ ATH | W7–5 |
| Sep 23 |  @ SEA | L5–6 |
| Sep 22 | @ SEA | W7–0 |
| Sep 20 |  vs ATL | L2–4 |
| Date | Opponent | Result |
|---|---|---|
| Sep 25 | vs HOU | W6–5 |
| Sep 24 | vs HOU | L5–7 |
| Sep 23 |  vs LAA | W7–3 |
| Sep 22 | vs LAA | W9–7 |
| Sep 20 |  @ CLE | L0–1 |
Standings
American League
| Team | W | L | PCT | GB | DIFF | STRK |
|---|---|---|---|---|---|---|
1 Rays | 97 | 63 | .606 | - | +79 | W1 |
| 2Guardians | 84 | 76 | .525 | 13 | +6 | W2 |
| 3Astros | 79 | 81 | .494 | 18 | -52 | L1 |
4 Yankees | 93 | 68 | .578 | 4.5 | +138 | W1 |
5 Red Sox | 87 | 74 | .540 | 10.5 | +82 | W2 |
6 White Sox | 83 | 77 | .519 | 14 | +57 | W2 |
7 Rangers | 79 | 81 | .494 | 18 | -48 | L1 |
8 Orioles | 79 | 82 | .491 | 18.5 | -21 | L1 |
9 Blue Jays | 78 | 82 | .488 | 19 | -46 | W1 |
10 Twins | 76 | 84 | .475 | 21 | -56 | W3 |
11 Tigers | 75 | 85 | .469 | 22 | +72 | W1 |
| 12Mariners | 74 | 86 | .463 | 23 | -66 | L2 |
13 Royals | 68 | 92 | .425 | 29 | -115 | L2 |
| 14Athletics | 64 | 96 | .400 | 33 | -218 | W1 |
| 15Angels | 62 | 98 | .388 | 35 | -89 | W2 |
National League
| Team | W | L | PCT | GB | DIFF | STRK |
|---|---|---|---|---|---|---|
1 Brewers | 101 | 59 | .631 | - | +211 | W3 |
2 Dodgers | 98 | 62 | .613 | 3 | +196 | W1 |
| 3Braves | 93 | 67 | .581 | 8 | +113 | L2 |
4 Padres | 89 | 71 | .556 | 12 | +33 | L1 |
5 Cubs | 88 | 73 | .547 | 13.5 | +143 | L2 |
6 Phillies | 87 | 73 | .544 | 14 | +22 | L3 |
7 Diamondbacks | 86 | 74 | .538 | 15 | +17 | W6 |
8 Pirates | 81 | 79 | .506 | 20 | +27 | L1 |
9 Marlins | 79 | 81 | .494 | 22 | +6 | W1 |
10 Cardinals | 77 | 83 | .481 | 24 | -26 | L2 |
11 Nationals | 76 | 84 | .475 | 25 | +10 | W3 |
12 Reds | 74 | 86 | .463 | 27 | -160 | L1 |
13 Mets | 73 | 87 | .456 | 28 | -36 | L2 |
14 Giants | 65 | 95 | .406 | 36 | -86 | L3 |
15 Rockies | 57 | 103 | .356 | 44 | -193 | L5 |
HOU
VS
ATH
Pitchers
Hunter Brown
Catchers
Yainer Diaz
Infielders
Jeremy Pena
Isaac Paredes
Jose Altuve
Christian Walker
Outfielders
Cam Smith
Lucas Spence
Jorge Barrosa
Designated Hitters
Yordan Alvarez
Pitchers
Jacob Lopez
Catchers
Jonah Heim
Infielders
Jeff McNeil
Zack Gelof
Donovan Walton
Tommy White
Outfielders
Henry Bolte
Lawrence Butler
Carlos Cortes
Designated Hitters
Shea Langeliers
Astros
VS
Athletics
Batting
160
Team Games Played
160
5379
At Bats
5424
1292
Hits
1334
680
Runs Batted In
668
220
Home Runs
194
49
Stolen Bases
91
.240
Batting Average
.246
712
Runs
697
233
Doubles
244
20
Triples
17
2225
Total Bases
2194
518
Walks
515
1321
Strikeouts
1358
.313
On Base Percentage
.318
.414
Slugging Percentage
.404
.727
OBP Pct + SLG Pct
.723
160
Games Played
160
160
Games Started
160
73
Hit By Pitch
70
0.0
Wins Above Replacement
0.0
0.0
Offensive Wins Above Replacement
0.0
21
Caught Stealing
32
1
Is Qualified
1
700.5
Runs Created
694.3
4.4
Runs Created Per 27 Outs
4.4
.086
Walks Per Plate Appearance
.085
0.39
Walk To Strikeout Ratio
0.38
.173
Isolated Power
.159
.275
Secondary Average
.264
3.88
Pitches Per Plate Appearance
3.82
473
Extra Base Hits
455
6029
Plate Appearances
6057
24.5
At Bats Per Home Run
28.0
18
Sacrifice Hit
21
39
Sacrifice Flies
25
Pitching
160
Team Games Played
160
43
Quality Starts
33
79
Wins
64
81
Losses
96
49
Saves
39
88
Holds
84
1265
Hits
1495
711
Earned runs
853
204
Home Runs
241
645
Walks
625
1396
Strikeouts
1334
8.9
Strikeouts Per 9 Innings
8.5
151.6
Pitches Per Start
152.7
1.35
Walks Plus Hits Per Inning Pitched
1.50
4.51
Earned Run Average
5.44
81
Losses
96
1419.0
Innings pitched
1412.0
.494
Win Percentage
.400
63
Save Opportunities
67
.238
Opponent Batting Average
.271
.329
Opponent's On-base pct.
.349
.402
Opponent's Slugging pct.
.463
.731
Opponent's OPB Pct + SLG Pct
.812
5318
At Bats
5519
214
Doubles
289
24
Triples
24
89
Batters Hit
74
126
Stolen Bases
110
160
Games Played
160
0
Complete Games
1
10
Shutouts
7
53
Wild Pitches
50
730
Runs Batted In
886
6
Balks
8
1419.0
Innings pitched
1412.0
8.9
Strikeouts Per 9 Innings
8.5
41
Caught Stealing
40
160
Games Started
160
0.0
Wins Above Replacement
0.0
1
Is Qualified
1
764
Runs
915
711
Earned Runs
853
2139
Total Bases
2555
Fielding
160
Team Games Played
160
1419
Full Innings
1412
5513
Total Chances
5525
4257
Putouts
4236
1184
Assists
1214
72
Errors
75
233
Double Plays
244
0.987
Fielding Percentage
0.986
34.5
Range Factor
34.7
0.0
Zone Rating
0.0
160
Games Played
160
0
Games Started
0
0.0
Defensive Wins Above Replacement
0.0
1
Qualified
1