

Astros vs Giants Live Score (11 Aug, 2026)
Game Information
Stage
Standard
Season
2026
First Pitch
Mon, Aug 10, 9:45 pm
Venue
Oracle Park
Location
San Francisco, California
Attendance
28,070
Home Runs
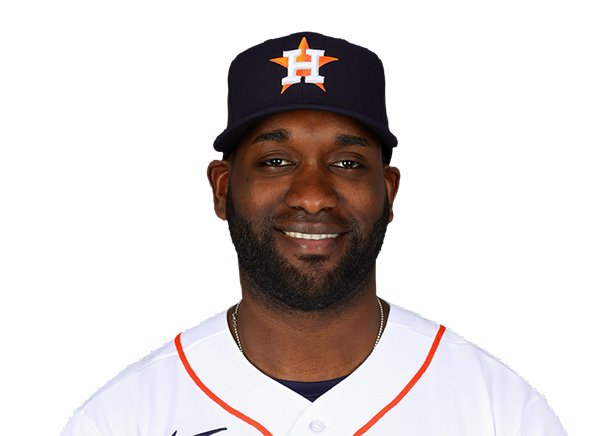
Yordan Alvarez
35 HR
.322 AVG
86 RBI
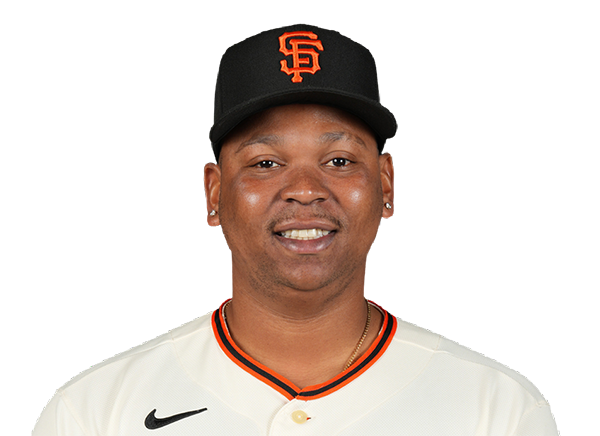
Rafael Devers
24 HR
.249 AVG
64 RBI
Batting Average
Yordan Alvarez
.322 AVG
.435 OBP
.624 SLG
Jung Hoo Lee
.298 AVG
.334 OBP
.440 SLG

Runs Batted In
Yordan Alvarez
86 RBI
35 HR
.322 AVG
Rafael Devers
64 RBI
24 HR
.249 AVG
Earned Run Average
Logan Webb
3.59 ERA
7 W
103 K

Wins
Peter Lambert
8 W
3.09 ERA
111 K
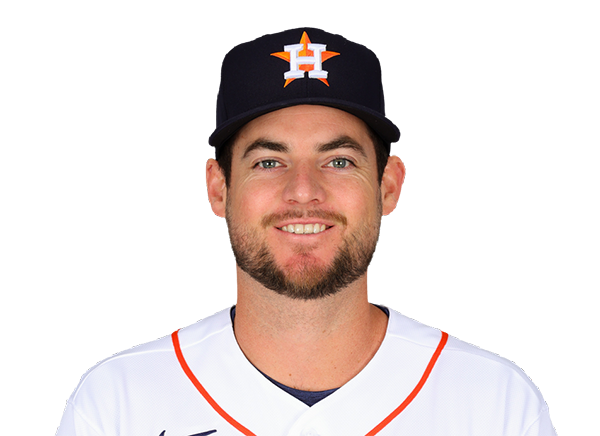
Logan Webb
7 W
3.59 ERA
103 K
Strikeouts
Peter Lambert
111 K
8 W
3.09 ERA
Landen Roupp
123 K
7 W
4.22 ERA
Injury Report

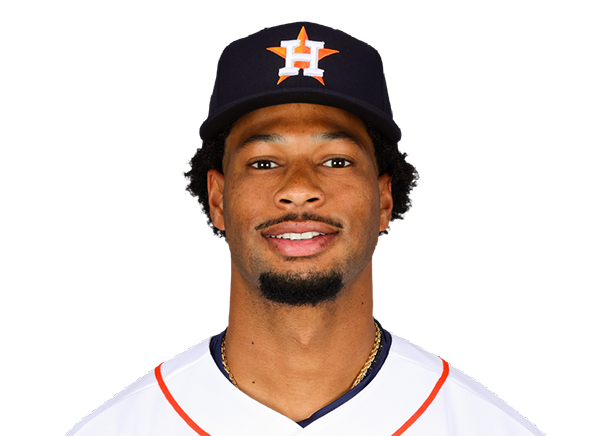
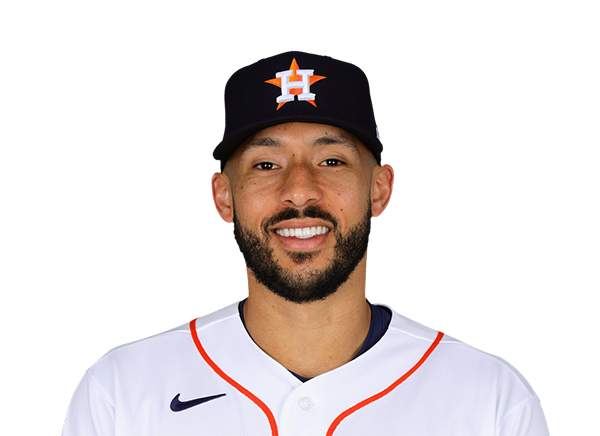

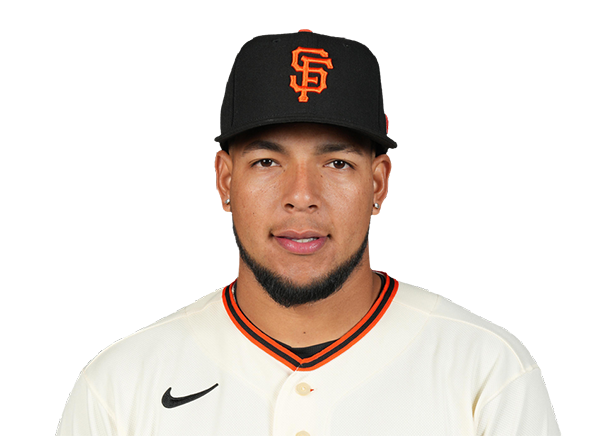
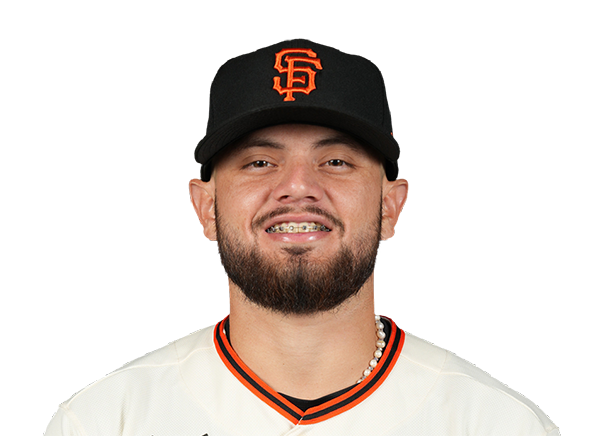
Team Stats
 HOU
SF


Array
Runs
Array
8
Hits
6
0
Errors
0
—
Home Runs
—
—
Walks
—
—
Strikeouts
—
Standings
American League
| Team | W | L | PCT | GB | DIFF | STRK |
|---|---|---|---|---|---|---|
1 Rays | 76 | 53 | .589 | - | +42 | L3 |
2 White Sox | 67 | 62 | .519 | 9 | +42 | L1 |
| 3Astros | 65 | 65 | .500 | 11.5 | -43 | L1 |
4 Yankees | 73 | 56 | .566 | 3 | +95 | L1 |
5 Red Sox | 70 | 59 | .543 | 6 | +98 | W2 |
6 Rangers | 64 | 66 | .492 | 12.5 | -48 | L1 |
7 Blue Jays | 64 | 67 | .489 | 13 | -50 | W1 |
8 Twins | 63 | 66 | .488 | 13 | -45 | L1 |
9 Guardians | 63 | 66 | .488 | 13 | -15 | W2 |
10 Orioles | 63 | 67 | .485 | 13.5 | -33 | W2 |
11 Mariners | 62 | 68 | .477 | 14.5 | -44 | W2 |
12 Tigers | 61 | 68 | .473 | 15 | +77 | L4 |
13 Royals | 57 | 74 | .435 | 20 | -95 | W7 |
14 Angels | 52 | 78 | .400 | 24.5 | -68 | W1 |
15 Athletics | 50 | 80 | .385 | 26.5 | -188 | W1 |
National League
| Team | W | L | PCT | GB | DIFF | STRK |
|---|---|---|---|---|---|---|
1 Brewers | 81 | 49 | .623 | - | +163 | W3 |
2 Dodgers | 79 | 51 | .608 | 2 | +147 | W5 |
3 Braves | 75 | 55 | .577 | 6 | +108 | L2 |
4 Cubs | 74 | 56 | .569 | 7 | +98 | L3 |
5 Phillies | 72 | 58 | .554 | 9 | +25 | W8 |
6 Padres | 69 | 60 | .535 | 11.5 | +7 | W1 |
7 Diamondbacks | 68 | 61 | .527 | 12.5 | +13 | W2 |
8 Marlins | 66 | 64 | .508 | 15 | +17 | W2 |
9 Cardinals | 66 | 65 | .504 | 15.5 | 0 | L2 |
10 Pirates | 63 | 68 | .481 | 18.5 | +29 | L2 |
11 Reds | 61 | 68 | .473 | 19.5 | -98 | L2 |
12 Nationals | 61 | 70 | .466 | 20.5 | +14 | L3 |
13 Mets | 59 | 71 | .454 | 22 | -39 | W1 |
| 14Giants | 52 | 77 | .403 | 28.5 | -79 | L3 |
15 Rockies | 50 | 78 | .391 | 30 | -130 | L4 |
HOU
VS
SF
Pitchers

Hayden Wesneski
Catchers
Christian Vazquez
Infielders

Jeremy Pena
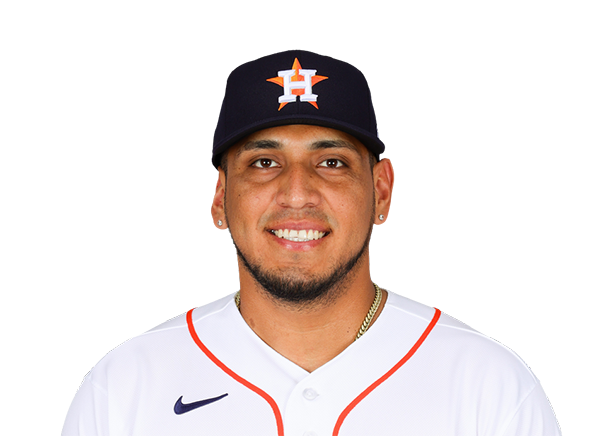
Isaac Paredes
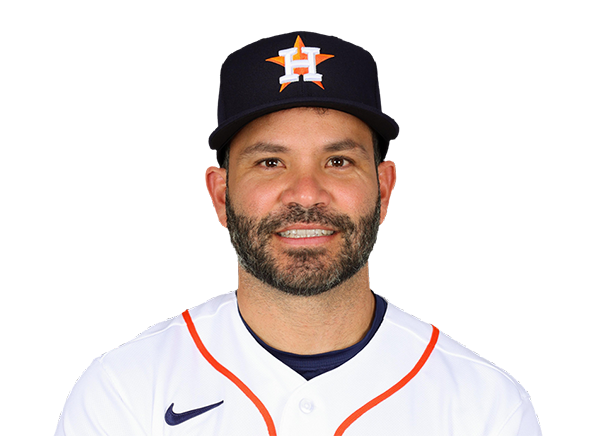
Jose Altuve

Christian Walker
Outfielders
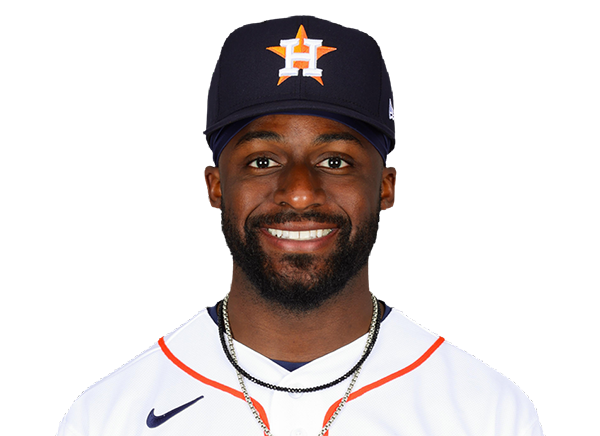
Taylor Trammell

Daulton Varsho
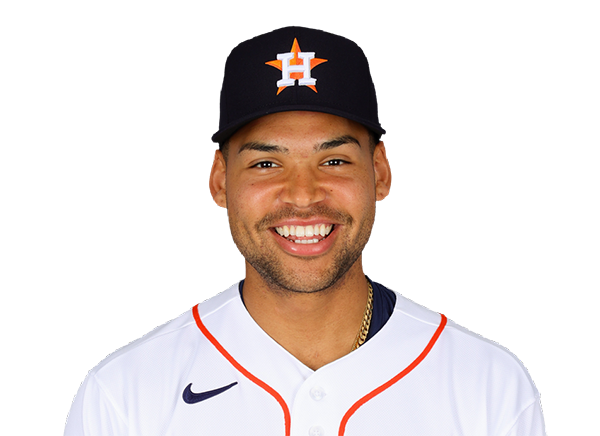
Cam Smith
Designated Hitters
Yordan Alvarez
Pitchers
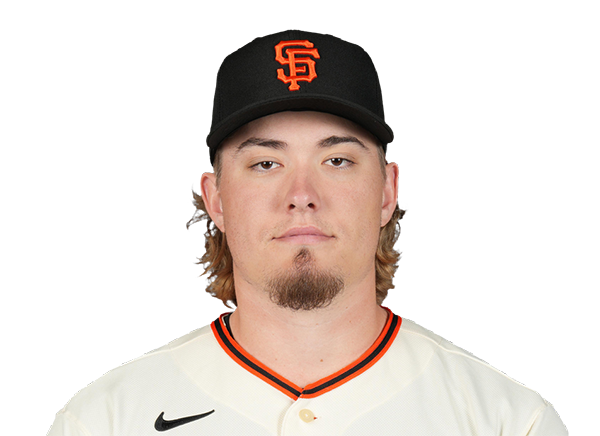
Blade Tidwell
Catchers

Drew Cavanaugh
Infielders
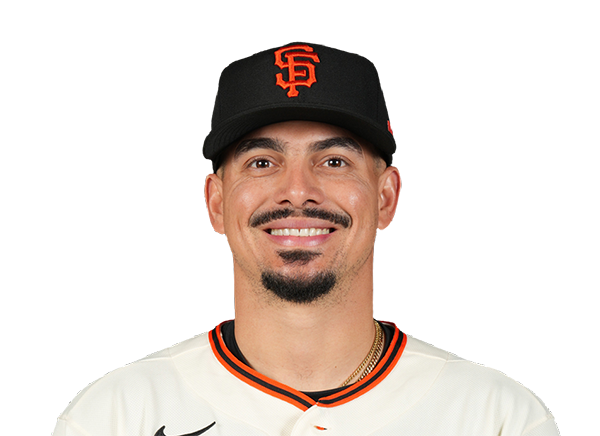
Willy Adames
Rafael Devers
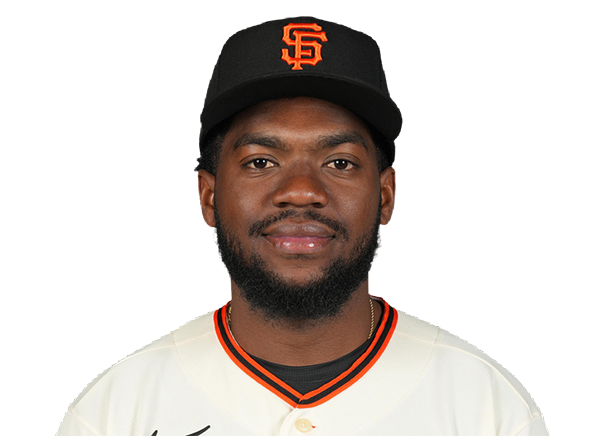
Osleivis Basabe

Christian Koss
Outfielders
Jung Hoo Lee
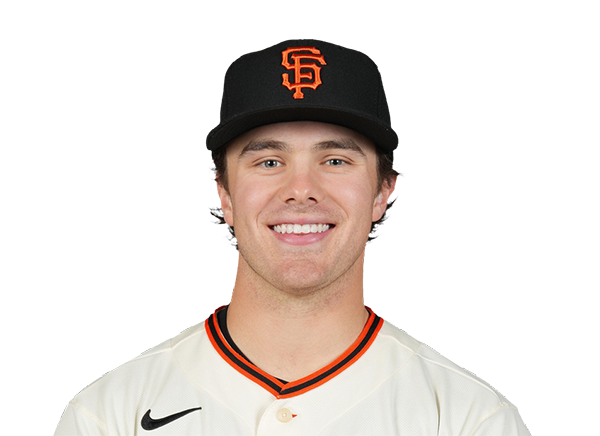
Drew Gilbert
Grant McCray
Designated Hitters

Bryce Eldridge
Astros
VS
Giants
Batting
120
Team Games Played
119
4050
At Bats
4048
991
Hits
1006
529
Runs Batted In
469
162
Home Runs
133
38
Stolen Bases
53
.245
Batting Average
.249
556
Runs
488
181
Doubles
201
10
Triples
23
1678
Total Bases
1652
407
Walks
311
976
Strikeouts
937
.320
On Base Percentage
.306
.414
Slugging Percentage
.408
.735
OBP Pct + SLG Pct
.714
120
Games Played
119
120
Games Started
119
57
Hit By Pitch
39
0.0
Wins Above Replacement
0.0
0.0
Offensive Wins Above Replacement
0.0
16
Caught Stealing
15
1
Is Qualified
1
539.2
Runs Created
509.3
4.5
Runs Created Per 27 Outs
4.3
.089
Walks Per Plate Appearance
.070
0.42
Walk To Strikeout Ratio
0.33
.170
Isolated Power
.160
.276
Secondary Average
.246
3.88
Pitches Per Plate Appearance
3.85
353
Extra Base Hits
357
4558
Plate Appearances
4455
25.0
At Bats Per Home Run
30.4
15
Sacrifice Hit
22
27
Sacrifice Flies
35
Pitching
120
Team Games Played
119
36
Quality Starts
43
61
Wins
49
59
Losses
70
37
Saves
22
57
Holds
58
944
Hits
986
541
Earned runs
510
163
Home Runs
113
496
Walks
446
1045
Strikeouts
900
8.8
Strikeouts Per 9 Innings
7.7
151.5
Pitches Per Start
148.1
1.35
Walks Plus Hits Per Inning Pitched
1.36
4.57
Earned Run Average
4.37
59
Losses
70
1064.1
Innings pitched
1050.0
.508
Win Percentage
.412
44
Save Opportunities
39
.237
Opponent Batting Average
.248
.331
Opponent's On-base pct.
.329
.406
Opponent's Slugging pct.
.391
.737
Opponent's OPB Pct + SLG Pct
.720
3979
At Bats
3969
150
Doubles
178
17
Triples
24
73
Batters Hit
49
94
Stolen Bases
100
120
Games Played
119
0
Complete Games
1
7
Shutouts
8
38
Wild Pitches
43
553
Runs Batted In
519
5
Balks
4
1064.1
Innings pitched
1050.0
8.8
Strikeouts Per 9 Innings
7.7
30
Caught Stealing
31
120
Games Started
119
0.0
Wins Above Replacement
0.0
1
Is Qualified
1
581
Runs
554
541
Earned Runs
510
1617
Total Bases
1551
Fielding
120
Team Games Played
119
1064
Full Innings
1050
4127
Total Chances
4339
3193
Putouts
3150
883
Assists
1114
51
Errors
75
181
Double Plays
201
0.988
Fielding Percentage
0.983
34.5
Range Factor
36.5
0.0
Zone Rating
0.0
120
Games Played
119
0
Games Started
0
0.0
Defensive Wins Above Replacement
0.0
1
Qualified
1