

Astros vs Padres Live Score (10 Aug, 2026)
Game Information
Stage
Standard
Season
2026
First Pitch
Sun, Aug 9, 8:20 pm
Venue
Petco Park
Location
San Diego, California
Attendance
40,160
Home Runs
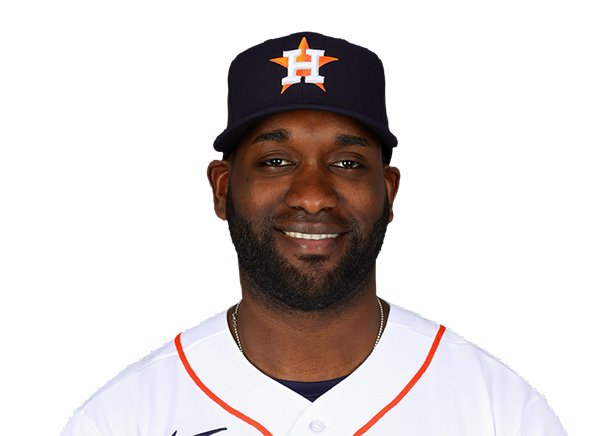
Yordan Alvarez
35 HR
.325 AVG
86 RBI
Manny Machado
23 HR
.212 AVG
70 RBI

Batting Average
Yordan Alvarez
.325 AVG
.439 OBP
.630 SLG
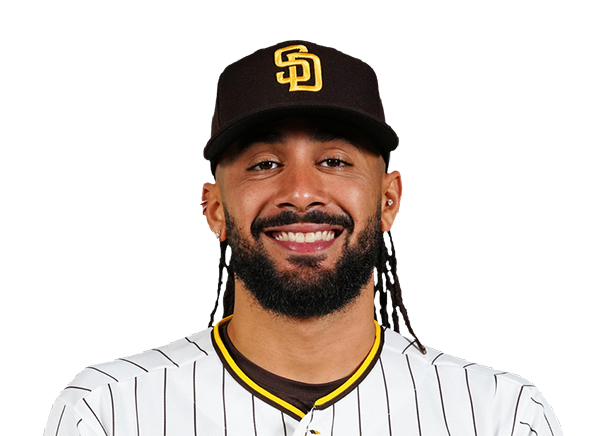
Fernando Tatis Jr.
.281 AVG
.352 OBP
.409 SLG
Runs Batted In
Yordan Alvarez
86 RBI
35 HR
.325 AVG
Manny Machado
70 RBI
23 HR
.212 AVG
Earned Run Average
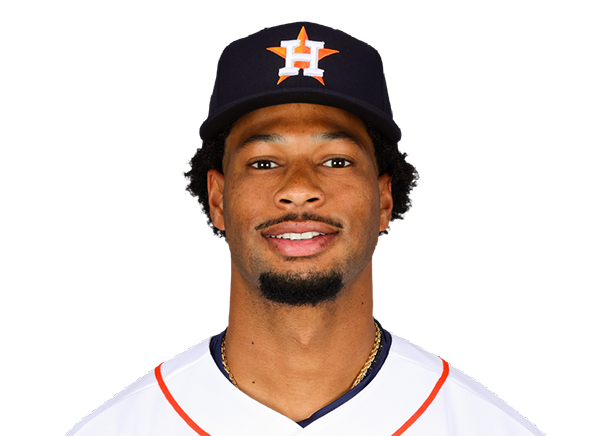
Michael King
3.37 ERA
7 W
120 K

Wins
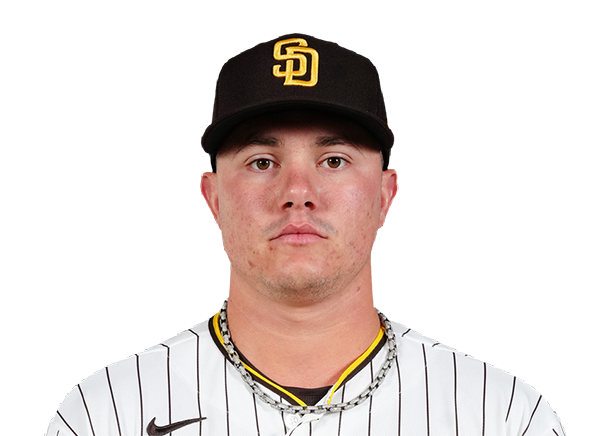
Peter Lambert
8 W
3.09 ERA
111 K

Adrian Morejon
8 W
2.89 ERA
75 K
Strikeouts
Peter Lambert
111 K
8 W
3.09 ERA
Michael King
120 K
7 W
3.37 ERA
Injury Report

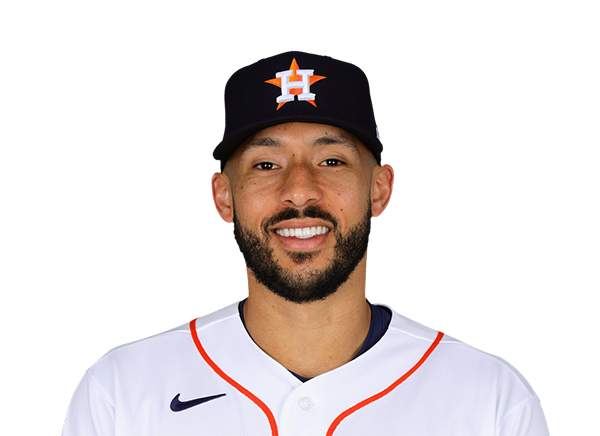





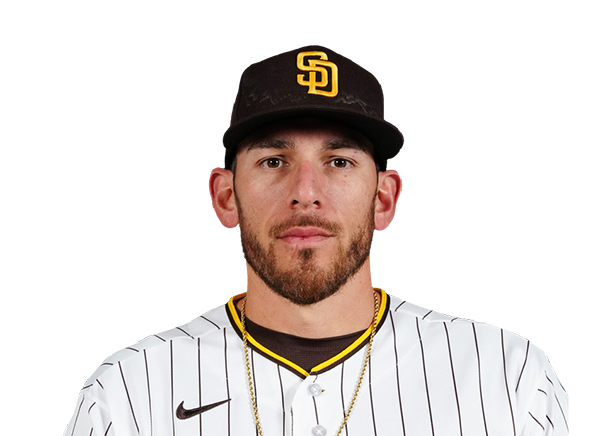
Team Stats
 HOU
SD


Array
Runs
Array
2
Hits
12
0
Errors
0
—
Home Runs
—
—
Walks
—
—
Strikeouts
—
Standings
American League
| Team | W | L | PCT | GB | DIFF | STRK |
|---|---|---|---|---|---|---|
1 Rays | 76 | 52 | .594 | - | +43 | L2 |
2 White Sox | 67 | 61 | .523 | 9 | +47 | W1 |
| 3Astros | 65 | 64 | .504 | 11.5 | -42 | W1 |
4 Yankees | 73 | 56 | .566 | 3.5 | +95 | L1 |
5 Red Sox | 69 | 59 | .539 | 7 | +97 | W1 |
6 Rangers | 64 | 65 | .496 | 12.5 | -45 | W2 |
7 Blue Jays | 64 | 67 | .489 | 13.5 | -50 | W1 |
8 Twins | 63 | 66 | .488 | 13.5 | -45 | L1 |
9 Guardians | 63 | 66 | .488 | 13.5 | -15 | W2 |
10 Orioles | 62 | 67 | .481 | 14.5 | -34 | W1 |
11 Tigers | 61 | 67 | .477 | 15 | +79 | L3 |
12 Mariners | 61 | 68 | .473 | 15.5 | -45 | W1 |
13 Royals | 56 | 74 | .431 | 21 | -97 | W6 |
14 Angels | 51 | 78 | .395 | 25.5 | -71 | L1 |
15 Athletics | 49 | 80 | .380 | 27.5 | -189 | L5 |
National League
| Team | W | L | PCT | GB | DIFF | STRK |
|---|---|---|---|---|---|---|
1 Brewers | 81 | 49 | .623 | - | +163 | W3 |
2 Dodgers | 78 | 51 | .605 | 2.5 | +146 | W4 |
3 Braves | 75 | 55 | .577 | 6 | +108 | L2 |
4 Cubs | 74 | 55 | .574 | 6.5 | +99 | L2 |
5 Phillies | 71 | 58 | .550 | 9.5 | +16 | W7 |
| 6Padres | 69 | 60 | .535 | 11.5 | +7 | W1 |
7 Diamondbacks | 68 | 61 | .527 | 12.5 | +13 | W2 |
8 Cardinals | 66 | 64 | .508 | 15 | +9 | L1 |
9 Marlins | 65 | 64 | .504 | 15.5 | +15 | W1 |
10 Pirates | 63 | 67 | .485 | 18 | +30 | L1 |
11 Reds | 61 | 68 | .473 | 19.5 | -98 | L2 |
12 Nationals | 61 | 69 | .469 | 20 | +16 | L2 |
13 Mets | 58 | 71 | .450 | 22.5 | -44 | L1 |
14 Giants | 52 | 76 | .406 | 28 | -78 | L2 |
15 Rockies | 50 | 78 | .391 | 30 | -130 | L4 |
HOU
VS
SD
Pitchers

Cristian Javier
Catchers
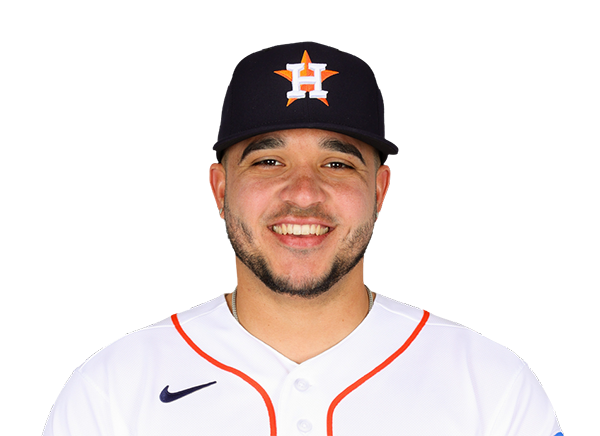
Yainer Diaz
Infielders

Jeremy Pena
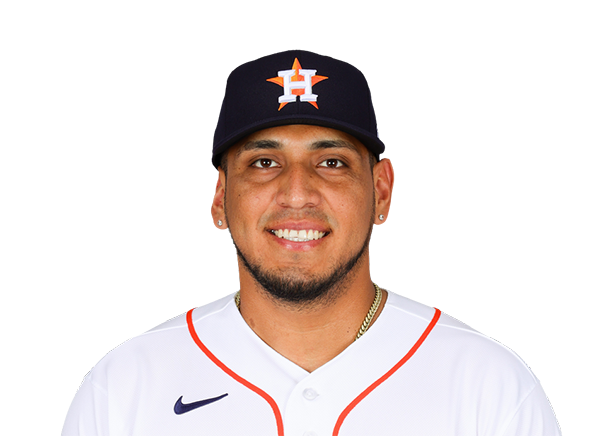
Isaac Paredes
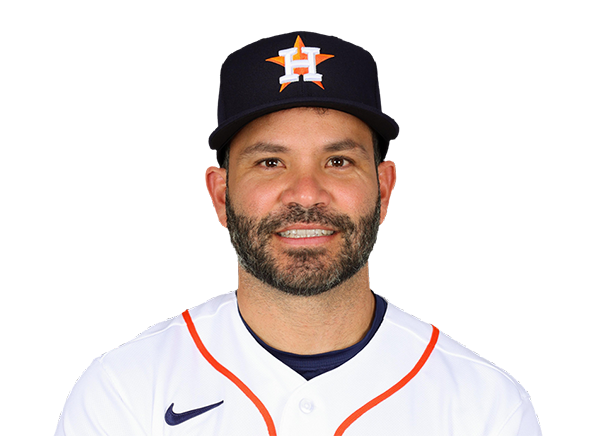
Jose Altuve

Christian Walker
Outfielders
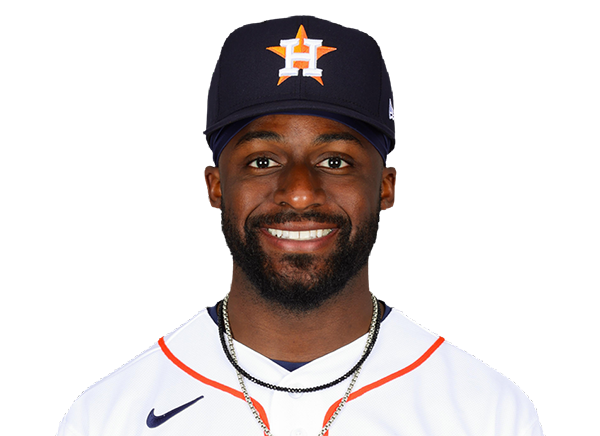
Taylor Trammell

Daulton Varsho
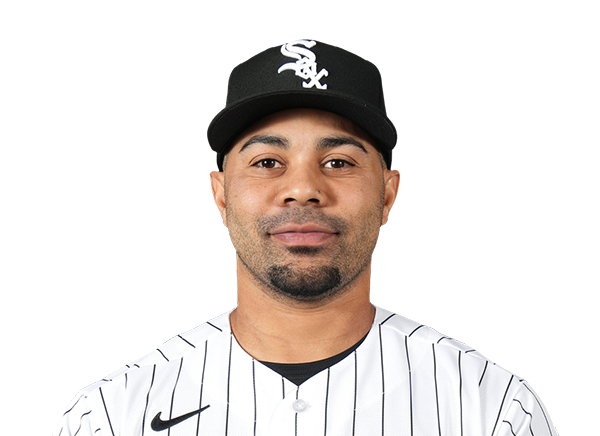
LaMonte Wade Jr.
Designated Hitters
Yordan Alvarez
Pitchers

Randy Vasquez
Catchers
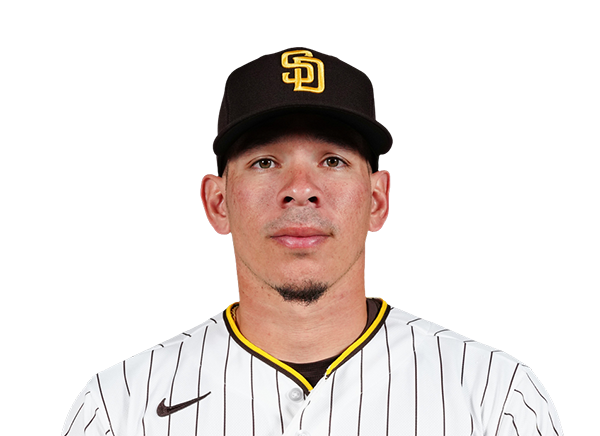
Freddy Fermin
Infielders

Jake Cronenworth
Manny Machado
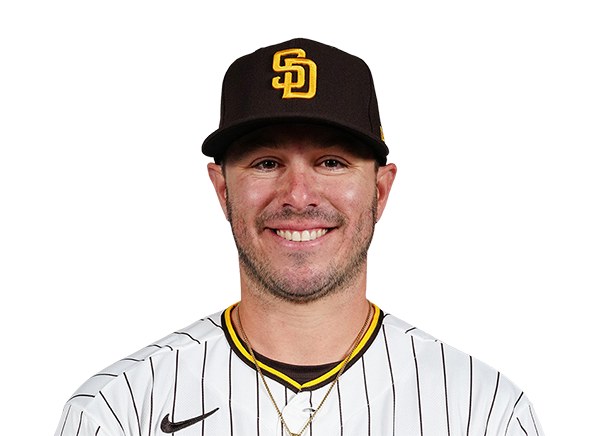
Ty France
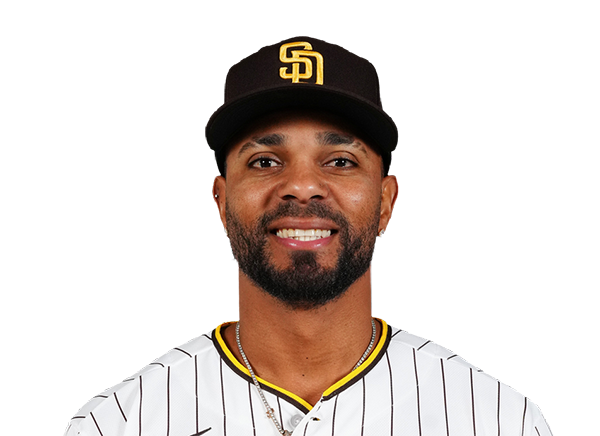
Xander Bogaerts
Outfielders
Fernando Tatis Jr.

Jackson Merrill

Luis Rengifo
Designated Hitters

Gavin Sheets
Astros
VS
Padres
Batting
119
Team Games Played
119
4014
At Bats
3918
983
Hits
927
523
Runs Batted In
486
161
Home Runs
128
38
Stolen Bases
119
.245
Batting Average
.237
550
Runs
504
179
Doubles
176
10
Triples
11
1665
Total Bases
1509
402
Walks
404
969
Strikeouts
967
.321
On Base Percentage
.313
.415
Slugging Percentage
.385
.735
OBP Pct + SLG Pct
.698
119
Games Played
119
119
Games Started
119
57
Hit By Pitch
45
0.0
Wins Above Replacement
0.0
0.0
Offensive Wins Above Replacement
0.0
16
Caught Stealing
32
1
Is Qualified
1
534.7
Runs Created
483.0
4.5
Runs Created Per 27 Outs
4.1
.089
Walks Per Plate Appearance
.091
0.41
Walk To Strikeout Ratio
0.42
.170
Isolated Power
.149
.276
Secondary Average
.274
3.88
Pitches Per Plate Appearance
3.93
350
Extra Base Hits
315
4516
Plate Appearances
4417
24.9
At Bats Per Home Run
30.6
15
Sacrifice Hit
18
26
Sacrifice Flies
31
Pitching
119
Team Games Played
119
35
Quality Starts
20
60
Wins
62
59
Losses
57
37
Saves
35
57
Holds
74
938
Hits
975
538
Earned runs
485
161
Home Runs
133
494
Walks
410
1038
Strikeouts
961
8.9
Strikeouts Per 9 Innings
8.2
151.8
Pitches Per Start
147.1
1.36
Walks Plus Hits Per Inning Pitched
1.32
4.59
Earned Run Average
4.16
59
Losses
57
1054.1
Innings pitched
1050.0
.504
Win Percentage
.521
44
Save Opportunities
50
.238
Opponent Batting Average
.246
.332
Opponent's On-base pct.
.323
.407
Opponent's Slugging pct.
.398
.738
Opponent's OPB Pct + SLG Pct
.720
3945
At Bats
3961
149
Doubles
172
17
Triples
15
73
Batters Hit
49
94
Stolen Bases
73
119
Games Played
119
0
Complete Games
0
7
Shutouts
8
38
Wild Pitches
32
550
Runs Batted In
499
5
Balks
3
1054.1
Innings pitched
1050.0
8.9
Strikeouts Per 9 Innings
8.2
30
Caught Stealing
35
119
Games Started
119
0.0
Wins Above Replacement
0.0
1
Is Qualified
1
578
Runs
514
538
Earned Runs
485
1604
Total Bases
1576
Fielding
119
Team Games Played
119
1054
Full Innings
1050
4089
Total Chances
4248
3163
Putouts
3150
875
Assists
1051
51
Errors
47
179
Double Plays
176
0.988
Fielding Percentage
0.989
34.5
Range Factor
36.0
0.0
Zone Rating
0.0
119
Games Played
119
0
Games Started
0
0.0
Defensive Wins Above Replacement
0.0
1
Qualified
1