

Astros vs Phillies Live Score (8 Sep, 2026)
Game Information
Stage
STD
Season
2026
First Pitch
Tue, Sep 8, 6:40 pm
Venue
Citizens Bank Park
Location
Philadelphia, Pennsylvania
Venue Type
Outdoor
Broadcast
MLB.TV
Attendance
39,262
Live Situation
1Balls
2Strikes
0Outs
—Pitcher
—At Bat
Pitch Sequence
1
STRIKE LOOKING
Sinker
96 MPH
2
STRIKE FOUL
Sinker
96 MPH
3
STRIKE FOUL
Sinker
96 MPH
4
BALL
Sinker
96 MPH
5
BALL IN PLAY
Sinker
97 MPH
Injury Report
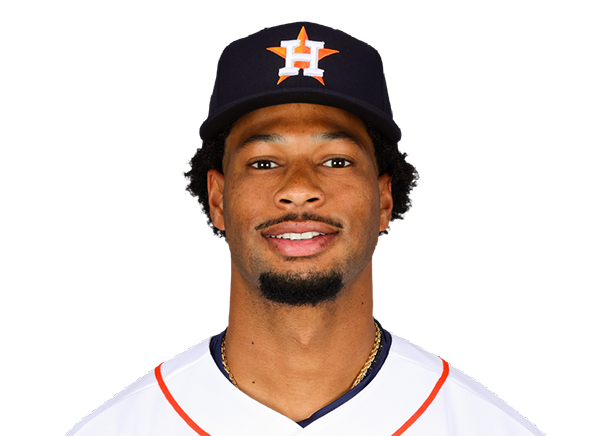


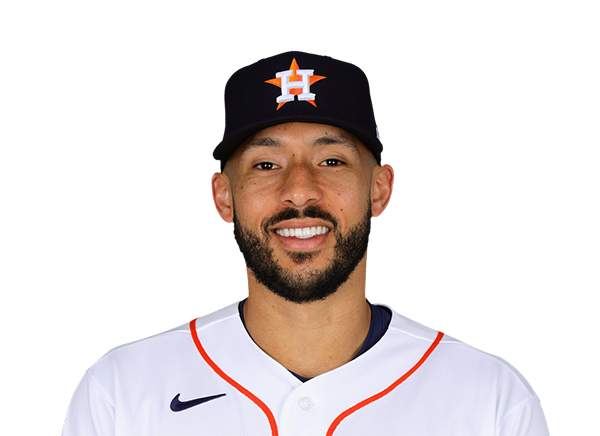
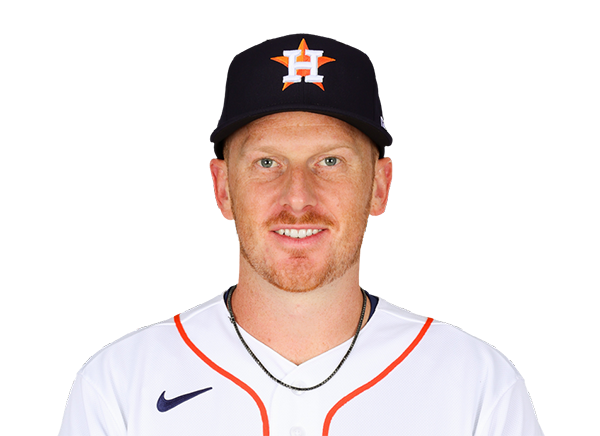



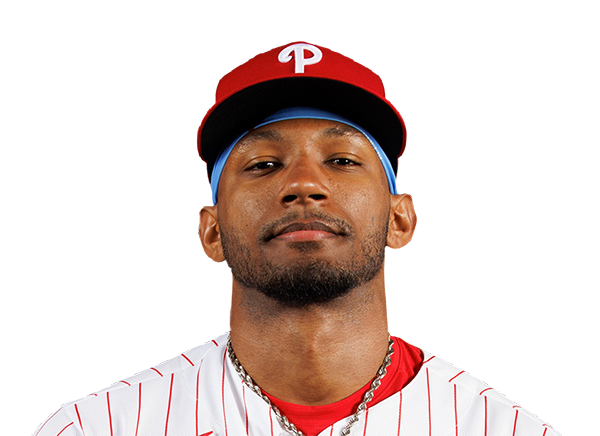

Team Stats
 HOU
PHI


6
Runs
5
11
Hits
10
0
Errors
0
3
Home Runs
1
4
Walks
0
10
Strikeouts
6
Player Box Score
Houston Astros
| Player | H-AB | AB | R | H | RBI | HR | BB | K | #P | AVG | OBP | SLG |
|---|---|---|---|---|---|---|---|---|---|---|---|---|
 Jeremy Pena | 1-5 | 5 | 0 | 1 | 1 | 0 | 0 | 1 | 18 | .270 | .324 | .455 |
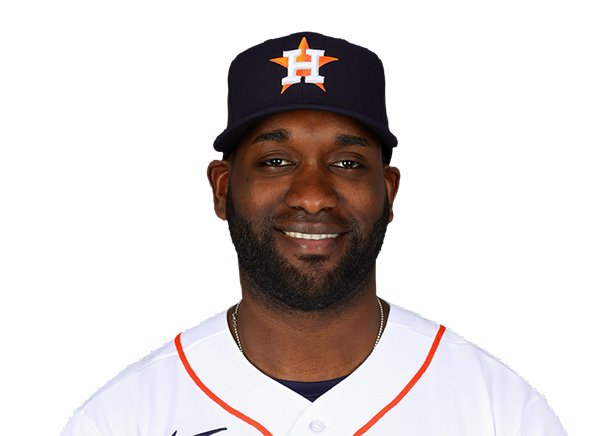 Yordan Alvarez | 0-5 | 5 | 0 | 0 | 0 | 0 | 0 | 1 | 16 | .311 | .428 | .593 |
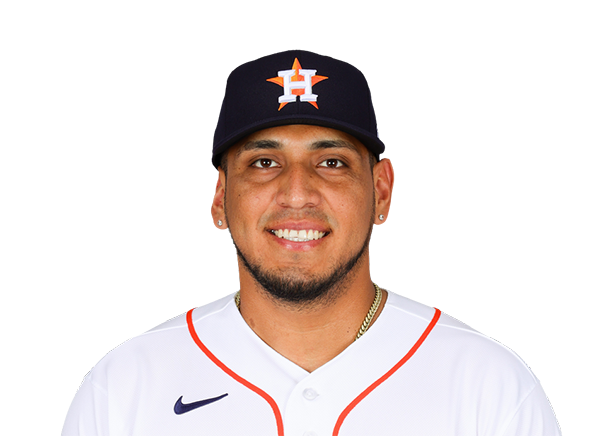 Isaac Paredes | 1-3 | 3 | 0 | 1 | 0 | 0 | 2 | 1 | 32 | .258 | .359 | .420 |
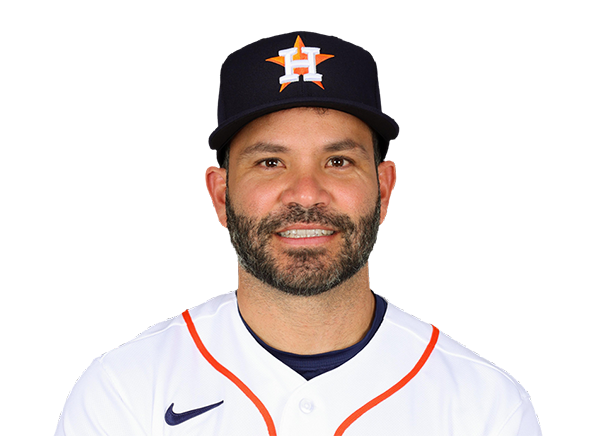 Jose Altuve | 0-5 | 5 | 0 | 0 | 0 | 0 | 0 | 1 | 15 | .244 | .306 | .396 |
 Nick Allen | 0-0 | 0 | 0 | 0 | 0 | 0 | 0 | 0 | 0 | .275 | .319 | .359 |
 Daulton Varsho | 3-5 | 5 | 2 | 3 | 1 | 1 | 0 | 2 | 20 | .230 | .294 | .368 |
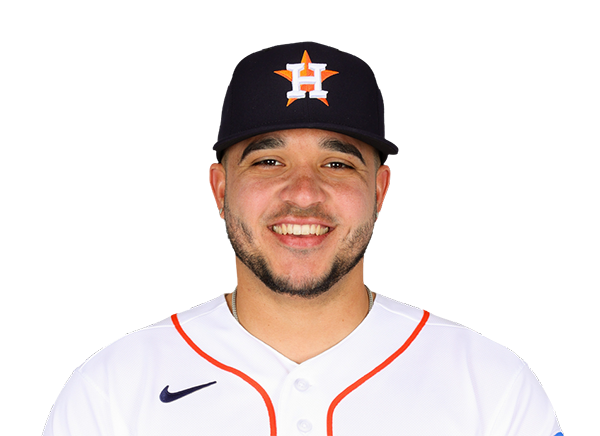 Yainer Diaz | 2-5 | 5 | 1 | 2 | 0 | 0 | 0 | 0 | 18 | .267 | .295 | .427 |
 Christian Walker | 2-3 | 3 | 1 | 2 | 3 | 1 | 1 | 0 | 18 | .230 | .305 | .429 |
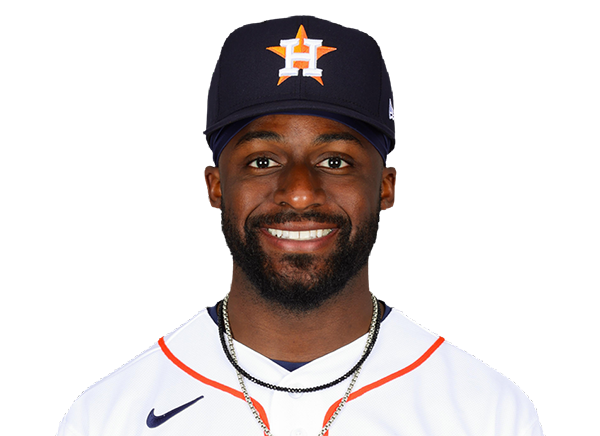 Taylor Trammell | 1-4 | 4 | 0 | 1 | 0 | 0 | 0 | 3 | 16 | .206 | .289 | .359 |
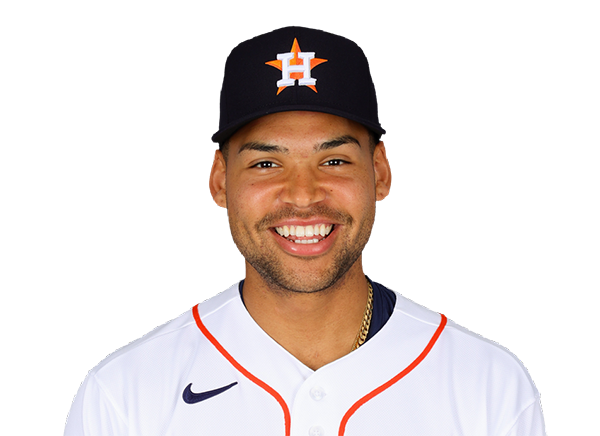 Cam Smith | 1-3 | 3 | 2 | 1 | 1 | 1 | 1 | 1 | 14 | .214 | .280 | .394 |
Philadelphia Phillies
| Player | H-AB | AB | R | H | RBI | HR | BB | K | #P | AVG | OBP | SLG |
|---|---|---|---|---|---|---|---|---|---|---|---|---|
 Kyle Schwarber | 1-5 | 5 | 1 | 1 | 1 | 0 | 0 | 0 | 26 | .242 | .357 | .527 |
 Trea Turner | 2-4 | 4 | 1 | 2 | 2 | 1 | 0 | 1 | 14 | .241 | .294 | .385 |
 Bryce Harper | 1-4 | 4 | 0 | 1 | 0 | 0 | 0 | 1 | 10 | .271 | .388 | .497 |
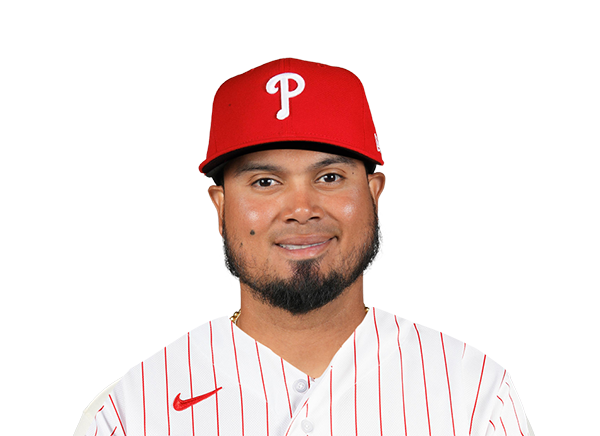 Luis Arraez | 1-3 | 3 | 0 | 1 | 0 | 0 | 0 | 0 | 17 | .316 | .348 | .428 |
 Garrett Stubbs | 0-0 | 0 | 0 | 0 | 0 | 0 | 0 | 0 | 0 | .167 | .220 | .167 |
 Alec Bohm | 1-4 | 4 | 1 | 1 | 0 | 0 | 0 | 2 | 21 | .246 | .308 | .389 |
 Bryson Stott | 1-3 | 3 | 1 | 1 | 0 | 0 | 0 | 0 | 18 | .252 | .327 | .396 |
 Brandon Marsh | 1-3 | 3 | 0 | 1 | 1 | 0 | 0 | 1 | 10 | .267 | .313 | .420 |
 Edmundo Sosa | 1-1 | 1 | 0 | 1 | 1 | 0 | 0 | 0 | 2 | .237 | .278 | .398 |
 J.T. Realmuto | 0-4 | 4 | 0 | 0 | 0 | 0 | 0 | 0 | 11 | .215 | .290 | .344 |
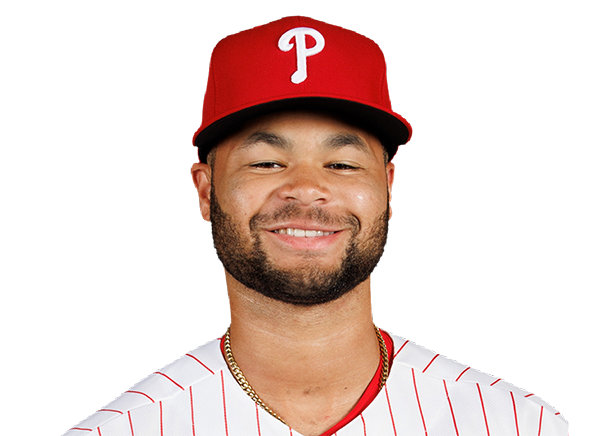 Justin Crawford | 1-2 | 2 | 1 | 1 | 0 | 0 | 0 | 0 | 6 | .263 | .311 | .347 |
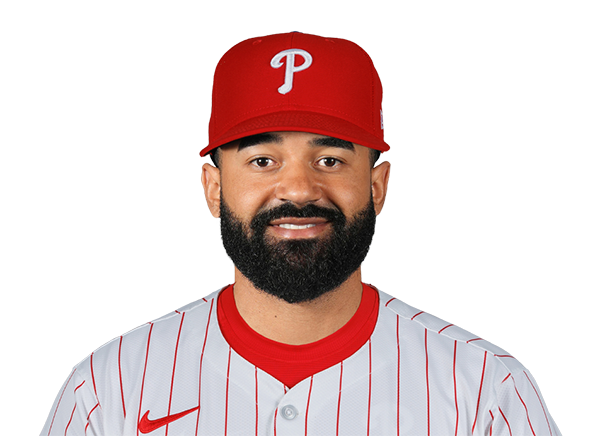 Derek Hill | 0-2 | 2 | 0 | 0 | 0 | 0 | 0 | 1 | 7 | .246 | .295 | .439 |
Houston Astros
| Player | IP | H | R | ER | BB | K | HR | PC-ST | ERA | PC |
|---|---|---|---|---|---|---|---|---|---|---|
 Hayden Wesneski | 6.0 | 5 | 3 | 3 | 0 | 3 | 1 | 82-61 | 3.35 | 82 |
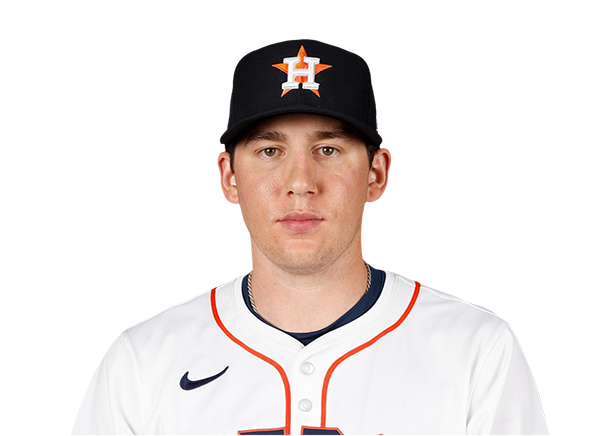 AJ Blubaugh | 0.2 | 2 | 1 | 1 | 0 | 0 | 0 | 18-11 | 3.15 | 18 |
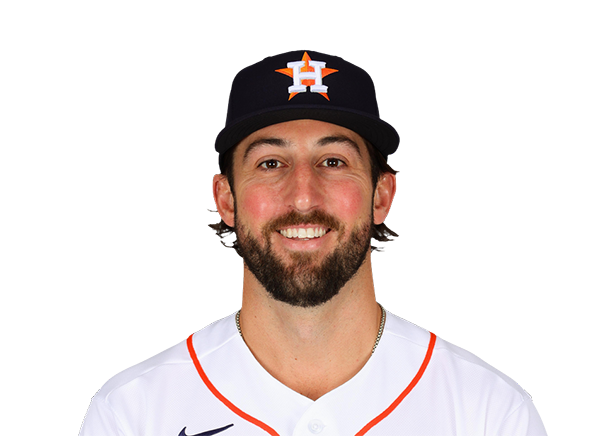 Bennett Sousa | 0.1 | 0 | 0 | 0 | 0 | 1 | 0 | 5-3 | 5.79 | 5 |
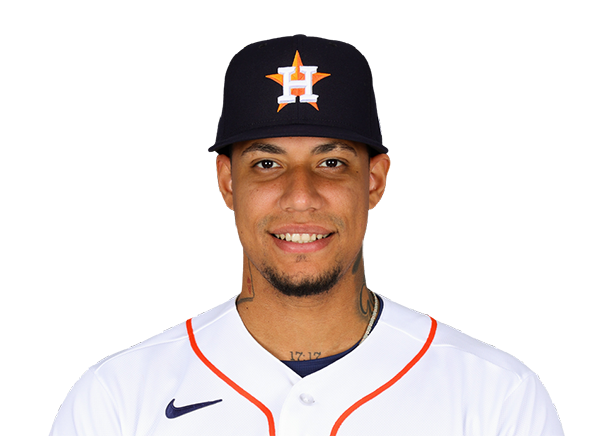 Bryan Abreu | 1.0 | 1 | 0 | 0 | 0 | 2 | 0 | 20-12 | 3.63 | 20 |
 Josh Hader | 1.0 | 2 | 1 | 1 | 0 | 0 | 0 | 17-13 | 0.89 | 17 |
Philadelphia Phillies
| Player | IP | H | R | ER | BB | K | HR | PC-ST | ERA | PC |
|---|---|---|---|---|---|---|---|---|---|---|
 Andrew Painter | 5.0 | 10 | 5 | 5 | 2 | 6 | 2 | 98-66 | 5.71 | 98 |
 Tim Mayza | 1.0 | 0 | 0 | 0 | 0 | 0 | 0 | 15-11 | 3.23 | 15 |
 Brooks Raley | 1.0 | 1 | 1 | 1 | 1 | 1 | 1 | 22-12 | 2.31 | 22 |
 Chase Shugart | 1.0 | 0 | 0 | 0 | 0 | 1 | 0 | 11-7 | 4.50 | 11 |
 Jose Alvarado | 1.0 | 0 | 0 | 0 | 1 | 2 | 0 | 21-13 | 5.40 | 21 |
H2H / Season Series
PHI5–6
HOU
Last 5 Games
| Date | Opponent | Result |
|---|---|---|
| Sep 8 | @ PHI | W6–5 |
| Sep 6 |  vs ARI | L2–3 |
| Sep 5 | vs ARI | L3–4 |
| Sep 4 | vs ARI | W3–1 |
| Sep 3 |  vs CHW | W6–2 |
| Date | Opponent | Result |
|---|---|---|
| Sep 8 | vs HOU | L5–6 |
| Sep 7 |  vs ATL | W1–0 |
| Sep 6 | vs ATL | L4–5 |
| Sep 5 | vs ATL | W4–2 |
| Sep 4 | vs ATL | L2–5 |
Standings
American League
| Team | W | L | PCT | GB | DIFF | STRK |
|---|---|---|---|---|---|---|
1 Rays | 86 | 58 | .597 | - | +53 | W1 |
| 2White Sox | 75 | 69 | .521 | 11 | +43 | L1 |
| 3Astros | 74 | 71 | .510 | 12.5 | -37 | W1 |
4 Yankees | 82 | 62 | .569 | 4 | +119 | W1 |
5 Red Sox | 80 | 66 | .548 | 7 | +84 | L1 |
6 Guardians | 74 | 72 | .507 | 13 | -12 | W1 |
7 Blue Jays | 73 | 73 | .500 | 14 | -37 | W1 |
8 Rangers | 72 | 73 | .497 | 14.5 | -39 | W2 |
9 Orioles | 70 | 76 | .479 | 17 | -31 | L1 |
10 Twins | 69 | 76 | .476 | 17.5 | -48 | W1 |
11 Mariners | 67 | 78 | .462 | 19.5 | -76 | L1 |
12 Tigers | 66 | 79 | .455 | 20.5 | +50 | L1 |
13 Royals | 64 | 82 | .438 | 23 | -91 | L2 |
14 Athletics | 58 | 88 | .397 | 29 | -189 | L1 |
15 Angels | 55 | 90 | .379 | 31.5 | -75 | W1 |
National League
| Team | W | L | PCT | GB | DIFF | STRK |
|---|---|---|---|---|---|---|
1 Brewers | 90 | 56 | .616 | - | +170 | W2 |
2 Dodgers | 88 | 57 | .607 | 1.5 | +156 | W6 |
| 3Braves | 85 | 60 | .586 | 4.5 | +113 | L2 |
| 4Phillies | 81 | 64 | .559 | 8.5 | +34 | L1 |
5 Cubs | 81 | 65 | .555 | 9 | +130 | L3 |
| 6Diamondbacks | 78 | 68 | .534 | 12 | +2 | W4 |
7 Padres | 77 | 68 | .531 | 12.5 | +10 | W3 |
8 Pirates | 72 | 73 | .497 | 17.5 | +32 | W2 |
9 Marlins | 72 | 74 | .493 | 18 | +8 | L2 |
10 Cardinals | 72 | 74 | .493 | 18 | -11 | L2 |
11 Reds | 69 | 76 | .476 | 20.5 | -109 | L2 |
12 Mets | 67 | 78 | .462 | 22.5 | -41 | W3 |
13 Nationals | 67 | 80 | .456 | 23.5 | +7 | L6 |
14 Giants | 61 | 85 | .418 | 29 | -73 | W2 |
15 Rockies | 55 | 89 | .382 | 34 | -142 | L2 |
HOU
VS
PHI
Pitchers
Hayden Wesneski
Catchers
Yainer Diaz
Infielders
Jeremy Pena
Isaac Paredes
Jose Altuve
Christian Walker
Outfielders
Daulton Varsho
Taylor Trammell
Cam Smith
Designated Hitters
Yordan Alvarez
Pitchers
Andrew Painter
Catchers
J.T. Realmuto
Infielders
Trea Turner
Luis Arraez
Alec Bohm
Bryson Stott
Outfielders
Bryce Harper
Brandon Marsh
Justin Crawford
Designated Hitters
Kyle Schwarber
Astros
VS
Phillies
Batting
145
Team Games Played
145
4873
At Bats
4857
1171
Hits
1175
622
Runs Batted In
627
190
Home Runs
171
44
Stolen Bases
98
.240
Batting Average
.242
653
Runs
647
213
Doubles
213
18
Triples
22
1990
Total Bases
1945
478
Walks
459
1190
Strikeouts
1199
.315
On Base Percentage
.312
.408
Slugging Percentage
.400
.723
OBP Pct + SLG Pct
.712
145
Games Played
145
145
Games Started
145
70
Hit By Pitch
57
0.0
Wins Above Replacement
0.0
0.0
Offensive Wins Above Replacement
0.0
19
Caught Stealing
18
1
Is Qualified
1
631.1
Runs Created
620.7
4.4
Runs Created Per 27 Outs
4.3
.087
Walks Per Plate Appearance
.084
0.40
Walk To Strikeout Ratio
0.38
.168
Isolated Power
.159
.271
Secondary Average
.270
3.88
Pitches Per Plate Appearance
3.90
421
Extra Base Hits
406
5476
Plate Appearances
5437
25.6
At Bats Per Home Run
28.4
17
Sacrifice Hit
11
36
Sacrifice Flies
50
Pitching
145
Team Games Played
145
41
Quality Starts
67
74
Wins
81
71
Losses
64
46
Saves
39
80
Holds
66
1149
Hits
1205
646
Earned runs
569
184
Home Runs
170
591
Walks
435
1270
Strikeouts
1421
8.9
Strikeouts Per 9 Innings
9.9
152.2
Pitches Per Start
148.5
1.35
Walks Plus Hits Per Inning Pitched
1.27
4.51
Earned Run Average
3.98
71
Losses
64
1288.1
Innings pitched
1287.2
.510
Win Percentage
.559
56
Save Opportunities
58
.238
Opponent Batting Average
.245
.330
Opponent's On-base pct.
.312
.402
Opponent's Slugging pct.
.398
.732
Opponent's OPB Pct + SLG Pct
.711
4825
At Bats
4923
197
Doubles
198
22
Triples
24
86
Batters Hit
63
116
Stolen Bases
83
145
Games Played
145
0
Complete Games
2
9
Shutouts
17
46
Wild Pitches
37
659
Runs Batted In
582
6
Balks
3
1288.1
Innings pitched
1287.2
8.9
Strikeouts Per 9 Innings
9.9
36
Caught Stealing
35
145
Games Started
145
0.0
Wins Above Replacement
0.0
1
Is Qualified
1
690
Runs
613
646
Earned Runs
569
1942
Total Bases
1961
Fielding
145
Team Games Played
145
1288
Full Innings
1288
4992
Total Chances
5127
3865
Putouts
3863
1063
Assists
1193
64
Errors
71
213
Double Plays
213
0.987
Fielding Percentage
0.986
34.4
Range Factor
35.3
0.0
Zone Rating
0.0
145
Games Played
145
0
Games Started
0
0.0
Defensive Wins Above Replacement
0.0
1
Qualified
1