

Astros vs Phillies Live Score (9 Sep, 2026)
Game Information
Stage
STD
Season
2026
First Pitch
Wed, Sep 9, 6:40 pm
Venue
Citizens Bank Park
Location
Philadelphia, Pennsylvania
Venue Type
Outdoor
Broadcast
MLB.TV
Attendance
38,642
Live Situation
1Balls
1Strikes
0Outs
—Pitcher
—At Bat
Pitch Sequence
1
BALL
Splitter
99 MPH
2
STRIKE FOUL
Four-seam FB
101 MPH
3
BALL IN PLAY
Changeup
91 MPH
Injury Report
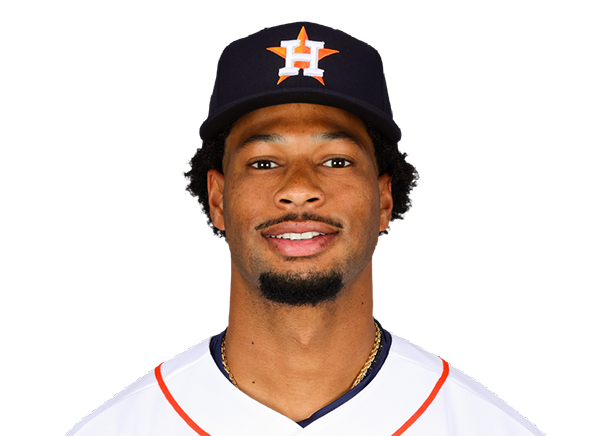


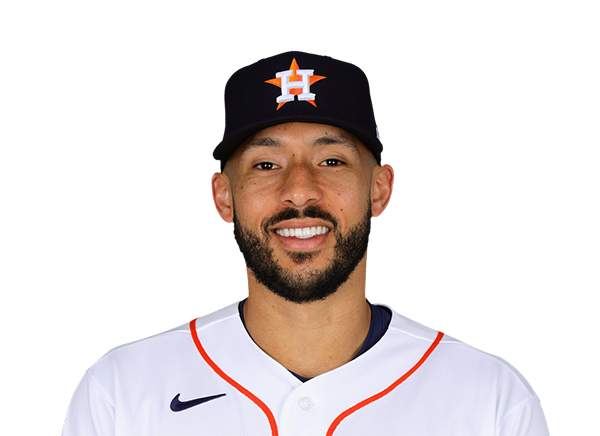
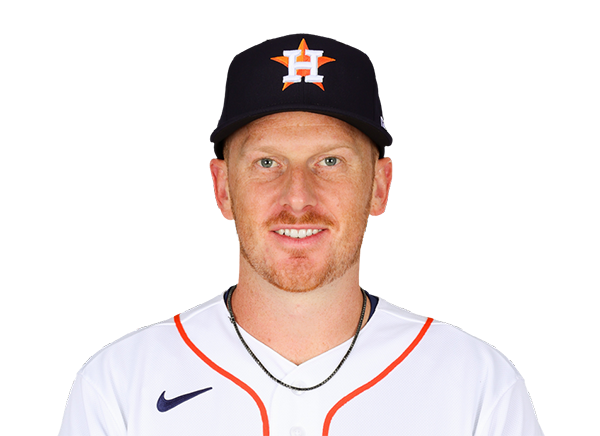



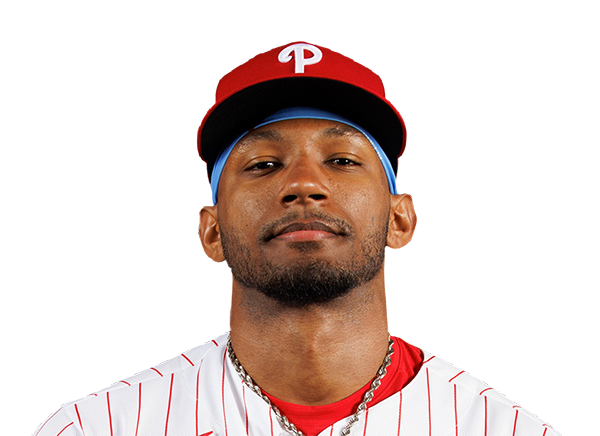

Team Stats
 HOU
PHI


7
Runs
11
12
Hits
12
2
Errors
2
2
Home Runs
2
0
Walks
4
6
Strikeouts
12
Player Box Score
Houston Astros
| Player | H-AB | AB | R | H | RBI | HR | BB | K | #P | AVG | OBP | SLG |
|---|---|---|---|---|---|---|---|---|---|---|---|---|
 Jeremy Pena | 2-5 | 5 | 1 | 2 | 0 | 0 | 0 | 2 | 15 | .272 | .325 | .457 |
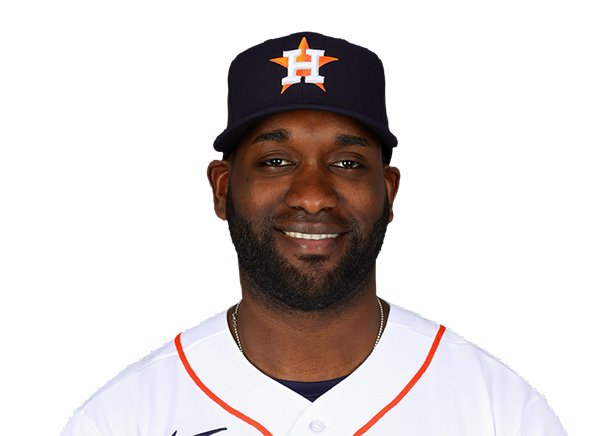 Yordan Alvarez | 2-5 | 5 | 1 | 2 | 1 | 0 | 0 | 0 | 19 | .312 | .428 | .593 |
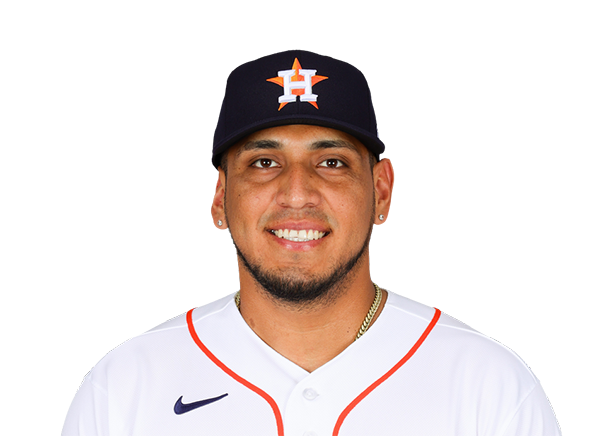 Isaac Paredes | 2-4 | 4 | 1 | 2 | 3 | 1 | 0 | 1 | 14 | .260 | .360 | .427 |
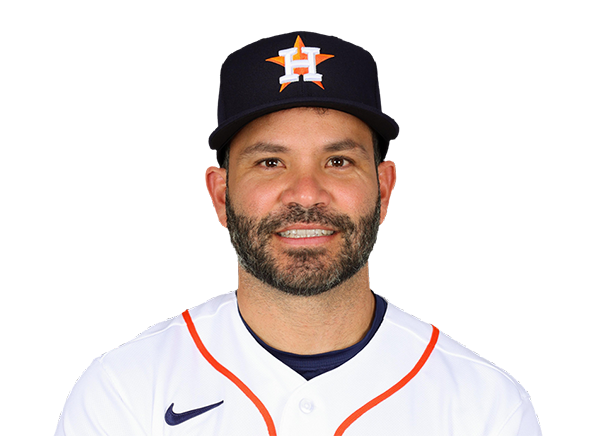 Jose Altuve | 1-4 | 4 | 1 | 1 | 0 | 0 | 0 | 1 | 18 | .244 | .306 | .397 |
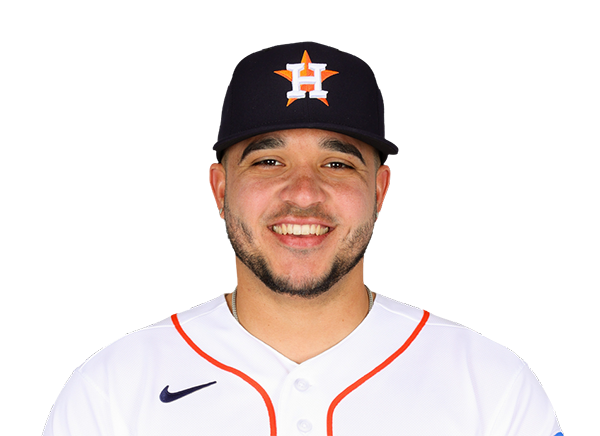 Yainer Diaz | 2-4 | 4 | 0 | 2 | 1 | 0 | 0 | 0 | 11 | .270 | .298 | .432 |
 Christian Walker | 0-4 | 4 | 0 | 0 | 0 | 0 | 0 | 0 | 13 | .228 | .303 | .426 |
 Daulton Varsho | 1-4 | 4 | 1 | 1 | 0 | 0 | 0 | 0 | 12 | .230 | .294 | .367 |
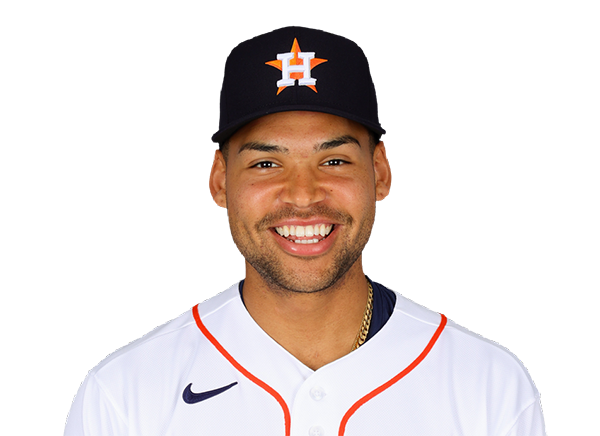 Cam Smith | 2-4 | 4 | 2 | 2 | 2 | 1 | 0 | 0 | 12 | .216 | .281 | .402 |
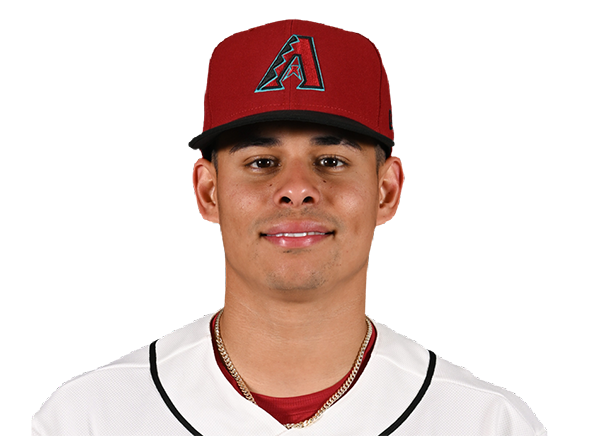 Jorge Barrosa | 0-2 | 2 | 0 | 0 | 0 | 0 | 0 | 1 | 12 | .199 | .281 | .338 |
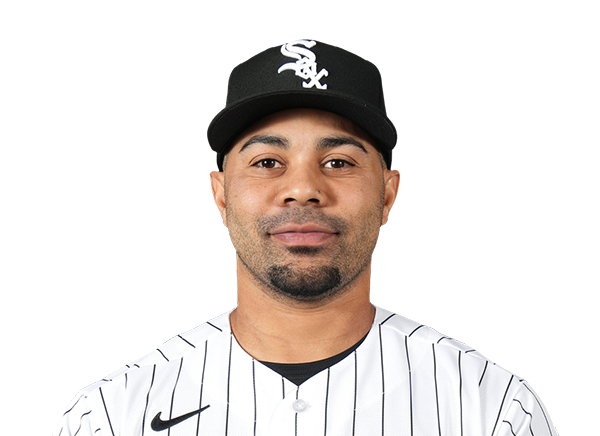 LaMonte Wade Jr. | 0-1 | 1 | 0 | 0 | 0 | 0 | 0 | 1 | 5 | .209 | .320 | .336 |
Philadelphia Phillies
| Player | H-AB | AB | R | H | RBI | HR | BB | K | #P | AVG | OBP | SLG |
|---|---|---|---|---|---|---|---|---|---|---|---|---|
 Kyle Schwarber | 1-5 | 5 | 1 | 1 | 4 | 1 | 0 | 3 | 28 | .242 | .356 | .530 |
 Alec Bohm | 0-0 | 0 | 0 | 0 | 0 | 0 | 0 | 0 | 0 | .246 | .308 | .389 |
 Trea Turner | 2-5 | 5 | 2 | 2 | 2 | 1 | 0 | 1 | 16 | .243 | .295 | .391 |
 Bryce Harper | 1-4 | 4 | 1 | 1 | 2 | 0 | 1 | 3 | 26 | .271 | .388 | .495 |
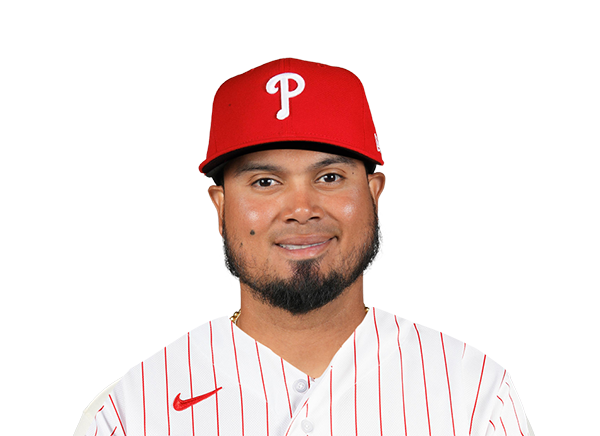 Luis Arraez | 2-4 | 4 | 1 | 2 | 1 | 0 | 1 | 0 | 27 | .318 | .350 | .431 |
 Bryson Stott | 0-3 | 3 | 1 | 0 | 0 | 0 | 1 | 1 | 16 | .251 | .327 | .393 |
 Brandon Marsh | 1-2 | 2 | 0 | 1 | 0 | 0 | 0 | 0 | 10 | .268 | .314 | .420 |
 Edmundo Sosa | 1-2 | 2 | 1 | 1 | 1 | 0 | 0 | 1 | 9 | .239 | .279 | .399 |
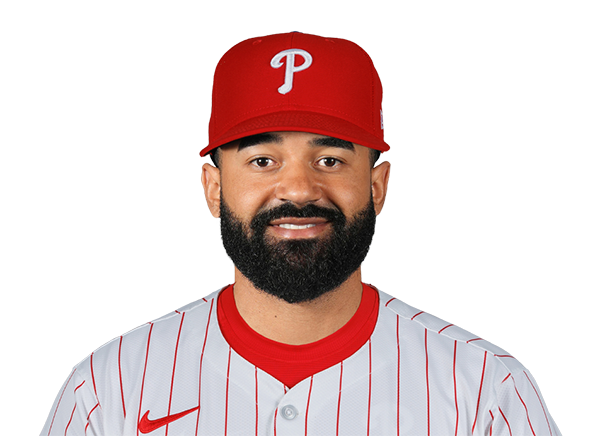 Derek Hill | 0-0 | 0 | 0 | 0 | 0 | 0 | 0 | 0 | 0 | .246 | .295 | .439 |
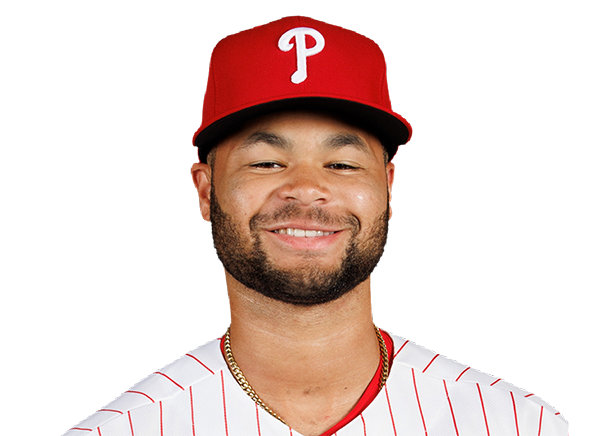 Justin Crawford | 1-4 | 4 | 1 | 1 | 0 | 0 | 0 | 1 | 18 | .263 | .311 | .346 |
 J.T. Realmuto | 1-4 | 4 | 1 | 1 | 0 | 0 | 0 | 2 | 13 | .215 | .290 | .343 |
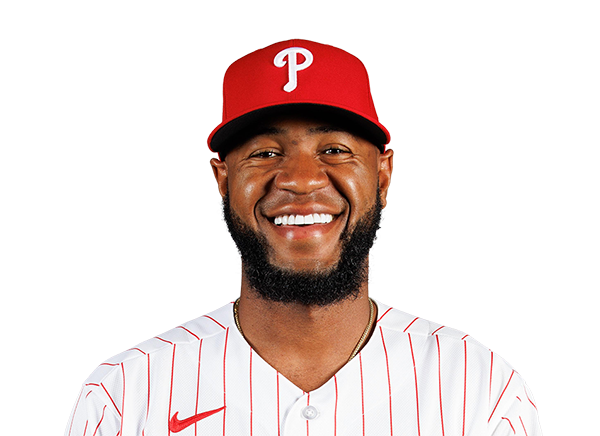 Bryan De La Cruz | 2-3 | 3 | 2 | 2 | 1 | 0 | 1 | 0 | 12 | .339 | .381 | .500 |
Houston Astros
| Player | IP | H | R | ER | BB | K | HR | PC-ST | ERA | PC |
|---|---|---|---|---|---|---|---|---|---|---|
 Hunter Brown | 5.0 | 7 | 5 | 4 | 0 | 7 | 1 | 90-57 | 3.52 | 90 |
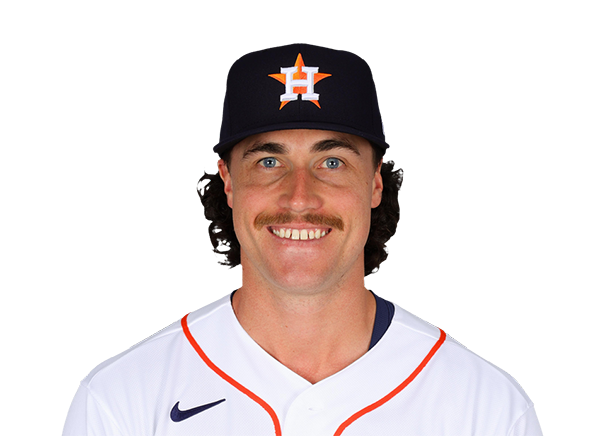 Bryan King | 0.0 | 3 | 4 | 3 | 0 | 0 | 0 | 20-12 | 5.17 | 20 |
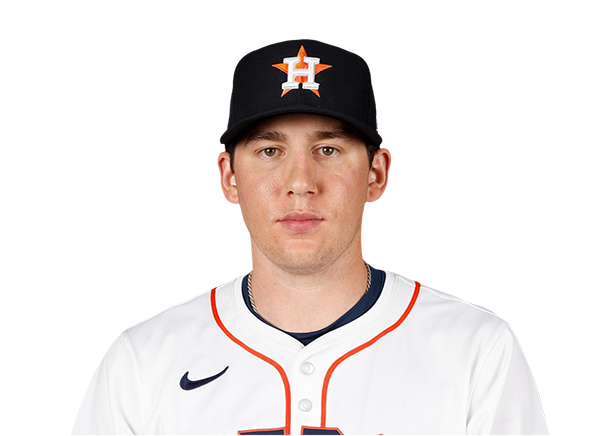 AJ Blubaugh | 0.1 | 1 | 2 | 2 | 1 | 1 | 1 | 15-7 | 3.34 | 15 |
 Enyel De Los Santos | 0.2 | 0 | 0 | 0 | 0 | 1 | 0 | 7-5 | 4.28 | 7 |
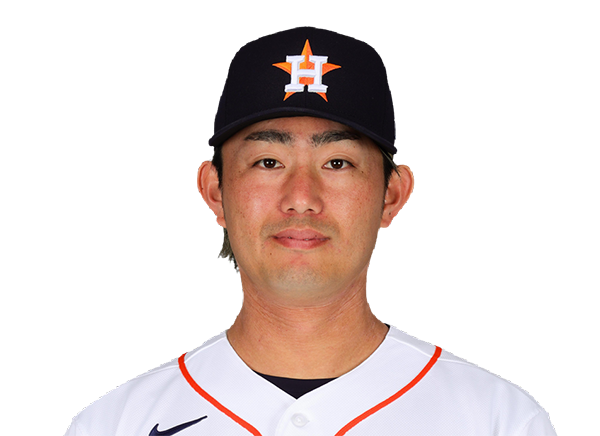 Tatsuya Imai | 2.0 | 1 | 0 | 0 | 3 | 3 | 0 | 43-25 | 5.20 | 43 |
Philadelphia Phillies
| Player | IP | H | R | ER | BB | K | HR | PC-ST | ERA | PC |
|---|---|---|---|---|---|---|---|---|---|---|
 Cristopher Sanchez | 6.0 | 10 | 6 | 6 | 0 | 3 | 2 | 81-55 | 2.79 | 81 |
 Jonathan Bowlan | 1.0 | 2 | 1 | 1 | 0 | 1 | 0 | 21-14 | 3.17 | 21 |
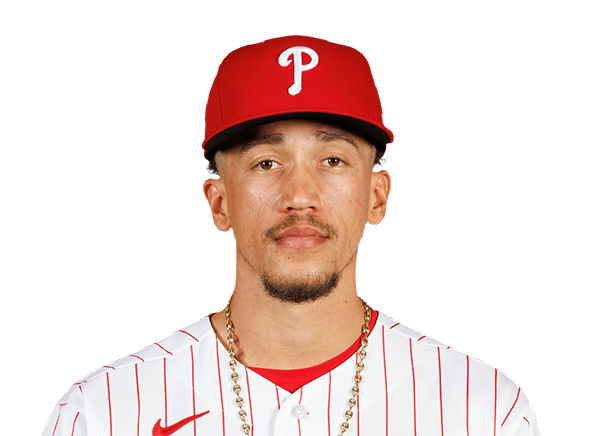 Alex McFarlane | 1.0 | 0 | 0 | 0 | 0 | 0 | 0 | 15-12 | 2.84 | 15 |
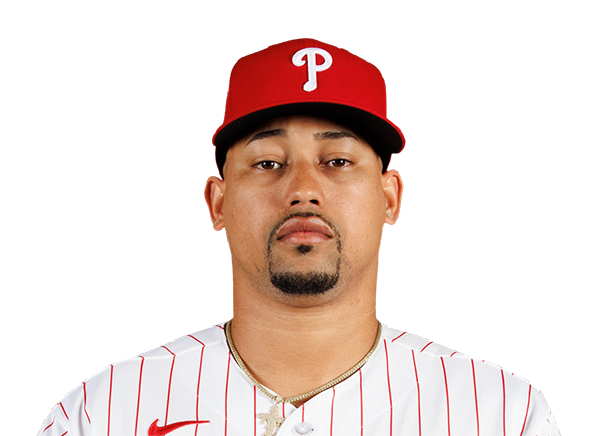 Jhoan Duran | 1.0 | 0 | 0 | 0 | 0 | 2 | 0 | 14-9 | 1.69 | 14 |
H2H / Season Series
PHI11–7
HOU
PHI5–6
HOU
Last 5 Games
| Date | Opponent | Result |
|---|---|---|
| Sep 9 | @ PHI | L7–11 |
| Sep 8 | @ PHI | W6–5 |
| Sep 6 |  vs ARI | L2–3 |
| Sep 5 | vs ARI | L3–4 |
| Sep 4 | vs ARI | W3–1 |
| Date | Opponent | Result |
|---|---|---|
| Sep 9 | vs HOU | W11–7 |
| Sep 8 | vs HOU | L5–6 |
| Sep 7 |  vs ATL | W1–0 |
| Sep 6 | vs ATL | L4–5 |
| Sep 5 | vs ATL | W4–2 |
Standings
American League
| Team | W | L | PCT | GB | DIFF | STRK |
|---|---|---|---|---|---|---|
1 Rays | 87 | 58 | .600 | - | +58 | W2 |
2 White Sox | 75 | 70 | .517 | 12 | +41 | L2 |
| 3Astros | 74 | 72 | .507 | 13.5 | -41 | L1 |
4 Yankees | 83 | 62 | .572 | 4 | +124 | W2 |
5 Red Sox | 80 | 67 | .544 | 8 | +82 | L2 |
6 Guardians | 74 | 73 | .503 | 14 | -16 | L1 |
7 Blue Jays | 73 | 74 | .497 | 15 | -39 | L1 |
8 Rangers | 72 | 74 | .493 | 15.5 | -40 | L1 |
9 Orioles | 71 | 76 | .483 | 17 | -27 | W1 |
10 Twins | 69 | 77 | .473 | 18.5 | -53 | L1 |
11 Mariners | 68 | 78 | .466 | 19.5 | -75 | W1 |
12 Tigers | 67 | 79 | .459 | 20.5 | +55 | W1 |
13 Royals | 65 | 82 | .442 | 23 | -88 | W1 |
14 Athletics | 59 | 88 | .401 | 29 | -187 | W1 |
15 Angels | 56 | 90 | .384 | 31.5 | -73 | W2 |
National League
| Team | W | L | PCT | GB | DIFF | STRK |
|---|---|---|---|---|---|---|
1 Brewers | 91 | 56 | .619 | - | +172 | W3 |
2 Dodgers | 89 | 57 | .610 | 1.5 | +169 | W7 |
| 3Braves | 85 | 61 | .582 | 5.5 | +108 | L3 |
| 4Phillies | 82 | 64 | .562 | 8.5 | +38 | W1 |
5 Cubs | 81 | 66 | .551 | 10 | +128 | L4 |
6 Padres | 78 | 68 | .534 | 12.5 | +17 | W4 |
| 7Diamondbacks | 78 | 69 | .531 | 13 | -1 | L1 |
8 Pirates | 73 | 73 | .500 | 17.5 | +34 | W3 |
9 Marlins | 72 | 75 | .490 | 19 | +7 | L3 |
10 Cardinals | 72 | 75 | .490 | 19 | -12 | L3 |
11 Reds | 69 | 77 | .473 | 21.5 | -122 | L3 |
12 Mets | 68 | 78 | .466 | 22.5 | -40 | W4 |
13 Nationals | 67 | 81 | .453 | 24.5 | 0 | L7 |
14 Giants | 62 | 85 | .422 | 29 | -72 | W3 |
15 Rockies | 55 | 90 | .379 | 35 | -147 | L3 |
HOU
VS
PHI
Pitchers
Hunter Brown
Catchers
Yainer Diaz
Infielders
Jeremy Pena
Isaac Paredes
Jose Altuve
Christian Walker
Outfielders
Daulton Varsho
Cam Smith
Jorge Barrosa
Designated Hitters
Yordan Alvarez
Pitchers
Cristopher Sanchez
Catchers
J.T. Realmuto
Infielders
Kyle Schwarber
Trea Turner
Luis Arraez
Bryson Stott
Outfielders
Brandon Marsh
Justin Crawford
Bryan De La Cruz
Designated Hitters
Bryce Harper
Astros
VS
Phillies
Batting
146
Team Games Played
146
4910
At Bats
4893
1183
Hits
1187
629
Runs Batted In
638
192
Home Runs
173
44
Stolen Bases
99
.241
Batting Average
.243
660
Runs
658
217
Doubles
214
18
Triples
22
2012
Total Bases
1964
478
Walks
463
1196
Strikeouts
1211
.315
On Base Percentage
.312
.410
Slugging Percentage
.401
.725
OBP Pct + SLG Pct
.714
146
Games Played
146
146
Games Started
146
70
Hit By Pitch
57
0.0
Wins Above Replacement
0.0
0.0
Offensive Wins Above Replacement
0.0
19
Caught Stealing
19
1
Is Qualified
1
637.3
Runs Created
627.9
4.4
Runs Created Per 27 Outs
4.4
.087
Walks Per Plate Appearance
.085
0.40
Walk To Strikeout Ratio
0.38
.169
Isolated Power
.159
.271
Secondary Average
.270
3.87
Pitches Per Plate Appearance
3.91
427
Extra Base Hits
409
5514
Plate Appearances
5477
25.6
At Bats Per Home Run
28.3
18
Sacrifice Hit
11
36
Sacrifice Flies
50
Pitching
146
Team Games Played
146
41
Quality Starts
67
74
Wins
82
72
Losses
64
46
Saves
39
80
Holds
66
1161
Hits
1217
655
Earned runs
576
186
Home Runs
172
595
Walks
435
1282
Strikeouts
1427
8.9
Strikeouts Per 9 Innings
9.9
152.4
Pitches Per Start
148.4
1.35
Walks Plus Hits Per Inning Pitched
1.27
4.55
Earned Run Average
4.00
72
Losses
64
1296.1
Innings pitched
1296.2
.507
Win Percentage
.562
57
Save Opportunities
58
.239
Opponent Batting Average
.245
.330
Opponent's On-base pct.
.312
.403
Opponent's Slugging pct.
.400
.734
Opponent's OPB Pct + SLG Pct
.712
4861
At Bats
4960
198
Doubles
202
22
Triples
24
86
Batters Hit
63
117
Stolen Bases
83
146
Games Played
146
0
Complete Games
2
9
Shutouts
17
47
Wild Pitches
37
670
Runs Batted In
589
6
Balks
3
1296.1
Innings pitched
1296.2
8.9
Strikeouts Per 9 Innings
9.9
37
Caught Stealing
35
146
Games Started
146
0.0
Wins Above Replacement
0.0
1
Is Qualified
1
701
Runs
620
655
Earned Runs
576
1961
Total Bases
1983
Fielding
146
Team Games Played
146
1296
Full Innings
1297
5025
Total Chances
5167
3889
Putouts
3890
1070
Assists
1204
66
Errors
73
217
Double Plays
214
0.987
Fielding Percentage
0.986
34.4
Range Factor
35.4
0.0
Zone Rating
0.0
146
Games Played
146
0
Games Started
0
0.0
Defensive Wins Above Replacement
0.0
1
Qualified
1