

Astros vs Rays Live Score (12 Sep, 2026)
Game Information
Stage
STD
Season
2026
First Pitch
Sat, Sep 12, 6:10 pm
Venue
Tropicana Field
Location
St. Petersburg, Florida
Venue Type
Indoor
Broadcast
MLB.TV
Attendance
24,642
Live Situation
3Balls
1Strikes
0Outs
—Pitcher
—At Bat
Pitch Sequence
1
BALL
Changeup
80 MPH
2
BALL
Changeup
83 MPH
3
STRIKE LOOKING
Four-seam FB
93 MPH
4
BALL
Four-seam FB
93 MPH
5
BALL IN PLAY
Four-seam FB
93 MPH
Injury Report
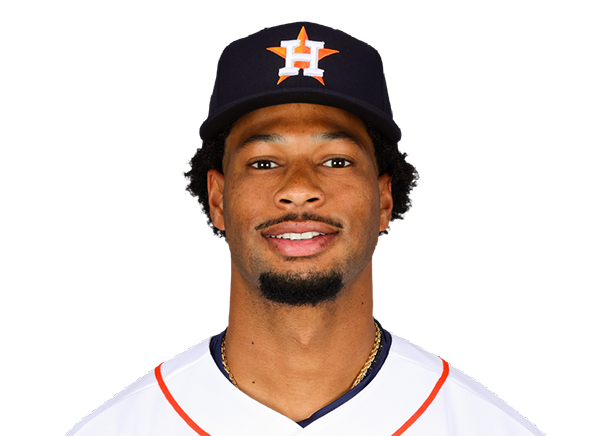



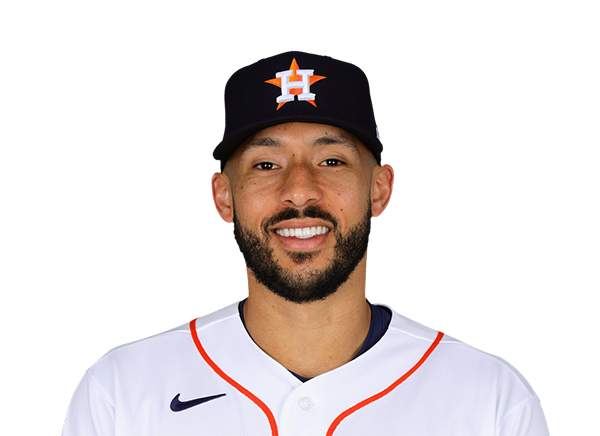



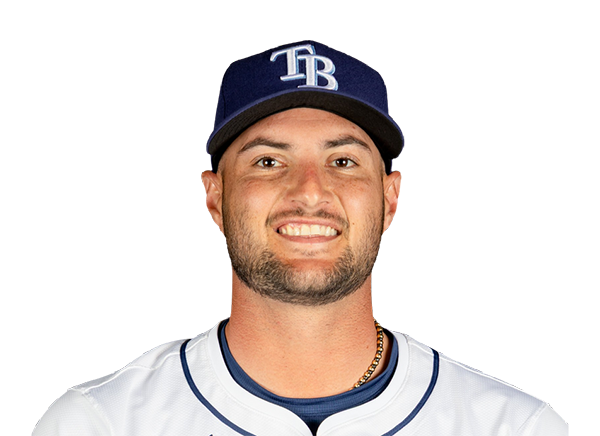

Team Stats
 HOU
TB


2
Runs
3
5
Hits
7
0
Errors
0
1
Home Runs
0
3
Walks
4
14
Strikeouts
4
Player Box Score
Houston Astros
| Player | H-AB | AB | R | H | RBI | HR | BB | K | #P | AVG | OBP | SLG |
|---|---|---|---|---|---|---|---|---|---|---|---|---|
 Jeremy Pena | 0-3 | 3 | 0 | 0 | 0 | 0 | 1 | 2 | 18 | .269 | .322 | .449 |
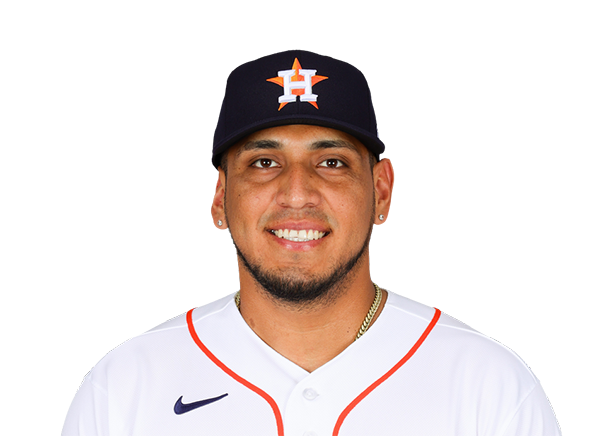 Isaac Paredes | 1-4 | 4 | 1 | 1 | 1 | 1 | 0 | 1 | 18 | .260 | .358 | .430 |
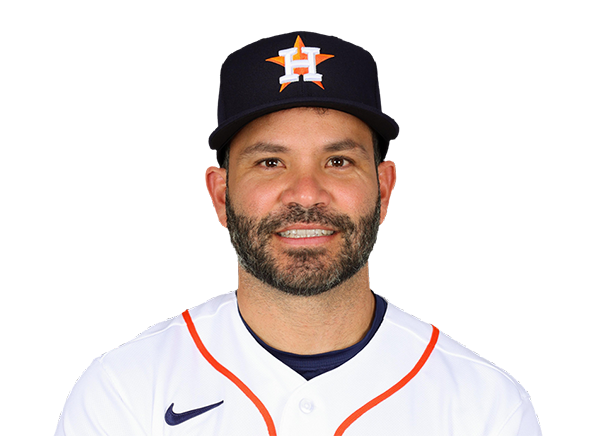 Jose Altuve | 1-3 | 3 | 1 | 1 | 0 | 0 | 1 | 1 | 17 | .247 | .308 | .400 |
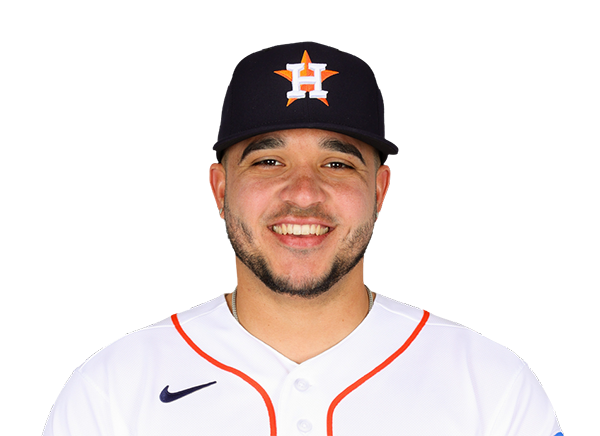 Yainer Diaz | 3-4 | 4 | 0 | 3 | 1 | 0 | 0 | 0 | 11 | .279 | .307 | .435 |
 Daulton Varsho | 0-4 | 4 | 0 | 0 | 0 | 0 | 0 | 3 | 16 | .226 | .289 | .360 |
 Christian Walker | 0-4 | 4 | 0 | 0 | 0 | 0 | 0 | 1 | 12 | .225 | .298 | .418 |
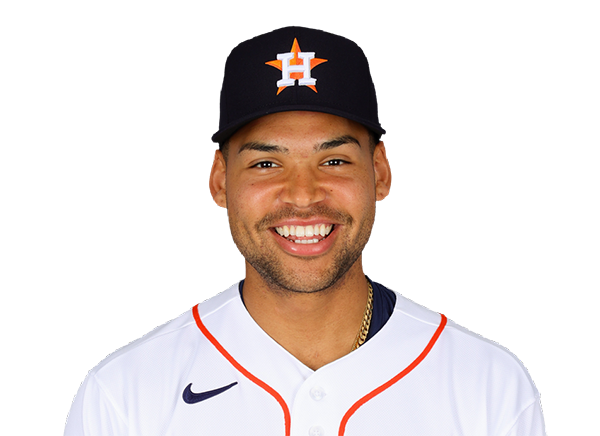 Cam Smith | 0-4 | 4 | 0 | 0 | 0 | 0 | 0 | 2 | 18 | .217 | .283 | .405 |
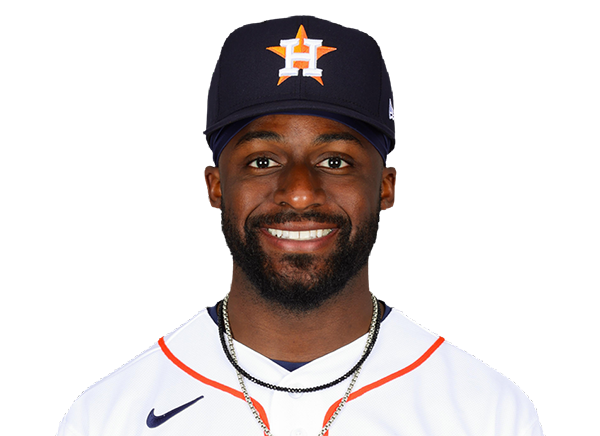 Taylor Trammell | 0-3 | 3 | 0 | 0 | 0 | 0 | 1 | 1 | 16 | .207 | .292 | .358 |
 Christian Vazquez | 0-3 | 3 | 0 | 0 | 0 | 0 | 0 | 3 | 13 | .208 | .263 | .326 |
Tampa Bay Rays
| Player | H-AB | AB | R | H | RBI | HR | BB | K | #P | AVG | OBP | SLG |
|---|---|---|---|---|---|---|---|---|---|---|---|---|
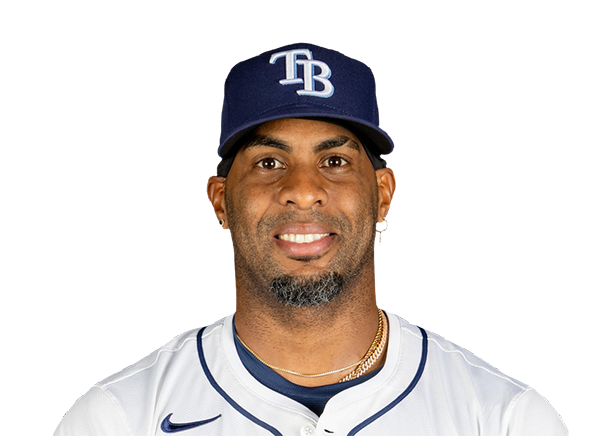 Yandy Diaz | 0-4 | 4 | 0 | 0 | 0 | 0 | 0 | 1 | 12 | .301 | .366 | .464 |
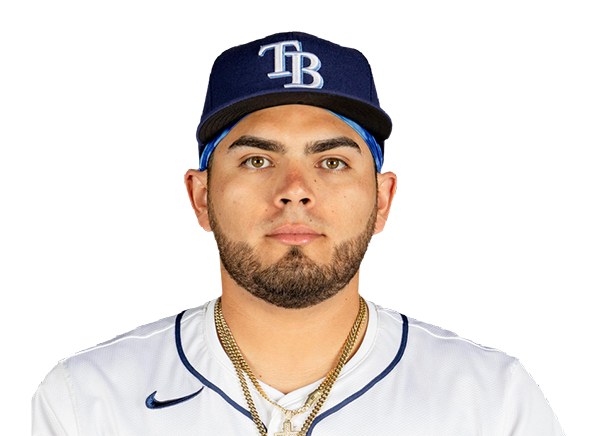 Jonathan Aranda | 1-3 | 3 | 0 | 1 | 0 | 0 | 1 | 0 | 18 | .277 | .360 | .426 |
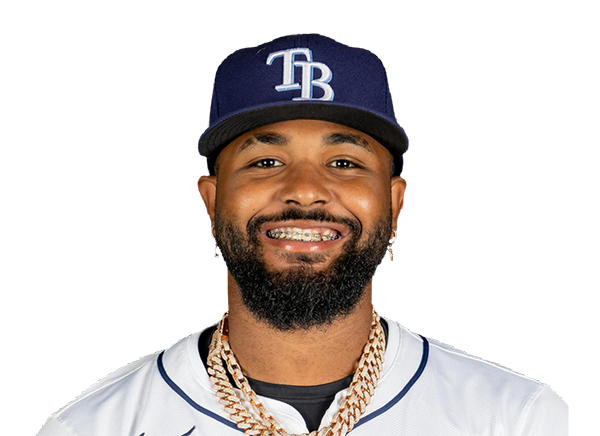 Junior Caminero | 1-4 | 4 | 0 | 1 | 0 | 0 | 0 | 0 | 17 | .279 | .365 | .532 |
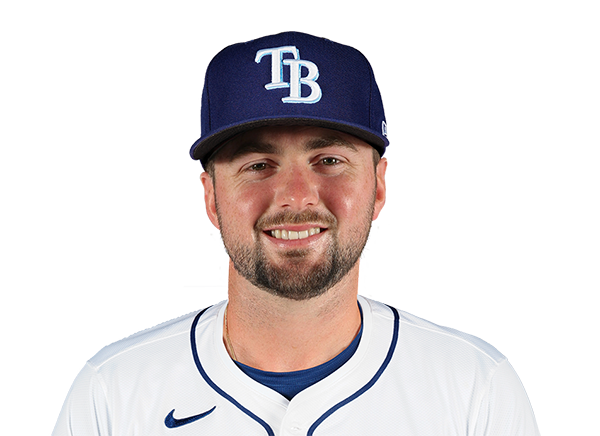 Liam Hicks | 1-3 | 3 | 0 | 1 | 0 | 0 | 0 | 0 | 13 | .286 | .368 | .442 |
 Kenny Piper | 0-0 | 0 | 1 | 0 | 0 | 0 | 0 | 0 | 0 | .222 | .364 | .556 |
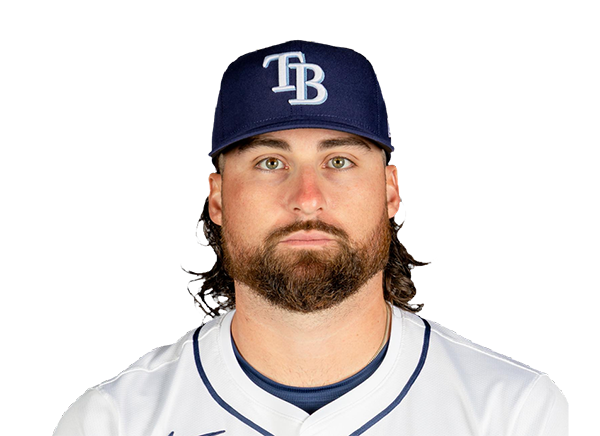 Ryan Vilade | 0-0 | 0 | 0 | 0 | 0 | 0 | 1 | 0 | 5 | .262 | .329 | .472 |
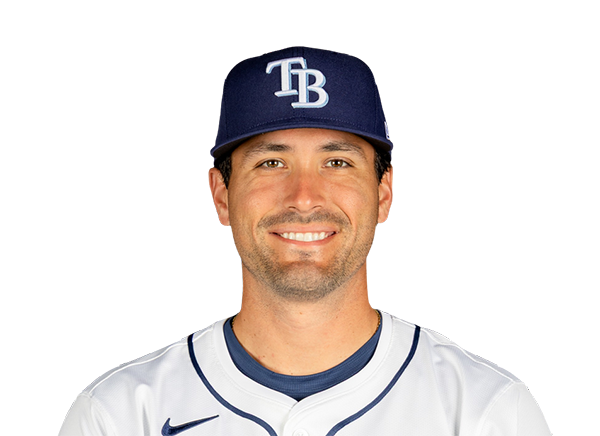 Nick Fortes | 0-0 | 0 | 0 | 0 | 0 | 0 | 0 | 0 | 0 | .263 | .307 | .361 |
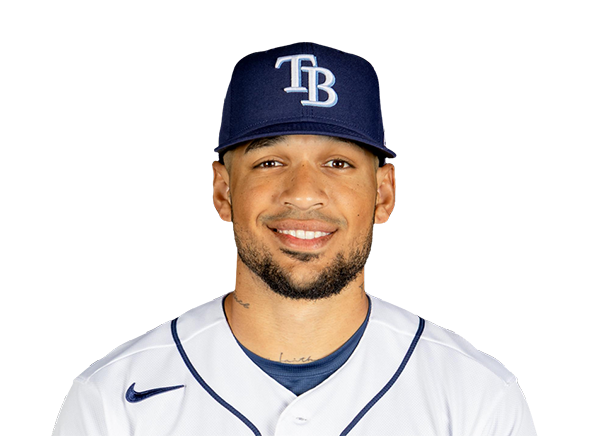 Victor Mesa Jr. | 1-2 | 2 | 1 | 1 | 0 | 0 | 2 | 1 | 23 | .253 | .324 | .500 |
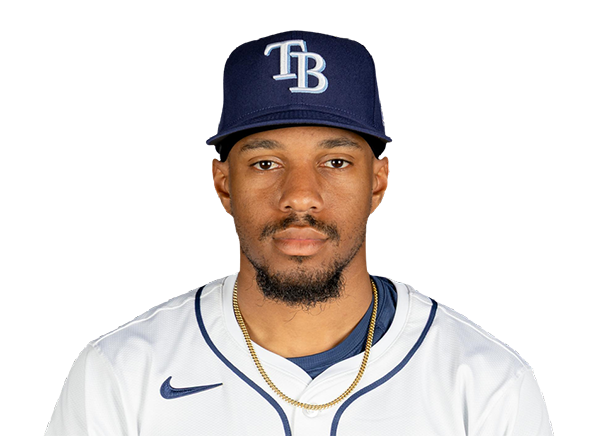 Chandler Simpson | 1-4 | 4 | 1 | 1 | 0 | 0 | 0 | 0 | 13 | .306 | .335 | .355 |
 Cedric Mullins | 0-1 | 1 | 0 | 0 | 0 | 0 | 0 | 0 | 5 | .202 | .284 | .342 |
 Nick Madrigal | 0-0 | 0 | 0 | 0 | 1 | 0 | 0 | 0 | 3 | .255 | .357 | .277 |
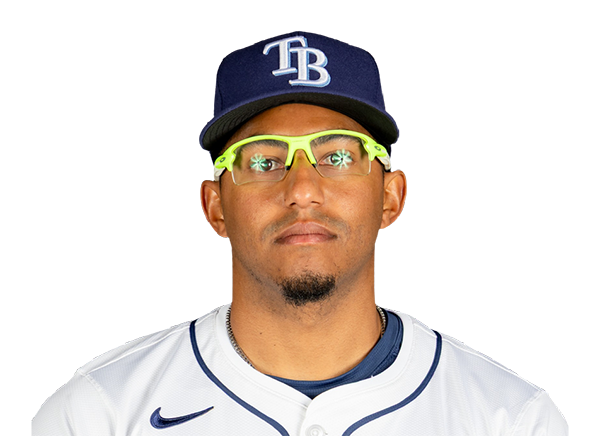 Richie Palacios | 1-2 | 2 | 0 | 1 | 2 | 0 | 0 | 0 | 8 | .232 | .328 | .368 |
 Jonny DeLuca | 1-1 | 1 | 0 | 1 | 0 | 0 | 0 | 0 | 1 | .264 | .297 | .419 |
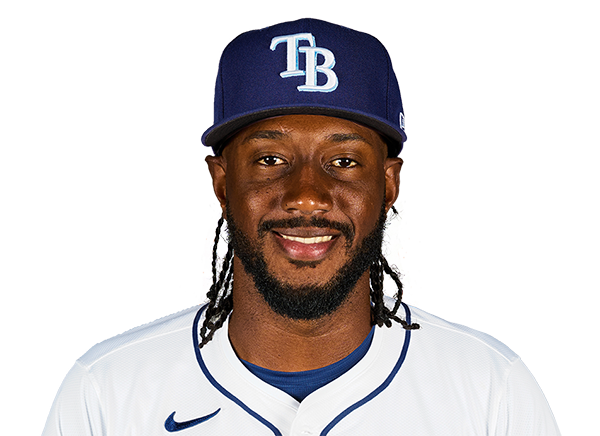 Jorge Mateo | 0-3 | 3 | 0 | 0 | 0 | 0 | 0 | 2 | 11 | .207 | .254 | .326 |
Houston Astros
| Player | IP | H | R | ER | BB | K | HR | PC-ST | ERA | PC |
|---|---|---|---|---|---|---|---|---|---|---|
 Peter Lambert | 6.0 | 6 | 3 | 3 | 0 | 4 | 0 | 85-62 | 3.71 | 85 |
 Bennett Sousa | 0.2 | 0 | 0 | 0 | 1 | 0 | 0 | 13-7 | 5.40 | 13 |
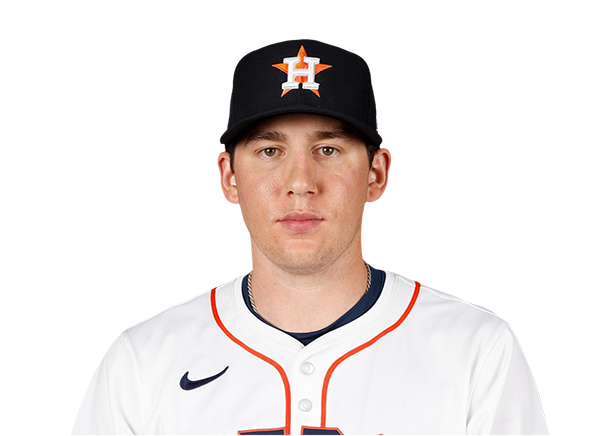 AJ Blubaugh | 1.0 | 1 | 0 | 0 | 2 | 0 | 0 | 24-11 | 3.30 | 24 |
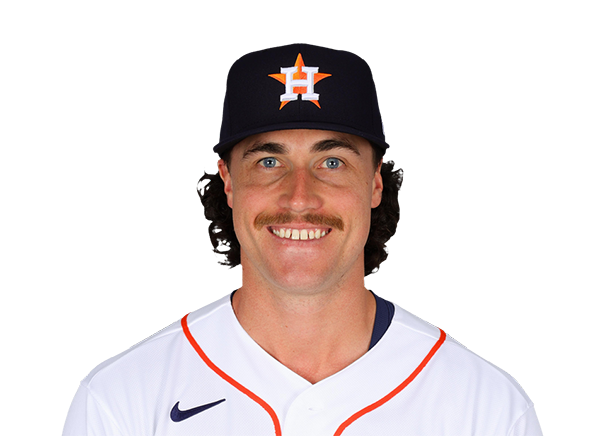 Bryan King | 0.1 | 0 | 0 | 0 | 1 | 0 | 0 | 7-2 | 5.01 | 7 |
Tampa Bay Rays
| Player | IP | H | R | ER | BB | K | HR | PC-ST | ERA | PC |
|---|---|---|---|---|---|---|---|---|---|---|
 Ian Seymour | 6.0 | 4 | 2 | 2 | 1 | 10 | 1 | 79-58 | 4.27 | 79 |
 Tyler Wells | 1.0 | 0 | 0 | 0 | 1 | 2 | 0 | 15-9 | 2.38 | 15 |
 Ty Johnson | 0.2 | 0 | 0 | 0 | 1 | 1 | 0 | 25-16 | 3.86 | 25 |
 Bryan Baker | 1.1 | 1 | 0 | 0 | 0 | 1 | 0 | 20-11 | 1.54 | 20 |
H2H / Season Series
TB3–2
HOU
TB3–1
HOU
HOU2–0
TB
HOU10–8
TB
HOU1–3
TB
Last 5 Games
| Date | Opponent | Result |
|---|---|---|
| Sep 12 | @ TB | L2–3 |
| Sep 11 | @ TB | L1–3 |
| Sep 10 |  @ PHI | W2–1 |
| Sep 9 | @ PHI | L7–11 |
| Sep 8 | @ PHI | W6–5 |
| Date | Opponent | Result |
|---|---|---|
| Sep 12 | vs HOU | W3–2 |
| Sep 11 | vs HOU | W3–1 |
| Sep 10 |  @ ATL | L1–3 |
| Sep 9 | @ ATL | W7–2 |
| Sep 8 | @ ATL | W7–1 |
Standings
American League
| Team | W | L | PCT | GB | DIFF | STRK |
|---|---|---|---|---|---|---|
| 1Rays | 89 | 59 | .601 | - | +59 | W2 |
2 White Sox | 76 | 72 | .514 | 13 | +36 | W1 |
| 3Astros | 75 | 74 | .503 | 14.5 | -43 | L2 |
4 Yankees | 85 | 63 | .574 | 4 | +123 | L1 |
5 Red Sox | 81 | 68 | .544 | 8.5 | +85 | W1 |
6 Guardians | 75 | 74 | .503 | 14.5 | -14 | L1 |
7 Blue Jays | 74 | 75 | .497 | 15.5 | -38 | W1 |
8 Rangers | 73 | 76 | .490 | 16.5 | -45 | W1 |
9 Orioles | 72 | 77 | .483 | 17.5 | -28 | L1 |
10 Twins | 70 | 78 | .473 | 19 | -55 | W1 |
11 Mariners | 70 | 79 | .470 | 19.5 | -57 | W1 |
12 Tigers | 69 | 79 | .466 | 20 | +63 | W3 |
13 Royals | 66 | 83 | .443 | 23.5 | -91 | L1 |
14 Athletics | 60 | 89 | .403 | 29.5 | -204 | L1 |
15 Angels | 56 | 92 | .378 | 33 | -75 | L2 |
National League
| Team | W | L | PCT | GB | DIFF | STRK |
|---|---|---|---|---|---|---|
1 Brewers | 93 | 56 | .624 | - | +196 | W5 |
2 Dodgers | 90 | 58 | .608 | 2.5 | +172 | L1 |
| 3Braves | 88 | 61 | .591 | 5 | +121 | W3 |
4 Cubs | 83 | 66 | .557 | 10 | +139 | W2 |
| 5Phillies | 82 | 67 | .550 | 11 | +26 | L3 |
6 Padres | 80 | 68 | .541 | 12.5 | +20 | W6 |
7 Diamondbacks | 79 | 70 | .530 | 14 | +3 | L1 |
8 Pirates | 74 | 75 | .497 | 19 | +25 | L2 |
9 Marlins | 73 | 76 | .490 | 20 | +4 | W1 |
10 Cardinals | 73 | 76 | .490 | 20 | -9 | L1 |
11 Reds | 69 | 79 | .466 | 23.5 | -146 | L5 |
12 Mets | 69 | 79 | .466 | 23.5 | -32 | W1 |
13 Nationals | 69 | 81 | .460 | 24.5 | +2 | W2 |
14 Giants | 62 | 87 | .416 | 31 | -75 | L2 |
15 Rockies | 55 | 93 | .372 | 37.5 | -162 | L6 |
HOU
VS
TB
Pitchers
Peter Lambert
Catchers
Christian Vazquez
Infielders
Jeremy Pena
Isaac Paredes
Jose Altuve
Christian Walker
Outfielders
Daulton Varsho
Cam Smith
Taylor Trammell
Designated Hitters
Yainer Diaz
Pitchers
Ian Seymour
Catchers
Liam Hicks
Infielders
Jonathan Aranda
Junior Caminero
Richie Palacios
Jorge Mateo
Outfielders
Victor Mesa Jr.
Chandler Simpson
Cedric Mullins
Designated Hitters
Yandy Diaz
Astros
VS
Rays
Batting
149
Team Games Played
148
5008
At Bats
4969
1205
Hits
1291
634
Runs Batted In
636
194
Home Runs
157
45
Stolen Bases
150
.241
Batting Average
.260
665
Runs
668
221
Doubles
203
18
Triples
21
2044
Total Bases
2007
485
Walks
472
1226
Strikeouts
1026
.314
On Base Percentage
.328
.408
Slugging Percentage
.404
.722
OBP Pct + SLG Pct
.732
149
Games Played
148
149
Games Started
148
70
Hit By Pitch
56
0.0
Wins Above Replacement
0.0
0.0
Offensive Wins Above Replacement
0.0
20
Caught Stealing
52
1
Is Qualified
1
645.3
Runs Created
670.9
4.4
Runs Created Per 27 Outs
4.6
.086
Walks Per Plate Appearance
.084
0.40
Walk To Strikeout Ratio
0.46
.168
Isolated Power
.144
.269
Secondary Average
.259
3.87
Pitches Per Plate Appearance
3.76
433
Extra Base Hits
381
5619
Plate Appearances
5587
25.8
At Bats Per Home Run
31.6
18
Sacrifice Hit
45
36
Sacrifice Flies
42
Pitching
149
Team Games Played
148
43
Quality Starts
52
75
Wins
89
74
Losses
59
47
Saves
56
80
Holds
109
1175
Hits
1141
662
Earned runs
554
188
Home Runs
183
602
Walks
370
1300
Strikeouts
1197
8.9
Strikeouts Per 9 Innings
8.2
151.7
Pitches Per Start
139.1
1.34
Walks Plus Hits Per Inning Pitched
1.14
4.51
Earned Run Average
3.77
74
Losses
59
1321.2
Innings pitched
1321.0
.503
Win Percentage
.601
58
Save Opportunities
73
.238
Opponent Batting Average
.230
.329
Opponent's On-base pct.
.288
.401
Opponent's Slugging pct.
.392
.730
Opponent's OPB Pct + SLG Pct
.680
4943
At Bats
4953
201
Doubles
218
22
Triples
16
87
Batters Hit
51
120
Stolen Bases
118
149
Games Played
148
0
Complete Games
1
9
Shutouts
12
48
Wild Pitches
36
677
Runs Batted In
581
6
Balks
3
1321.2
Innings pitched
1321.0
8.9
Strikeouts Per 9 Innings
8.2
39
Caught Stealing
33
149
Games Started
148
0.0
Wins Above Replacement
0.0
1
Is Qualified
1
708
Runs
609
662
Earned Runs
554
1984
Total Bases
1940
Fielding
149
Team Games Played
148
1322
Full Innings
1321
5135
Total Chances
5221
3965
Putouts
3963
1104
Assists
1171
66
Errors
87
221
Double Plays
203
0.987
Fielding Percentage
0.983
34.5
Range Factor
35.0
0.0
Zone Rating
0.0
149
Games Played
148
0
Games Started
0
0.0
Defensive Wins Above Replacement
0.0
1
Qualified
1