

Astros vs Rockies Live Score (8 Apr, 2026)
Game Information
Stage
Standard
Season
2026
First Pitch
Tue, Apr 7, 8:40 pm
Venue
Coors Field
Location
Denver, Colorado
Attendance
17,328
Live Situation
0Balls
1Strikes
0Outs
—Pitcher
—At Bat
Pitch Sequence
1
STRIKE LOOKING
Cutter
93 MPH
2
BALL IN PLAY
Slider
86 MPH
Injury Report


Team Stats
 HOU
COL


1
Runs
5
3
Hits
10
0
Errors
1
1
Home Runs
2
1
Walks
2
8
Strikeouts
4
Player Box Score
Houston Astros
| Player | H-AB | AB | R | H | RBI | HR | BB | K | #P | AVG | OBP | SLG |
|---|---|---|---|---|---|---|---|---|---|---|---|---|
 Jeremy Pena | 0-3 | 3 | 0 | 0 | 0 | 0 | 1 | 0 | 14 | .267 | .333 | .400 |
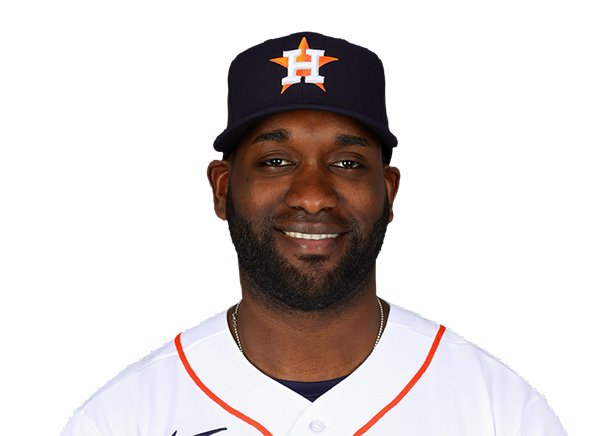 Yordan Alvarez | 0-3 | 3 | 0 | 0 | 0 | 0 | 0 | 0 | 10 | .324 | .519 | .730 |
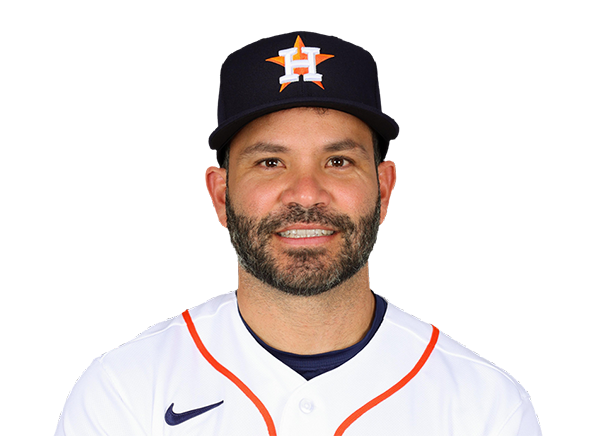 Jose Altuve | 0-4 | 4 | 0 | 0 | 0 | 0 | 0 | 3 | 15 | .341 | .491 | .585 |
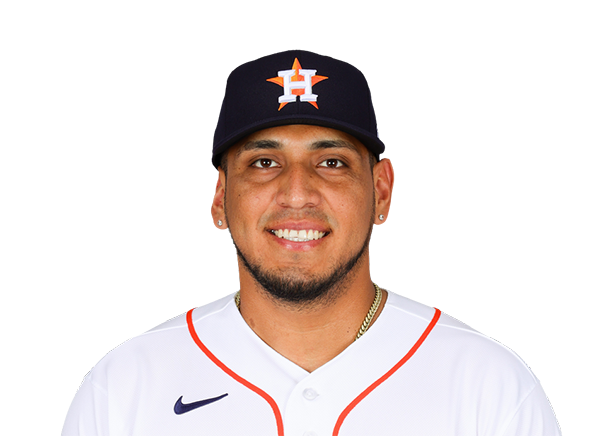 Isaac Paredes | 1-4 | 4 | 0 | 1 | 0 | 0 | 0 | 2 | 14 | .231 | .333 | .385 |
 Christian Walker | 1-4 | 4 | 1 | 1 | 1 | 1 | 0 | 0 | 10 | .326 | .392 | .652 |
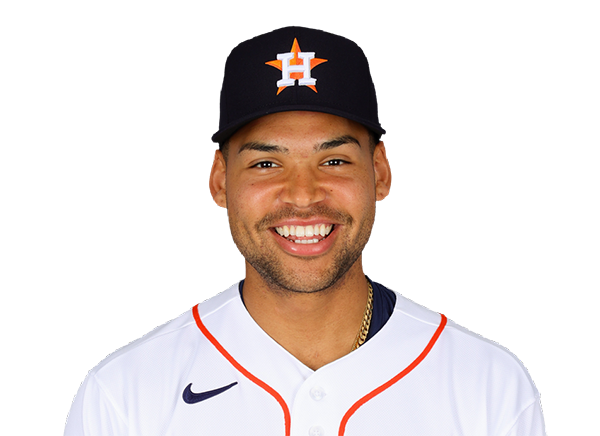 Cam Smith | 1-3 | 3 | 0 | 1 | 0 | 0 | 0 | 1 | 17 | .300 | .417 | .575 |
 Jake Meyers | 0-3 | 3 | 0 | 0 | 0 | 0 | 0 | 0 | 5 | .243 | .326 | .378 |
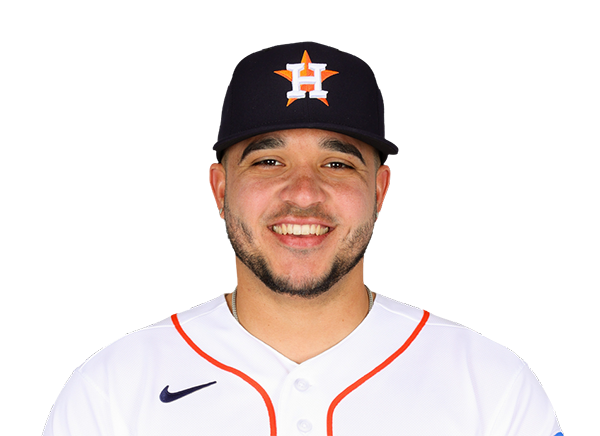 Yainer Diaz | 0-3 | 3 | 0 | 0 | 0 | 0 | 0 | 0 | 6 | .225 | .273 | .250 |
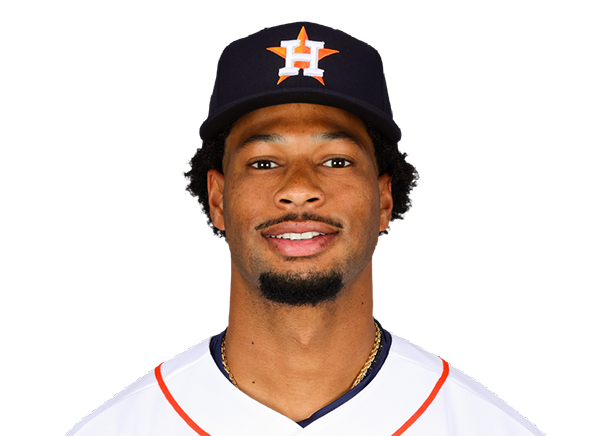 Brice Matthews | 0-2 | 2 | 0 | 0 | 0 | 0 | 0 | 1 | 9 | .105 | .190 | .316 |
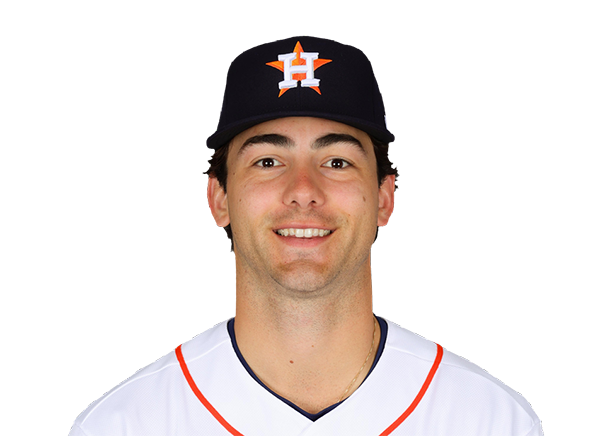 Joey Loperfido | 0-1 | 1 | 0 | 0 | 0 | 0 | 0 | 1 | 7 | .276 | .353 | .379 |
Colorado Rockies
| Player | H-AB | AB | R | H | RBI | HR | BB | K | #P | AVG | OBP | SLG |
|---|---|---|---|---|---|---|---|---|---|---|---|---|
 Edouard Julien | 1-3 | 3 | 0 | 1 | 0 | 0 | 0 | 0 | 16 | .211 | .250 | .263 |
 Hunter Goodman | 0-1 | 1 | 0 | 0 | 0 | 0 | 0 | 0 | 3 | .238 | .273 | .333 |
 Mickey Moniak | 1-4 | 4 | 1 | 1 | 2 | 1 | 0 | 0 | 11 | .278 | .278 | .778 |
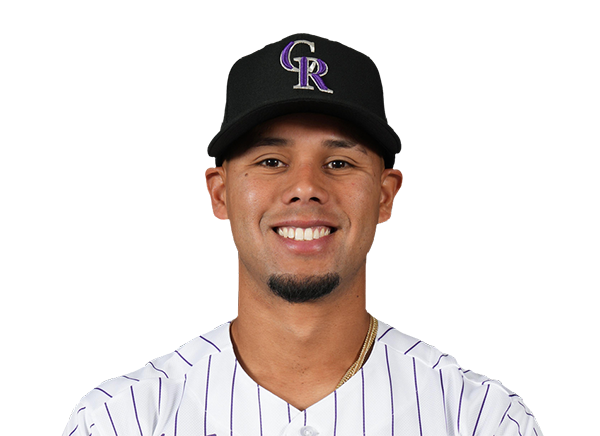 Ezequiel Tovar | 0-4 | 4 | 0 | 0 | 0 | 0 | 0 | 1 | 14 | .244 | .262 | .366 |
 Troy Johnston | 1-4 | 4 | 1 | 1 | 0 | 0 | 0 | 1 | 15 | .324 | .343 | .559 |
 TJ Rumfield | 2-3 | 3 | 1 | 2 | 0 | 0 | 1 | 0 | 20 | .389 | .450 | .639 |
 Willi Castro | 3-4 | 4 | 1 | 3 | 3 | 1 | 0 | 1 | 16 | .250 | .318 | .400 |
 Jordan Beck | 0-3 | 3 | 0 | 0 | 0 | 0 | 0 | 0 | 11 | .080 | .148 | .120 |
 Brenton Doyle | 0-0 | 0 | 0 | 0 | 0 | 0 | 0 | 0 | 0 | .129 | .206 | .161 |
 Brett Sullivan | 1-3 | 3 | 0 | 1 | 0 | 0 | 0 | 0 | 6 | .308 | .357 | .308 |
 Kyle Karros | 1-2 | 2 | 1 | 1 | 0 | 0 | 1 | 1 | 10 | .226 | .314 | .258 |
Houston Astros
| Player | IP | H | R | ER | BB | K | HR | PC-ST | ERA | PC |
|---|---|---|---|---|---|---|---|---|---|---|
 Mike Burrows | 5.1 | 8 | 3 | 3 | 1 | 3 | 1 | 87-58 | 5.63 | 87 |
 Steven Okert | 1.0 | 1 | 1 | 1 | 1 | 0 | 0 | 13-8 | 5.40 | 13 |
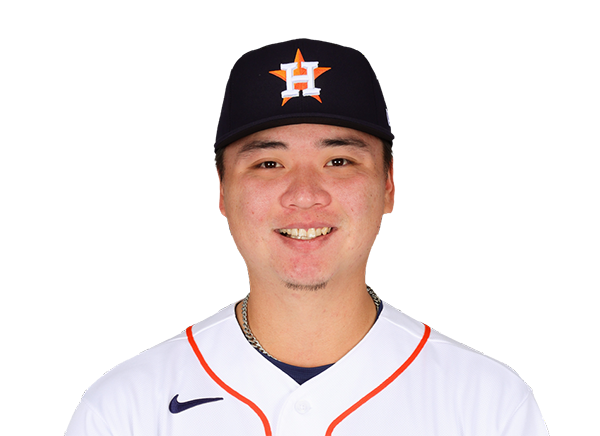 Kai-Wei Teng | 0.2 | 1 | 1 | 1 | 0 | 0 | 1 | 7-7 | 2.84 | 7 |
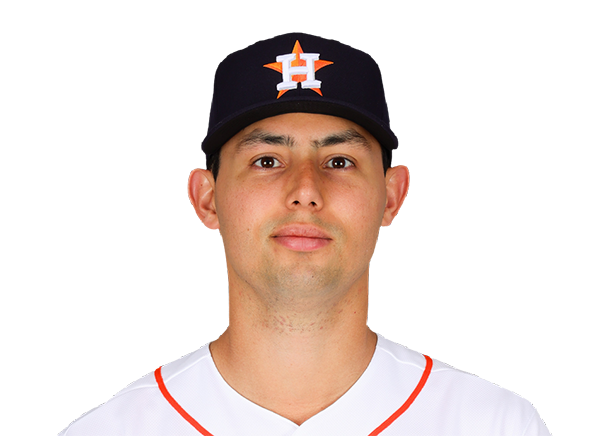 Christian Roa | 1.0 | 0 | 0 | 0 | 0 | 1 | 0 | 15-10 | 3.00 | 15 |
Colorado Rockies
| Player | IP | H | R | ER | BB | K | HR | PC-ST | ERA | PC |
|---|---|---|---|---|---|---|---|---|---|---|
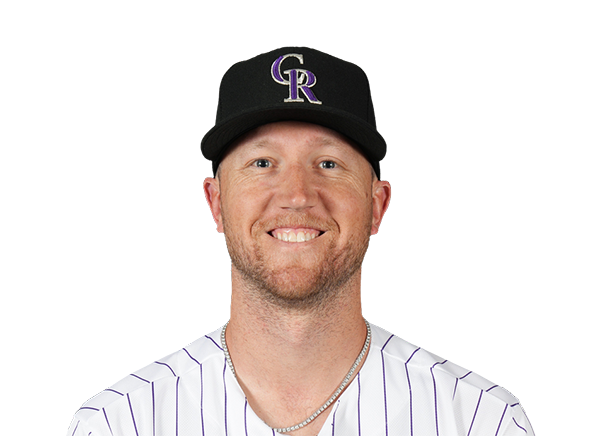 Kyle Freeland | 6.1 | 3 | 1 | 1 | 1 | 5 | 1 | 81-55 | 2.30 | 81 |
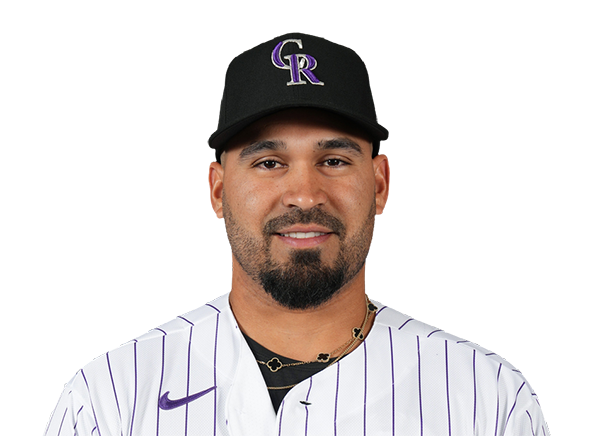 Antonio Senzatela | 2.2 | 0 | 0 | 0 | 0 | 3 | 0 | 26-18 | 0.00 | 26 |
H2H / Season Series
HOU2–3
COL
HOU3–1
COL
HOU7–6
COL
COL9–1
HOU
COL5–1
HOU
COL9–7
HOU
Last 5 Games
| Date | Opponent | Result |
|---|---|---|
| Aug 22 |  vs ATH | L3–4 |
| Aug 21 | vs ATH | W4–0 |
| Aug 20 |  vs LAA | L3–18 |
| Aug 19 | vs LAA | W3–2 |
| Aug 18 | vs LAA | L1–3 |
| Date | Opponent | Result |
|---|---|---|
| Aug 22 |  vs CLE | L3–4 |
| Aug 21 | vs CLE | L1–9 |
| Aug 19 |  vs LAD | L4–6 |
| Aug 18 | vs LAD | L6–7 |
| Aug 17 | vs LAD | L5–11 |
Standings
American League
| Team | W | L | PCT | GB | DIFF | STRK |
|---|---|---|---|---|---|---|
1 Rays | 76 | 53 | .589 | - | +42 | L3 |
2 White Sox | 67 | 62 | .519 | 9 | +42 | L1 |
| 3Astros | 65 | 65 | .500 | 11.5 | -43 | L1 |
4 Yankees | 73 | 56 | .566 | 3 | +95 | L1 |
5 Red Sox | 70 | 59 | .543 | 6 | +98 | W2 |
6 Rangers | 64 | 66 | .492 | 12.5 | -48 | L1 |
| 7Guardians | 64 | 66 | .492 | 12.5 | -14 | W3 |
8 Blue Jays | 64 | 67 | .489 | 13 | -50 | W1 |
9 Twins | 63 | 67 | .485 | 13.5 | -47 | L2 |
10 Orioles | 63 | 67 | .485 | 13.5 | -33 | W2 |
11 Mariners | 62 | 68 | .477 | 14.5 | -44 | W2 |
12 Tigers | 61 | 68 | .473 | 15 | +77 | L4 |
13 Royals | 57 | 74 | .435 | 20 | -95 | W7 |
| 14Angels | 52 | 78 | .400 | 24.5 | -68 | W1 |
| 15Athletics | 50 | 80 | .385 | 26.5 | -188 | W1 |
National League
| Team | W | L | PCT | GB | DIFF | STRK |
|---|---|---|---|---|---|---|
1 Brewers | 81 | 49 | .623 | - | +163 | W3 |
| 2Dodgers | 79 | 51 | .608 | 2 | +147 | W5 |
3 Braves | 75 | 55 | .577 | 6 | +108 | L2 |
4 Cubs | 74 | 56 | .569 | 7 | +98 | L3 |
5 Phillies | 72 | 58 | .554 | 9 | +25 | W8 |
6 Padres | 70 | 60 | .538 | 11 | +9 | W2 |
7 Diamondbacks | 68 | 62 | .523 | 13 | +7 | L1 |
8 Marlins | 66 | 64 | .508 | 15 | +17 | W2 |
9 Cardinals | 66 | 65 | .504 | 15.5 | 0 | L2 |
10 Pirates | 63 | 68 | .481 | 18.5 | +29 | L2 |
11 Reds | 62 | 68 | .477 | 19 | -92 | W1 |
12 Nationals | 61 | 70 | .466 | 20.5 | +14 | L3 |
13 Mets | 59 | 71 | .454 | 22 | -39 | W1 |
14 Giants | 52 | 77 | .403 | 28.5 | -79 | L3 |
| 15Rockies | 50 | 79 | .388 | 30.5 | -131 | L5 |
HOU
VS
COL
Pitchers
Mike Burrows
Steven Okert
Kai-Wei Teng
Christian Roa
Catchers
Yainer Diaz
Infielders
Jeremy Pena
Jose Altuve
Isaac Paredes
Christian Walker
Outfielders
Cam Smith
Jake Meyers
Brice Matthews
Joey Loperfido
Designated Hitters
Yordan Alvarez
Pitchers
Kyle Freeland
Antonio Senzatela
Catchers
Brett Sullivan
Infielders
Ezequiel Tovar
TJ Rumfield
Willi Castro
Kyle Karros
Outfielders
Mickey Moniak
Troy Johnston
Jordan Beck
Brenton Doyle
Designated Hitters
Edouard Julien
Hunter Goodman
Astros
VS
Rockies
Batting
130
Team Games Played
129
4367
At Bats
4377
1058
Hits
1106
561
Runs Batted In
591
171
Home Runs
144
40
Stolen Bases
88
.242
Batting Average
.253
590
Runs
615
193
Doubles
235
13
Triples
26
1790
Total Bases
1825
430
Walks
406
1062
Strikeouts
1116
.317
On Base Percentage
.322
.410
Slugging Percentage
.417
.727
OBP Pct + SLG Pct
.739
130
Games Played
129
0
Games Started
0
61
Hit By Pitch
63
0.0
Wins Above Replacement
0.0
0.0
Offensive Wins Above Replacement
0.0
19
Caught Stealing
34
1
Is Qualified
1
568.0
Runs Created
598.7
4.4
Runs Created Per 27 Outs
4.7
.088
Walks Per Plate Appearance
.083
0.40
Walk To Strikeout Ratio
0.36
.168
Isolated Power
.164
.271
Secondary Average
.269
3.88
Pitches Per Plate Appearance
3.74
377
Extra Base Hits
405
4910
Plate Appearances
4907
25.5
At Bats Per Home Run
30.4
17
Sacrifice Hit
15
33
Sacrifice Flies
45
Pitching
130
Team Games Played
129
36
Quality Starts
21
65
Wins
50
65
Losses
79
39
Saves
29
65
Holds
50
1037
Hits
1303
592
Earned runs
697
171
Home Runs
180
537
Walks
420
1133
Strikeouts
875
8.8
Strikeouts Per 9 Innings
6.9
0.0
Pitches Per Start
0.0
1.36
Walks Plus Hits Per Inning Pitched
1.52
4.62
Earned Run Average
5.53
65
Losses
79
1154.1
Innings pitched
1134.2
.500
Win Percentage
.388
48
Save Opportunities
49
.239
Opponent Batting Average
.288
.332
Opponent's On-base pct.
.351
.406
Opponent's Slugging pct.
.490
.738
Opponent's OPB Pct + SLG Pct
.841
4330
At Bats
4521
169
Doubles
290
19
Triples
42
77
Batters Hit
51
105
Stolen Bases
100
130
Games Played
129
0
Complete Games
1
0
Shutouts
0
43
Wild Pitches
34
0
Runs Batted In
0
5
Balks
5
1154.1
Innings pitched
1134.2
8.8
Strikeouts Per 9 Innings
6.9
34
Caught Stealing
20
130
Games Started
129
0.0
Wins Above Replacement
0.0
1
Is Qualified
1
633
Runs
746
588
Earned Runs
693
1757
Total Bases
2217
Fielding
130
Team Games Played
129
1154
Full Innings
1135
4484
Total Chances
4580
3463
Putouts
3404
962
Assists
1092
59
Errors
84
193
Double Plays
235
0.987
Fielding Percentage
0.982
34.5
Range Factor
35.7
0.0
Zone Rating
0.0
130
Games Played
129
0
Games Started
0
0.0
Defensive Wins Above Replacement
0.0
1
Qualified
1