

Athletics vs Angels Live Score (20 May, 2026)
Game Information
Stage
Standard
Season
2026
First Pitch
Tue, May 19, 9:38 pm
Venue
Angel Stadium
Location
Anaheim, California
Attendance
23,803
Live Situation
2Balls
3Strikes
0Outs
—Pitcher
—At Bat
Pitch Sequence
1
STRIKE LOOKING
Cutter
90 MPH
2
BALL
Sinker
94 MPH
3
STRIKE FOUL
Curve
81 MPH
4
BALL
Four-seam FB
94 MPH
5
STRIKE SWINGING
Sinker
93 MPH
Injury Report
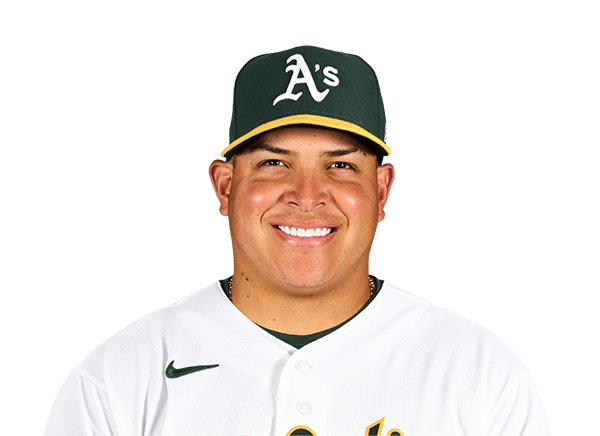

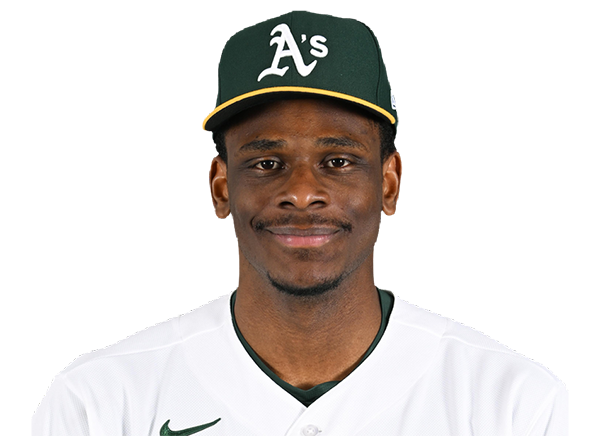
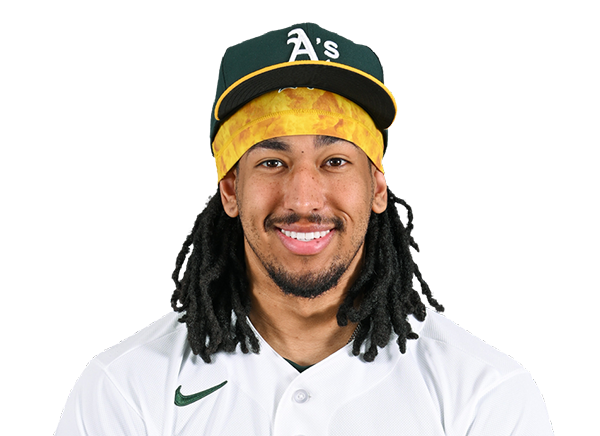
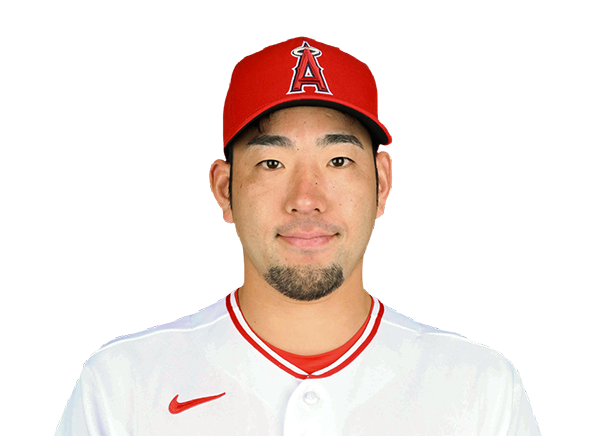

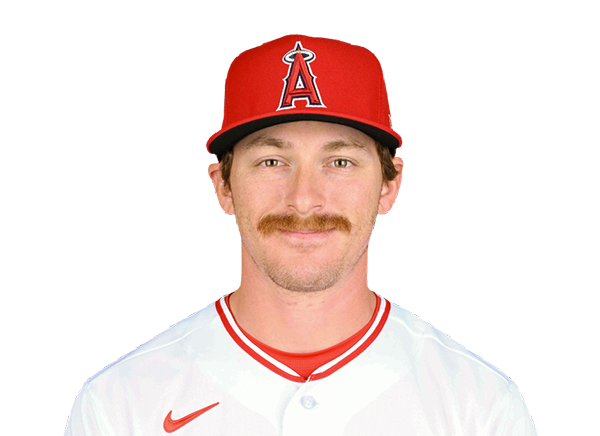
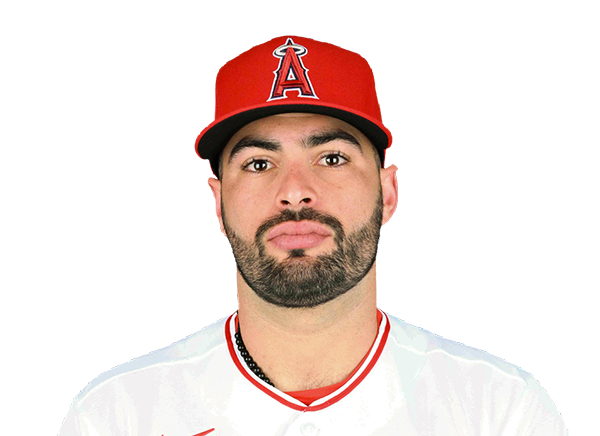

Team Stats
 ATH
LAA


14
Runs
6
15
Hits
11
0
Errors
0
2
Home Runs
1
4
Walks
3
9
Strikeouts
5
Player Box Score
Athletics
| Player | H-AB | AB | R | H | RBI | HR | BB | K | #P | AVG | OBP | SLG |
|---|---|---|---|---|---|---|---|---|---|---|---|---|
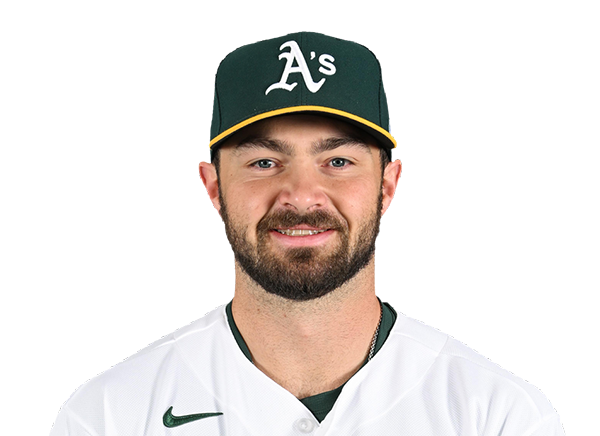 Shea Langeliers | 0-4 | 4 | 1 | 0 | 0 | 0 | 2 | 2 | 24 | .328 | .394 | .588 |
 Nick Kurtz | 3-5 | 5 | 2 | 3 | 5 | 0 | 0 | 0 | 12 | .276 | .431 | .488 |
 Colby Thomas | 1-3 | 3 | 1 | 1 | 2 | 0 | 0 | 1 | 12 | .344 | .382 | .500 |
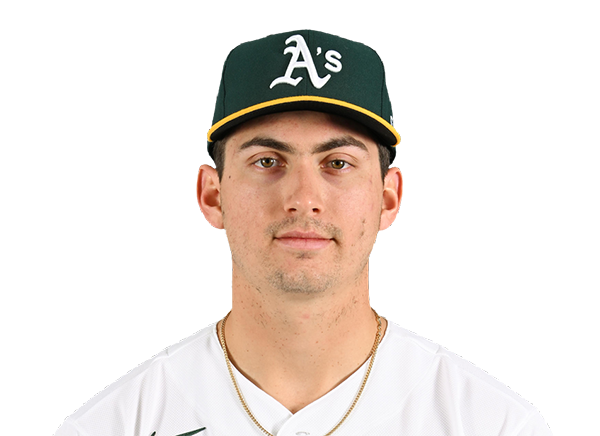 Tyler Soderstrom | 0-2 | 2 | 0 | 0 | 0 | 0 | 0 | 0 | 5 | .188 | .272 | .371 |
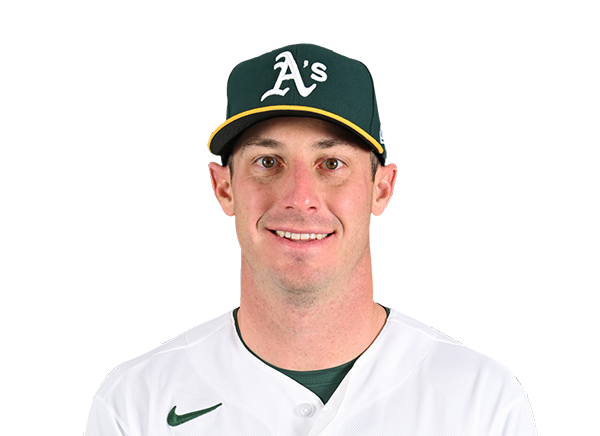 Brent Rooker | 2-4 | 4 | 2 | 2 | 3 | 1 | 1 | 1 | 16 | .200 | .285 | .392 |
 Alika Williams | 0-0 | 0 | 0 | 0 | 0 | 0 | 0 | 0 | 0 | .000 | .000 | .000 |
 Henry Bolte | 1-5 | 5 | 1 | 1 | 0 | 0 | 0 | 2 | 18 | .318 | .333 | .364 |
 Zack Gelof | 3-5 | 5 | 2 | 3 | 3 | 1 | 0 | 1 | 19 | .269 | .320 | .505 |
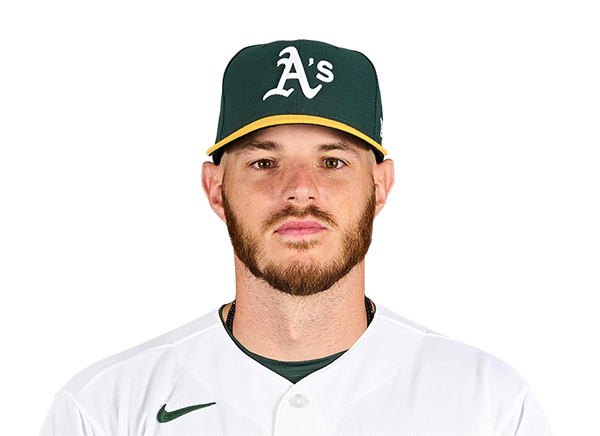 Jonah Heim | 1-5 | 5 | 1 | 1 | 0 | 0 | 0 | 1 | 17 | .100 | .100 | .150 |
 Jeff McNeil | 2-4 | 4 | 2 | 2 | 0 | 0 | 0 | 1 | 9 | .280 | .344 | .364 |
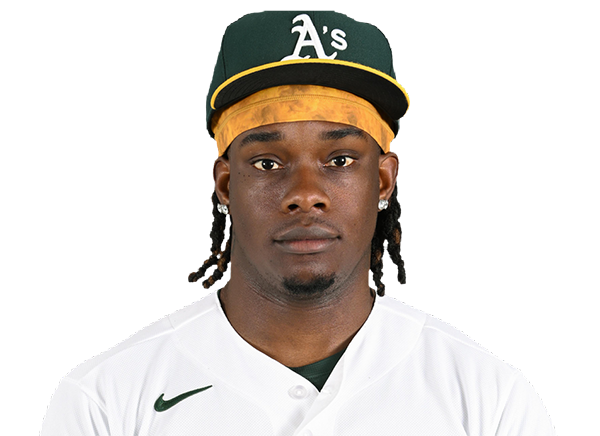 Lawrence Butler | 0-1 | 1 | 0 | 0 | 0 | 0 | 0 | 0 | 6 | .176 | .275 | .267 |
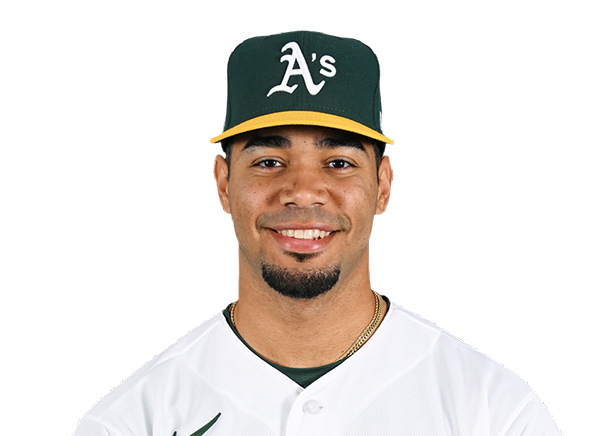 Darell Hernaiz | 2-4 | 4 | 2 | 2 | 1 | 0 | 1 | 0 | 23 | .269 | .345 | .321 |
Los Angeles Angels
| Player | H-AB | AB | R | H | RBI | HR | BB | K | #P | AVG | OBP | SLG |
|---|---|---|---|---|---|---|---|---|---|---|---|---|
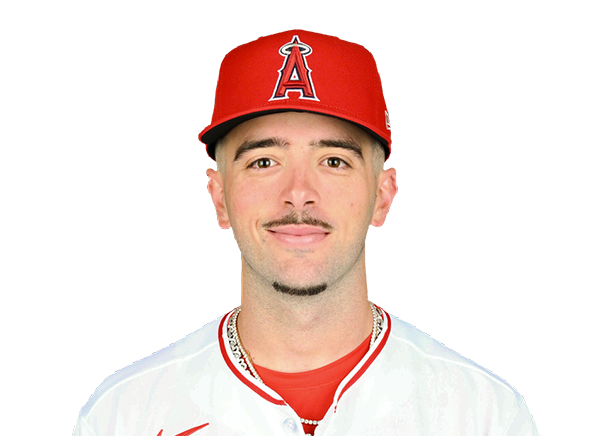 Zach Neto | 1-4 | 4 | 1 | 1 | 0 | 0 | 1 | 1 | 20 | .225 | .338 | .414 |
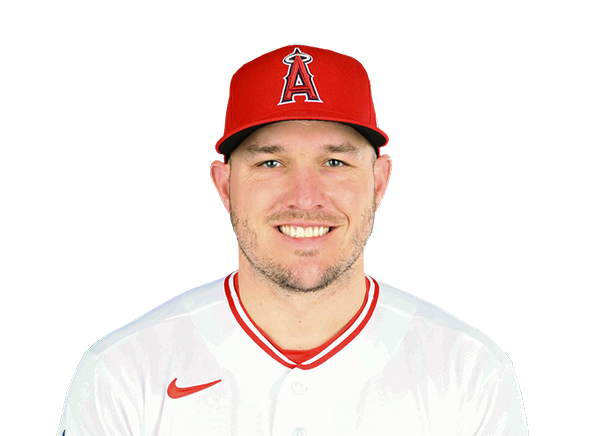 Mike Trout | 1-3 | 3 | 1 | 1 | 2 | 1 | 2 | 0 | 21 | .235 | .398 | .488 |
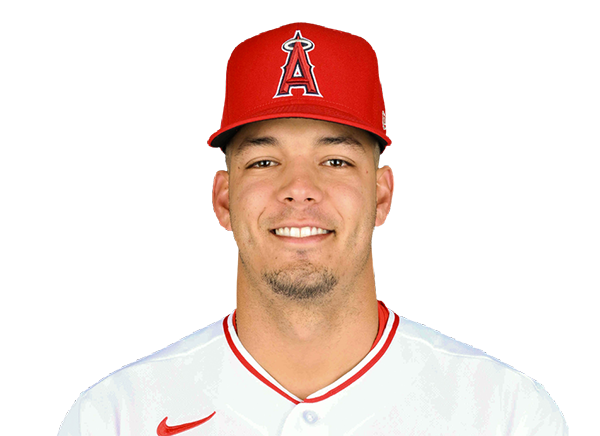 Vaughn Grissom | 1-5 | 5 | 0 | 1 | 2 | 0 | 0 | 0 | 20 | .244 | .323 | .384 |
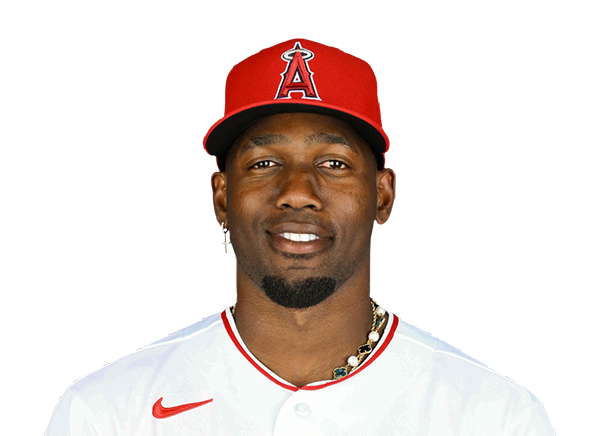 Jorge Soler | 1-5 | 5 | 0 | 1 | 0 | 0 | 0 | 0 | 16 | .213 | .305 | .415 |
 Jo Adell | 0-5 | 5 | 0 | 0 | 0 | 0 | 0 | 1 | 19 | .250 | .296 | .378 |
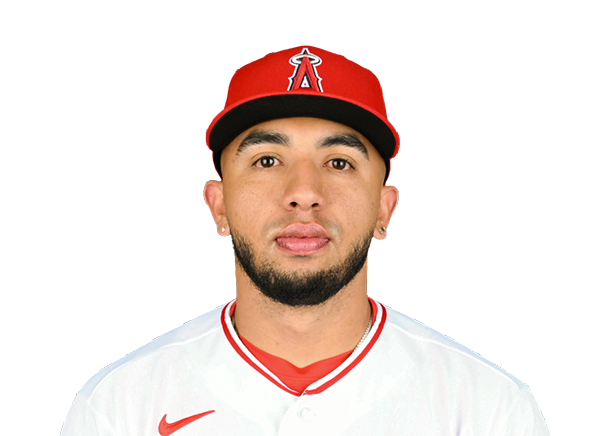 Oswald Peraza | 1-3 | 3 | 1 | 1 | 0 | 0 | 0 | 1 | 15 | .262 | .333 | .443 |
 Nolan Schanuel | 2-4 | 4 | 1 | 2 | 0 | 0 | 0 | 0 | 16 | .257 | .309 | .366 |
 Logan O'Hoppe | 2-5 | 5 | 1 | 2 | 0 | 0 | 0 | 1 | 21 | .200 | .300 | .253 |
 Jose Siri | 1-2 | 2 | 1 | 1 | 0 | 0 | 0 | 1 | 7 | .400 | .400 | .600 |
 Josh Lowe | 1-2 | 2 | 0 | 1 | 2 | 0 | 0 | 0 | 5 | .179 | .224 | .299 |
Athletics
| Player | IP | H | R | ER | BB | K | HR | PC-ST | ERA | PC |
|---|---|---|---|---|---|---|---|---|---|---|
 Jacob Lopez | 3.2 | 7 | 4 | 4 | 3 | 2 | 1 | 83-51 | 6.14 | 83 |
 Justin Sterner | 0.1 | 0 | 0 | 0 | 0 | 0 | 0 | 4-3 | 3.97 | 4 |
 Jack Perkins | 2.0 | 1 | 0 | 0 | 0 | 0 | 0 | 22-16 | 4.26 | 22 |
 Scott Barlow | 1.0 | 0 | 0 | 0 | 0 | 0 | 0 | 10-7 | 3.22 | 10 |
 Hogan Harris | 1.0 | 2 | 2 | 2 | 0 | 1 | 0 | 26-16 | 3.13 | 26 |
 Joel Kuhnel | 1.0 | 1 | 0 | 0 | 0 | 2 | 0 | 15-11 | 2.55 | 15 |
Los Angeles Angels
| Player | IP | H | R | ER | BB | K | HR | PC-ST | ERA | PC |
|---|---|---|---|---|---|---|---|---|---|---|
 Reid Detmers | 5.2 | 8 | 8 | 8 | 2 | 8 | 0 | 92-59 | 5.07 | 92 |
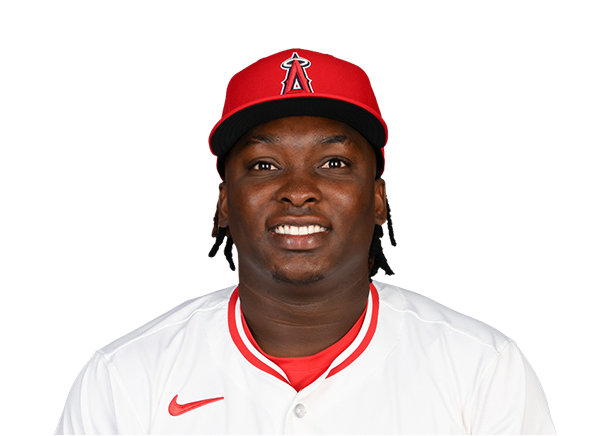 Jose Fermin | 0.1 | 1 | 0 | 0 | 1 | 0 | 0 | 15-9 | 3.86 | 15 |
 Ryan Johnson | 2.0 | 4 | 5 | 5 | 1 | 0 | 2 | 34-22 | 15.12 | 34 |
 Brent Suter | 1.0 | 2 | 1 | 1 | 0 | 1 | 0 | 20-15 | 4.50 | 20 |
H2H / Season Series
LAA4–1
ATH
LAA5–2
ATH
LAA3–9
ATH
ATH7–9
LAA
ATH0–7
LAA
ATH12–11
LAA
ATH5–0
LAA
LAA2–3
ATH
LAA5–6
ATH
LAA6–14
ATH
Last 5 Games
| Date | Opponent | Result |
|---|---|---|
| Aug 22 |  @ HOU | W4–3 |
| Aug 21 | @ HOU | L0–4 |
| Aug 20 |  @ KC | L2–6 |
| Aug 19 | @ KC | L7–9 |
| Aug 18 | @ KC | L3–4 |
| Date | Opponent | Result |
|---|---|---|
| Aug 22 |  @ TEX | W3–0 |
| Aug 21 | @ TEX | L1–2 |
| Aug 20 | @ HOU | W18–3 |
| Aug 19 | @ HOU | L2–3 |
| Aug 18 | @ HOU | W3–1 |
Standings
American League
| Team | W | L | PCT | GB | DIFF | STRK |
|---|---|---|---|---|---|---|
1 Rays | 76 | 53 | .589 | - | +42 | L3 |
2 White Sox | 67 | 62 | .519 | 9 | +42 | L1 |
| 3Astros | 65 | 65 | .500 | 11.5 | -43 | L1 |
4 Yankees | 73 | 56 | .566 | 3 | +95 | L1 |
5 Red Sox | 70 | 59 | .543 | 6 | +98 | W2 |
| 6Rangers | 64 | 66 | .492 | 12.5 | -48 | L1 |
7 Guardians | 64 | 66 | .492 | 12.5 | -14 | W3 |
8 Blue Jays | 64 | 67 | .489 | 13 | -50 | W1 |
9 Twins | 63 | 67 | .485 | 13.5 | -47 | L2 |
10 Orioles | 63 | 67 | .485 | 13.5 | -33 | W2 |
11 Mariners | 62 | 68 | .477 | 14.5 | -44 | W2 |
12 Tigers | 61 | 68 | .473 | 15 | +77 | L4 |
| 13Royals | 57 | 74 | .435 | 20 | -95 | W7 |
| 14Angels | 52 | 78 | .400 | 24.5 | -68 | W1 |
| 15Athletics | 50 | 80 | .385 | 26.5 | -188 | W1 |
National League
| Team | W | L | PCT | GB | DIFF | STRK |
|---|---|---|---|---|---|---|
1 Brewers | 81 | 49 | .623 | - | +163 | W3 |
2 Dodgers | 79 | 51 | .608 | 2 | +147 | W5 |
3 Braves | 75 | 55 | .577 | 6 | +108 | L2 |
4 Cubs | 74 | 56 | .569 | 7 | +98 | L3 |
5 Phillies | 72 | 58 | .554 | 9 | +25 | W8 |
6 Padres | 70 | 60 | .538 | 11 | +9 | W2 |
7 Diamondbacks | 68 | 62 | .523 | 13 | +7 | L1 |
8 Marlins | 66 | 64 | .508 | 15 | +17 | W2 |
9 Cardinals | 66 | 65 | .504 | 15.5 | 0 | L2 |
10 Pirates | 63 | 68 | .481 | 18.5 | +29 | L2 |
11 Reds | 62 | 68 | .477 | 19 | -92 | W1 |
12 Nationals | 61 | 70 | .466 | 20.5 | +14 | L3 |
13 Mets | 59 | 71 | .454 | 22 | -39 | W1 |
14 Giants | 52 | 77 | .403 | 28.5 | -79 | L3 |
15 Rockies | 50 | 79 | .388 | 30.5 | -131 | L5 |
ATH
VS
LAA
Pitchers
Jacob Lopez
Justin Sterner
Jack Perkins
Scott Barlow
Hogan Harris
Joel Kuhnel
Catchers
Jonah Heim
Infielders
Nick Kurtz
Alika Williams
Zack Gelof
Jeff McNeil
Darell Hernaiz
Outfielders
Colby Thomas
Tyler Soderstrom
Brent Rooker
Henry Bolte
Lawrence Butler
Designated Hitters
Shea Langeliers
Pitchers
Reid Detmers
Jose Fermin
Ryan Johnson
Brent Suter
Catchers
Logan O'Hoppe
Infielders
Zach Neto
Vaughn Grissom
Oswald Peraza
Nolan Schanuel
Outfielders
Mike Trout
Jo Adell
Jose Siri
Josh Lowe
Designated Hitters
Jorge Soler
Athletics
VS
Angels
Batting
130
Team Games Played
130
4405
At Bats
4347
1074
Hits
1025
536
Runs Batted In
515
154
Home Runs
128
68
Stolen Bases
72
.244
Batting Average
.236
561
Runs
534
200
Doubles
195
11
Triples
12
1758
Total Bases
1628
434
Walks
406
1104
Strikeouts
1226
.318
On Base Percentage
.310
.399
Slugging Percentage
.375
.717
OBP Pct + SLG Pct
.684
130
Games Played
130
130
Games Started
130
56
Hit By Pitch
72
0.0
Wins Above Replacement
0.0
0.0
Offensive Wins Above Replacement
0.0
27
Caught Stealing
22
1
Is Qualified
1
557.2
Runs Created
508.3
4.3
Runs Created Per 27 Outs
3.9
.088
Walks Per Plate Appearance
.083
0.39
Walk To Strikeout Ratio
0.33
.155
Isolated Power
.139
.263
Secondary Average
.244
3.81
Pitches Per Plate Appearance
3.90
365
Extra Base Hits
335
4937
Plate Appearances
4871
28.6
At Bats Per Home Run
34.0
18
Sacrifice Hit
20
22
Sacrifice Flies
24
Pitching
130
Team Games Played
130
27
Quality Starts
41
50
Wins
52
80
Losses
78
31
Saves
21
71
Holds
70
1214
Hits
998
700
Earned runs
543
198
Home Runs
137
516
Walks
534
1091
Strikeouts
1167
8.5
Strikeouts Per 9 Innings
9.2
153.8
Pitches Per Start
152.7
1.51
Walks Plus Hits Per Inning Pitched
1.34
5.48
Earned Run Average
4.26
80
Losses
78
1149.0
Innings pitched
1146.0
.385
Win Percentage
.400
57
Save Opportunities
43
.271
Opponent Batting Average
.232
.351
Opponent's On-base pct.
.323
.466
Opponent's Slugging pct.
.377
.817
Opponent's OPB Pct + SLG Pct
.700
4486
At Bats
4303
242
Doubles
180
21
Triples
16
63
Batters Hit
66
86
Stolen Bases
88
130
Games Played
130
1
Complete Games
0
6
Shutouts
11
38
Wild Pitches
54
727
Runs Batted In
570
8
Balks
2
1149.0
Innings pitched
1146.0
8.5
Strikeouts Per 9 Innings
9.2
34
Caught Stealing
23
130
Games Started
130
0.0
Wins Above Replacement
0.0
1
Is Qualified
1
749
Runs
602
700
Earned Runs
543
2092
Total Bases
1621
Fielding
130
Team Games Played
130
1149
Full Innings
1146
4486
Total Chances
4581
3447
Putouts
3438
976
Assists
1067
63
Errors
76
200
Double Plays
195
0.986
Fielding Percentage
0.983
34.6
Range Factor
35.4
0.0
Zone Rating
0.0
130
Games Played
130
0
Games Started
0
0.0
Defensive Wins Above Replacement
0.0
1
Qualified
1