

Athletics vs Astros Live Score (6 Jun, 2026)
Game Information
Stage
Standard
Season
2026
First Pitch
Fri, Jun 5, 8:10 pm
Venue
Daikin Park
Location
Houston, Texas
Attendance
32,420
Live Situation
3Balls
3Strikes
0Outs
—Pitcher
—At Bat
Pitch Sequence
1
STRIKE SWINGING
Sinker
94 MPH
2
BALL
Sinker
94 MPH
3
STRIKE SWINGING
Sinker
94 MPH
4
BALL
Sinker
95 MPH
5
BALL
Slider
86 MPH
6
STRIKE SWINGING
Sinker
95 MPH
Injury Report



Team Stats
 ATH
HOU


1
Runs
5
5
Hits
6
0
Errors
0
1
Home Runs
1
5
Walks
4
10
Strikeouts
13
Player Box Score
Athletics
| Player | H-AB | AB | R | H | RBI | HR | BB | K | #P | AVG | OBP | SLG |
|---|---|---|---|---|---|---|---|---|---|---|---|---|
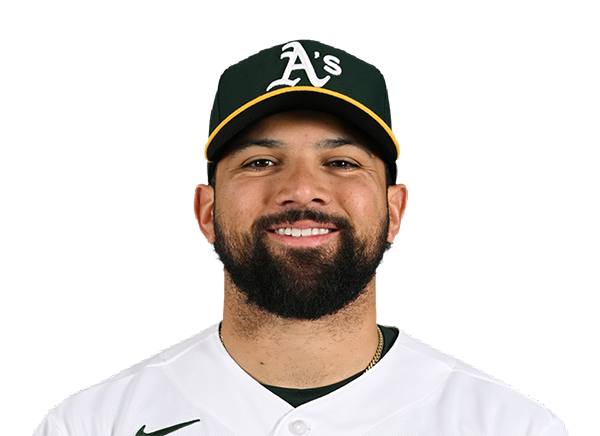 Carlos Cortes | 0-3 | 3 | 0 | 0 | 0 | 0 | 1 | 0 | 17 | .315 | .402 | .493 |
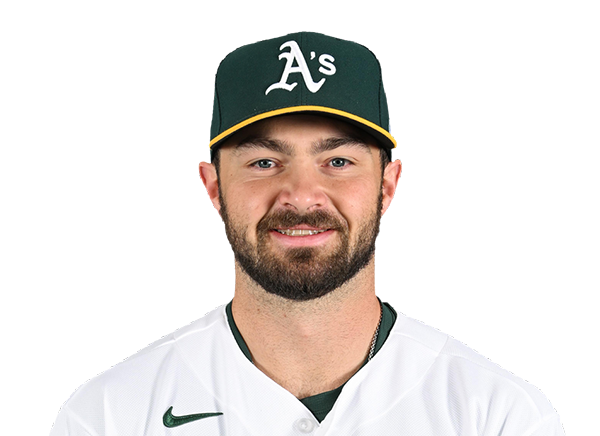 Shea Langeliers | 0-4 | 4 | 0 | 0 | 0 | 0 | 0 | 0 | 16 | .284 | .353 | .547 |
 Nick Kurtz | 0-2 | 2 | 0 | 0 | 0 | 0 | 2 | 0 | 21 | .282 | .438 | .495 |
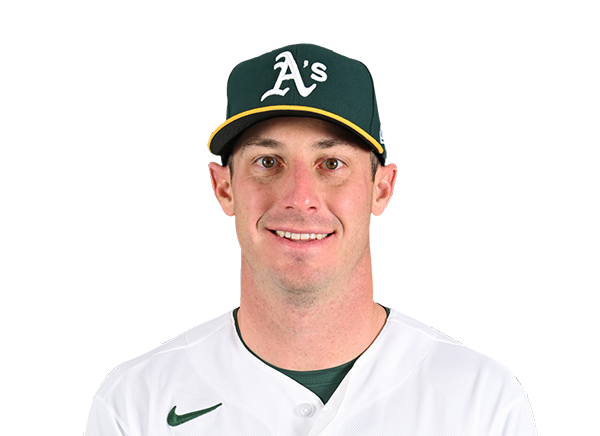 Brent Rooker | 1-4 | 4 | 1 | 1 | 1 | 1 | 0 | 2 | 14 | .196 | .275 | .375 |
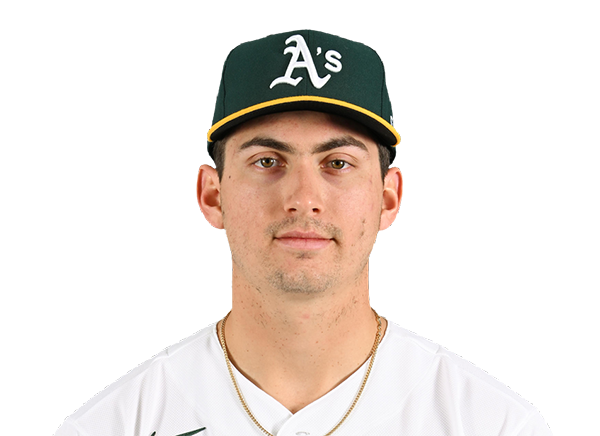 Tyler Soderstrom | 0-2 | 2 | 0 | 0 | 0 | 0 | 2 | 0 | 13 | .229 | .319 | .430 |
 Henry Bolte | 3-4 | 4 | 0 | 3 | 0 | 0 | 0 | 1 | 14 | .328 | .397 | .391 |
 Zack Gelof | 1-4 | 4 | 0 | 1 | 0 | 0 | 0 | 2 | 18 | .263 | .313 | .428 |
 Jeff McNeil | 0-3 | 3 | 0 | 0 | 0 | 0 | 0 | 2 | 11 | .244 | .312 | .321 |
 Colby Thomas | 0-1 | 1 | 0 | 0 | 0 | 0 | 0 | 1 | 6 | .255 | .300 | .426 |
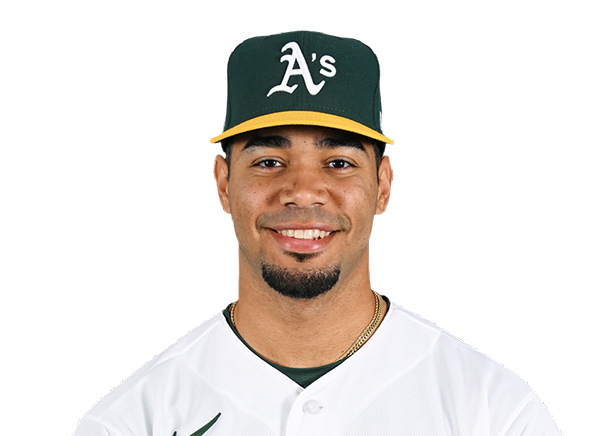 Darell Hernaiz | 0-3 | 3 | 0 | 0 | 0 | 0 | 0 | 2 | 14 | .246 | .328 | .298 |
Houston Astros
| Player | H-AB | AB | R | H | RBI | HR | BB | K | #P | AVG | OBP | SLG |
|---|---|---|---|---|---|---|---|---|---|---|---|---|
 Jeremy Pena | 1-3 | 3 | 1 | 1 | 0 | 0 | 1 | 0 | 17 | .308 | .364 | .449 |
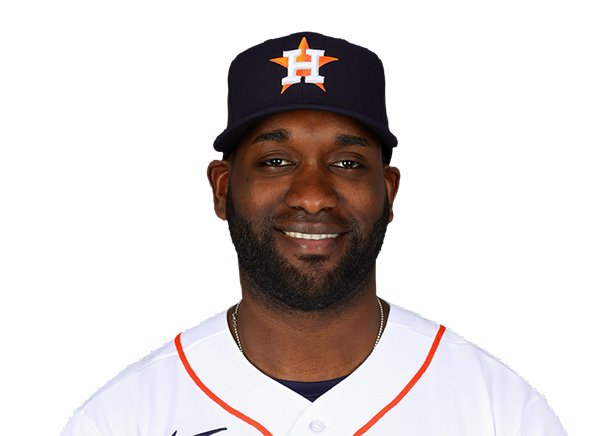 Yordan Alvarez | 1-3 | 3 | 2 | 1 | 0 | 0 | 1 | 0 | 18 | .316 | .429 | .645 |
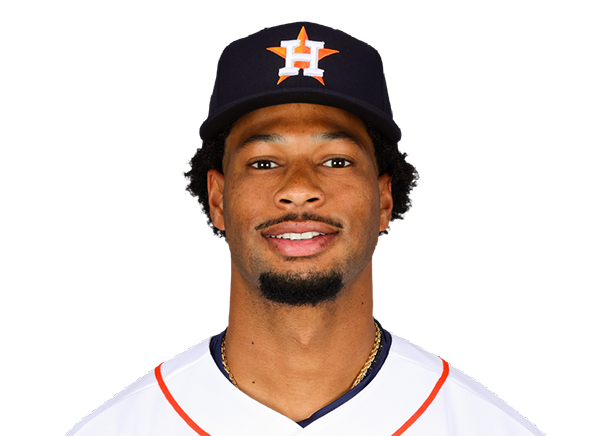 Brice Matthews | 0-0 | 0 | 0 | 0 | 0 | 0 | 0 | 0 | 0 | .203 | .256 | .324 |
 Christian Walker | 1-3 | 3 | 1 | 1 | 1 | 0 | 1 | 1 | 13 | .248 | .321 | .500 |
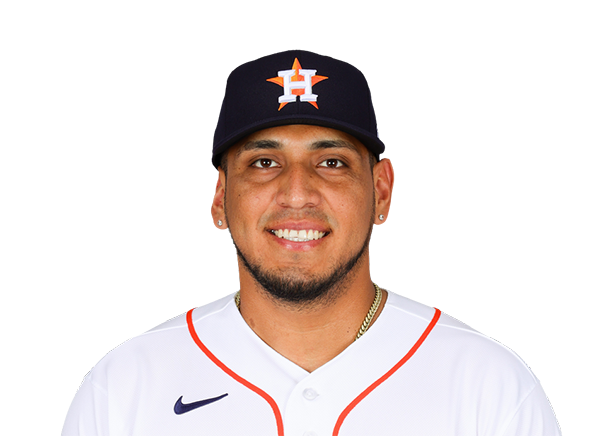 Isaac Paredes | 1-2 | 2 | 1 | 1 | 4 | 1 | 1 | 1 | 13 | .241 | .333 | .415 |
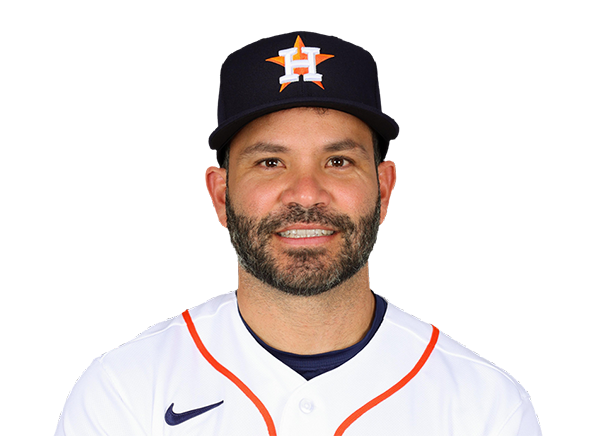 Jose Altuve | 1-4 | 4 | 0 | 1 | 0 | 0 | 0 | 2 | 16 | .246 | .324 | .377 |
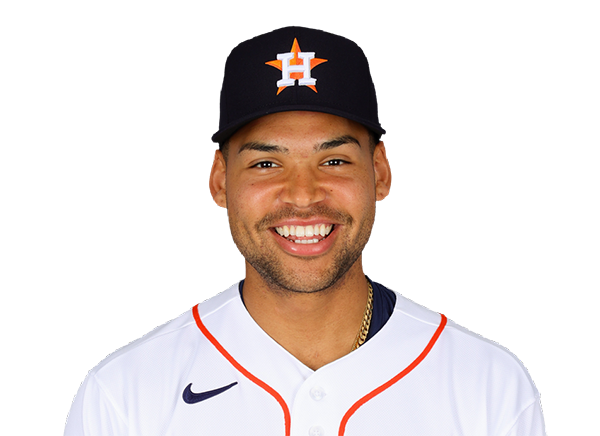 Cam Smith | 0-4 | 4 | 0 | 0 | 0 | 0 | 0 | 4 | 16 | .212 | .302 | .344 |
 Jake Meyers | 1-3 | 3 | 0 | 1 | 0 | 0 | 0 | 1 | 16 | .226 | .283 | .345 |
 Nick Allen | 0-3 | 3 | 0 | 0 | 0 | 0 | 0 | 3 | 16 | .246 | .288 | .328 |
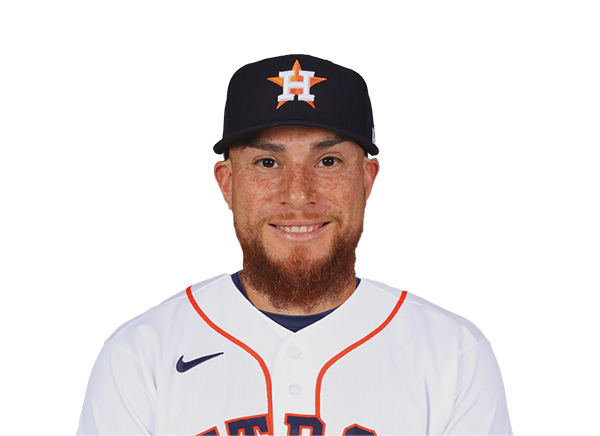 Christian Vazquez | 0-3 | 3 | 0 | 0 | 0 | 0 | 0 | 1 | 14 | .242 | .304 | .379 |
Athletics
| Player | IP | H | R | ER | BB | K | HR | PC-ST | ERA | PC |
|---|---|---|---|---|---|---|---|---|---|---|
 Jack Perkins | 4.0 | 5 | 5 | 5 | 2 | 6 | 1 | 75-49 | 6.19 | 75 |
 Mason Barnett | 4.0 | 1 | 0 | 0 | 2 | 7 | 0 | 64-38 | 0.00 | 64 |
Houston Astros
| Player | IP | H | R | ER | BB | K | HR | PC-ST | ERA | PC |
|---|---|---|---|---|---|---|---|---|---|---|
 Peter Lambert | 5.1 | 5 | 1 | 1 | 4 | 4 | 1 | 94-57 | 3.55 | 94 |
 Enyel De Los Santos | 1.2 | 0 | 0 | 0 | 0 | 2 | 0 | 17-11 | 3.00 | 17 |
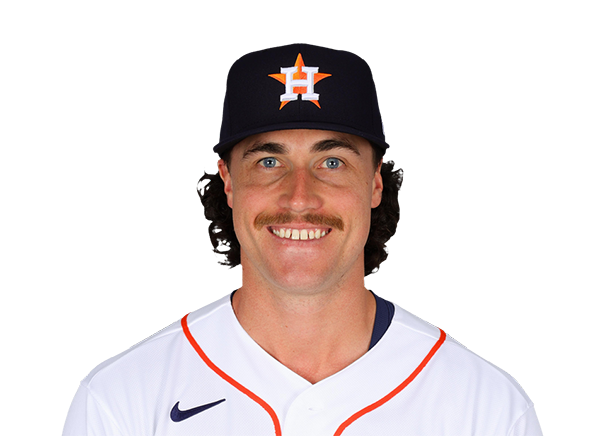 Bryan King | 1.0 | 0 | 0 | 0 | 1 | 1 | 0 | 15-9 | 2.63 | 15 |
 Josh Hader | 1.0 | 0 | 0 | 0 | 0 | 3 | 0 | 18-12 | 0.00 | 18 |
H2H / Season Series
HOU3–4
ATH
HOU4–0
ATH
HOU0–5
ATH
HOU13–2
ATH
HOU5–1
ATH
ATH12–10
HOU
ATH0–11
HOU
ATH11–4
HOU
Last 5 Games
| Date | Opponent | Result |
|---|---|---|
| Aug 22 | @ HOU | W4–3 |
| Aug 21 | @ HOU | L0–4 |
| Aug 20 |  @ KC | L2–6 |
| Aug 19 | @ KC | L7–9 |
| Aug 18 | @ KC | L3–4 |
| Date | Opponent | Result |
|---|---|---|
| Aug 22 | vs ATH | L3–4 |
| Aug 21 | vs ATH | W4–0 |
| Aug 20 |  vs LAA | L3–18 |
| Aug 19 | vs LAA | W3–2 |
| Aug 18 | vs LAA | L1–3 |
Standings
American League
| Team | W | L | PCT | GB | DIFF | STRK |
|---|---|---|---|---|---|---|
1 Rays | 76 | 53 | .589 | - | +42 | L3 |
2 White Sox | 67 | 61 | .523 | 8.5 | +47 | W1 |
| 3Astros | 65 | 64 | .504 | 11 | -42 | W1 |
4 Yankees | 73 | 56 | .566 | 3 | +95 | L1 |
5 Red Sox | 69 | 59 | .539 | 6.5 | +97 | W1 |
6 Rangers | 64 | 66 | .492 | 12.5 | -48 | L1 |
7 Blue Jays | 64 | 67 | .489 | 13 | -50 | W1 |
8 Twins | 63 | 66 | .488 | 13 | -45 | L1 |
9 Guardians | 63 | 66 | .488 | 13 | -15 | W2 |
10 Orioles | 63 | 67 | .485 | 13.5 | -33 | W2 |
11 Mariners | 62 | 68 | .477 | 14.5 | -44 | W2 |
12 Tigers | 61 | 68 | .473 | 15 | +77 | L4 |
| 13Royals | 57 | 74 | .435 | 20 | -95 | W7 |
| 14Angels | 52 | 78 | .400 | 24.5 | -68 | W1 |
| 15Athletics | 49 | 80 | .380 | 27 | -189 | L5 |
National League
| Team | W | L | PCT | GB | DIFF | STRK |
|---|---|---|---|---|---|---|
1 Brewers | 81 | 49 | .623 | - | +163 | W3 |
2 Dodgers | 78 | 51 | .605 | 2.5 | +146 | W4 |
3 Braves | 75 | 55 | .577 | 6 | +108 | L2 |
4 Cubs | 74 | 56 | .569 | 7 | +98 | L3 |
5 Phillies | 72 | 58 | .554 | 9 | +25 | W8 |
6 Padres | 69 | 60 | .535 | 11.5 | +7 | W1 |
7 Diamondbacks | 68 | 61 | .527 | 12.5 | +13 | W2 |
8 Marlins | 66 | 64 | .508 | 15 | +17 | W2 |
9 Cardinals | 66 | 65 | .504 | 15.5 | 0 | L2 |
10 Pirates | 63 | 67 | .485 | 18 | +30 | L1 |
11 Reds | 61 | 68 | .473 | 19.5 | -98 | L2 |
12 Nationals | 61 | 70 | .466 | 20.5 | +14 | L3 |
13 Mets | 58 | 71 | .450 | 22.5 | -44 | L1 |
14 Giants | 52 | 76 | .406 | 28 | -78 | L2 |
15 Rockies | 50 | 78 | .391 | 30 | -130 | L4 |
ATH
VS
HOU
Pitchers
Jack Perkins
Mason Barnett
Catchers
Shea Langeliers
Infielders
Nick Kurtz
Zack Gelof
Jeff McNeil
Darell Hernaiz
Outfielders
Carlos Cortes
Tyler Soderstrom
Henry Bolte
Designated Hitters
Brent Rooker
Other Players
Colby Thomas
Pitchers
Peter Lambert
Enyel De Los Santos
Bryan King
Josh Hader
Catchers
Christian Vazquez
Infielders
Jeremy Pena
Christian Walker
Jose Altuve
Nick Allen
Outfielders
Yordan Alvarez
Brice Matthews
Cam Smith
Jake Meyers
Designated Hitters
Isaac Paredes
Athletics
VS
Astros
Batting
129
Team Games Played
129
4373
At Bats
4333
1064
Hits
1052
533
Runs Batted In
558
153
Home Runs
170
68
Stolen Bases
40
.243
Batting Average
.243
557
Runs
587
199
Doubles
191
11
Triples
13
1744
Total Bases
1779
429
Walks
428
1096
Strikeouts
1048
.317
On Base Percentage
.317
.399
Slugging Percentage
.411
.716
OBP Pct + SLG Pct
.728
129
Games Played
129
129
Games Started
129
56
Hit By Pitch
61
0.0
Wins Above Replacement
0.0
0.0
Offensive Wins Above Replacement
0.0
27
Caught Stealing
19
1
Is Qualified
1
552.3
Runs Created
565.7
4.3
Runs Created Per 27 Outs
4.4
.088
Walks Per Plate Appearance
.088
0.39
Walk To Strikeout Ratio
0.41
.155
Isolated Power
.168
.263
Secondary Average
.271
3.81
Pitches Per Plate Appearance
3.88
363
Extra Base Hits
374
4899
Plate Appearances
4874
28.6
At Bats Per Home Run
25.5
17
Sacrifice Hit
17
22
Sacrifice Flies
33
Pitching
129
Team Games Played
129
26
Quality Starts
36
49
Wins
65
80
Losses
64
30
Saves
39
70
Holds
65
1208
Hits
1027
697
Earned runs
588
197
Home Runs
170
514
Walks
532
1077
Strikeouts
1125
8.5
Strikeouts Per 9 Innings
8.8
153.9
Pitches Per Start
152.3
1.51
Walks Plus Hits Per Inning Pitched
1.36
5.50
Earned Run Average
4.62
80
Losses
64
1140.0
Innings pitched
1145.1
.380
Win Percentage
.504
56
Save Opportunities
47
.271
Opponent Batting Average
.239
.351
Opponent's On-base pct.
.331
.467
Opponent's Slugging pct.
.406
.819
Opponent's OPB Pct + SLG Pct
.737
4452
At Bats
4298
240
Doubles
168
21
Triples
19
63
Batters Hit
77
86
Stolen Bases
105
129
Games Played
129
1
Complete Games
0
6
Shutouts
8
38
Wild Pitches
42
724
Runs Batted In
601
8
Balks
5
1140.0
Innings pitched
1145.1
8.5
Strikeouts Per 9 Innings
8.8
34
Caught Stealing
34
129
Games Started
129
0.0
Wins Above Replacement
0.0
1
Is Qualified
1
746
Runs
629
697
Earned Runs
588
2081
Total Bases
1743
Fielding
129
Team Games Played
129
1140
Full Innings
1145
4455
Total Chances
4444
3420
Putouts
3436
973
Assists
949
62
Errors
59
199
Double Plays
191
0.986
Fielding Percentage
0.987
34.7
Range Factor
34.5
0.0
Zone Rating
0.0
129
Games Played
129
0
Games Started
0
0.0
Defensive Wins Above Replacement
0.0
1
Qualified
1