

Athletics vs Guardians Live Score (18 Sep, 2026)
Game Information
Stage
STD
Season
2026
First Pitch
Fri, Sep 18, 7:10 pm
Venue
Progressive Field
Location
Cleveland, Ohio
Venue Type
Outdoor
Broadcast
MLB.TV
Attendance
35,391
Live Situation
2Balls
1Strikes
0Outs
—Pitcher
—At Bat
Pitch Sequence
1
BALL
Four-seam FB
99 MPH
2
BALL
Four-seam FB
98 MPH
3
STRIKE LOOKING
Four-seam FB
98 MPH
4
BALL IN PLAY
Four-seam FB
98 MPH
Injury Report
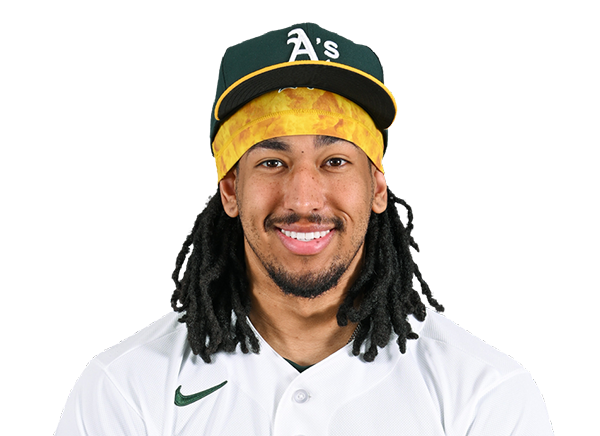
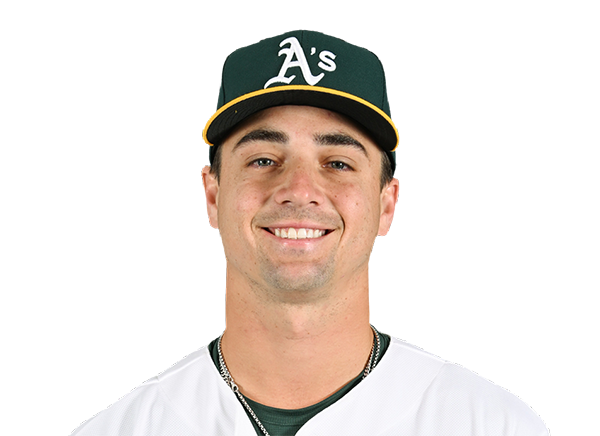
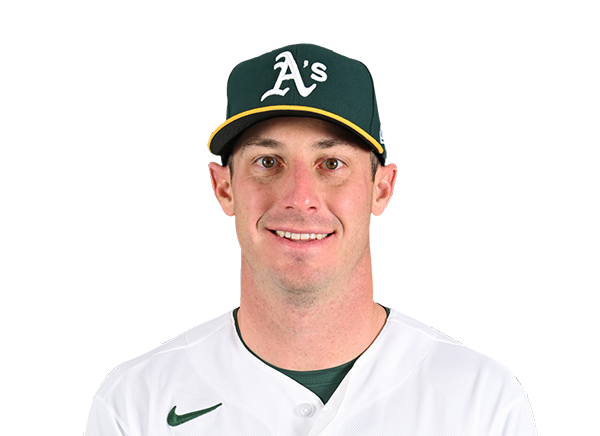

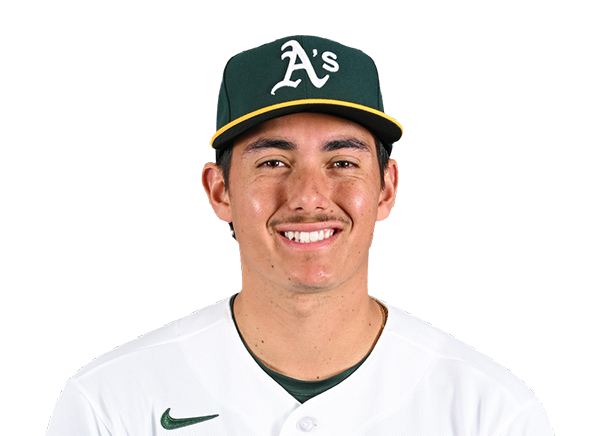
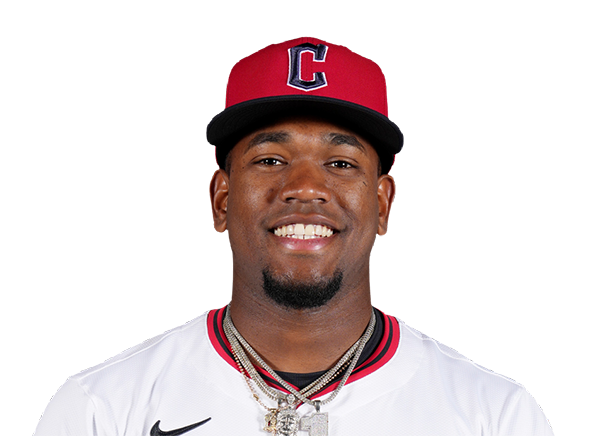
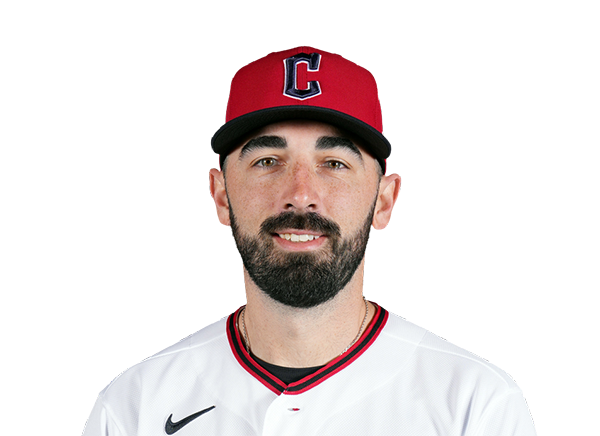


Team Stats
 ATH
CLE


3
Runs
5
3
Hits
10
0
Errors
0
1
Home Runs
2
4
Walks
5
8
Strikeouts
9
Player Box Score
Athletics
| Player | H-AB | AB | R | H | RBI | HR | BB | K | #P | AVG | OBP | SLG |
|---|---|---|---|---|---|---|---|---|---|---|---|---|
 Henry Bolte | 0-2 | 2 | 1 | 0 | 0 | 0 | 1 | 1 | 15 | .274 | .359 | .400 |
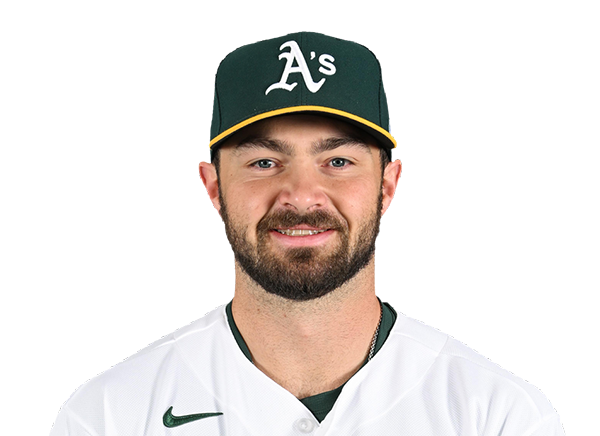 Shea Langeliers | 0-4 | 4 | 0 | 0 | 0 | 0 | 0 | 1 | 16 | .263 | .329 | .487 |
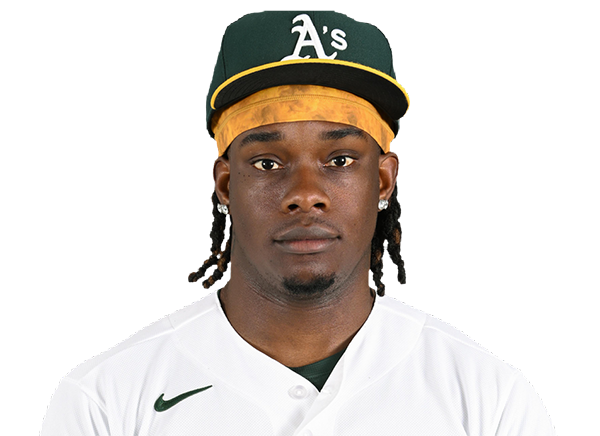 Lawrence Butler | 0-2 | 2 | 1 | 0 | 0 | 0 | 2 | 1 | 19 | .230 | .321 | .389 |
 Zack Gelof | 1-4 | 4 | 1 | 1 | 3 | 1 | 0 | 2 | 16 | .247 | .312 | .456 |
 Jeff McNeil | 1-4 | 4 | 0 | 1 | 0 | 0 | 0 | 0 | 14 | .268 | .315 | .369 |
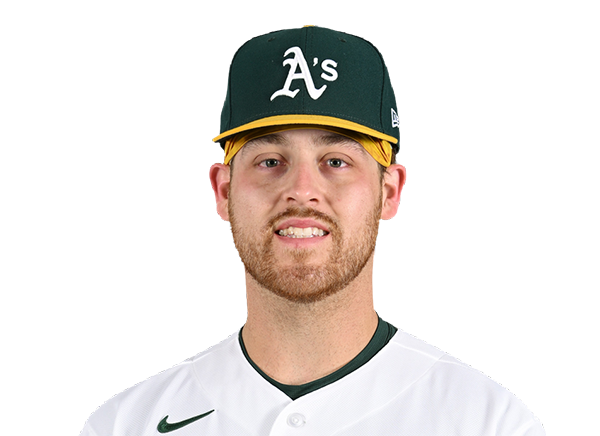 Tommy White | 0-2 | 2 | 0 | 0 | 0 | 0 | 1 | 0 | 11 | .250 | .270 | .331 |
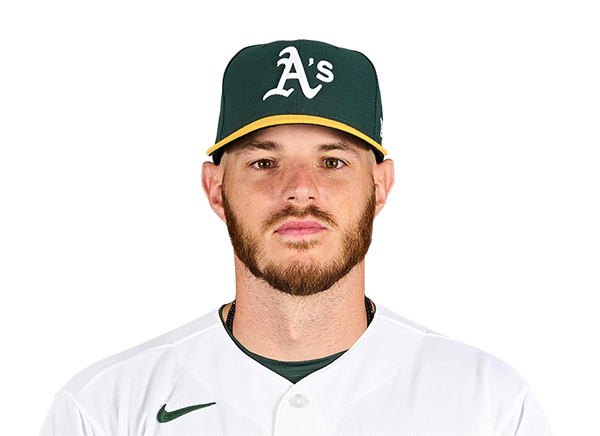 Jonah Heim | 0-3 | 3 | 0 | 0 | 0 | 0 | 0 | 1 | 12 | .203 | .259 | .368 |
 Michael Stefanic | 0-3 | 3 | 0 | 0 | 0 | 0 | 0 | 2 | 20 | .304 | .360 | .348 |
 Alika Williams | 1-2 | 2 | 0 | 1 | 0 | 0 | 0 | 0 | 6 | .259 | .299 | .418 |
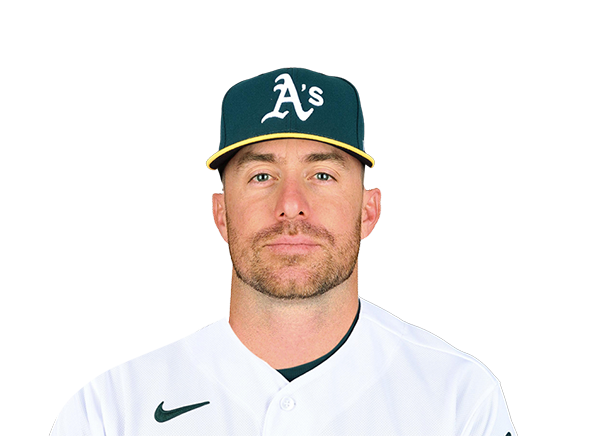 Donovan Walton | 0-1 | 1 | 0 | 0 | 0 | 0 | 0 | 0 | 4 | .258 | .360 | .435 |
Cleveland Guardians
| Player | H-AB | AB | R | H | RBI | HR | BB | K | #P | AVG | OBP | SLG |
|---|---|---|---|---|---|---|---|---|---|---|---|---|
 Steven Kwan | 0-3 | 3 | 0 | 0 | 0 | 0 | 2 | 1 | 25 | .275 | .376 | .342 |
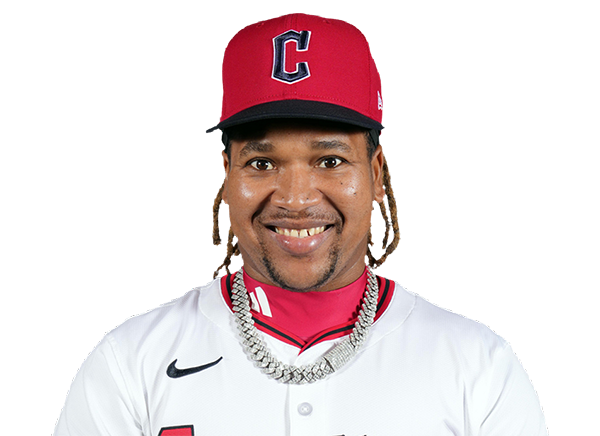 Jose Ramirez | 2-5 | 5 | 1 | 2 | 2 | 1 | 0 | 1 | 24 | .232 | .320 | .372 |
 Chase DeLauter | 1-3 | 3 | 0 | 1 | 0 | 0 | 1 | 0 | 10 | .289 | .363 | .452 |
 Jo Adell | 1-4 | 4 | 0 | 1 | 0 | 0 | 0 | 2 | 16 | .240 | .295 | .402 |
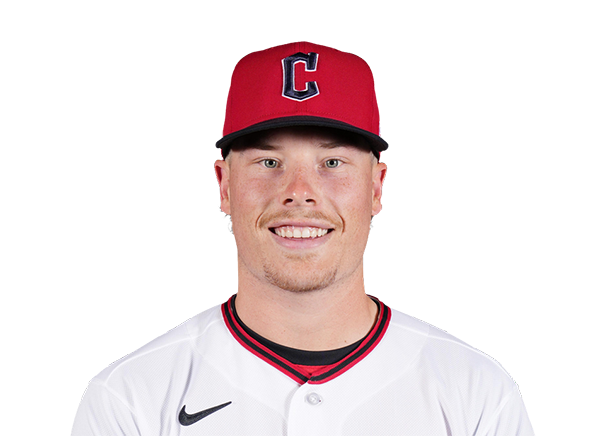 Travis Bazzana | 1-3 | 3 | 1 | 1 | 1 | 1 | 1 | 0 | 13 | .250 | .343 | .414 |
 Nathaniel Lowe | 1-3 | 3 | 0 | 1 | 0 | 0 | 0 | 1 | 12 | .255 | .323 | .454 |
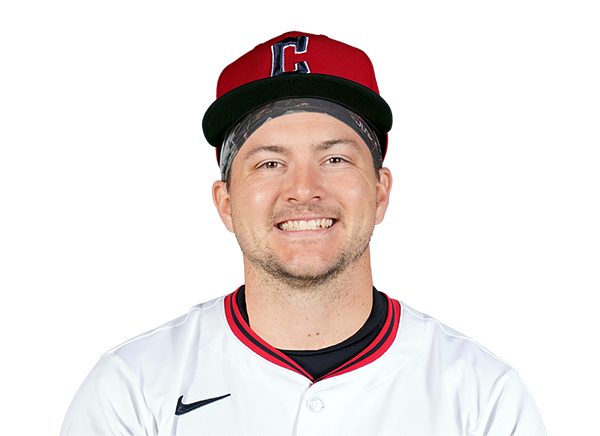 Patrick Bailey | 1-4 | 4 | 1 | 1 | 0 | 0 | 0 | 3 | 17 | .207 | .274 | .323 |
 Petey Halpin | 1-4 | 4 | 1 | 1 | 0 | 0 | 0 | 1 | 8 | .218 | .256 | .324 |
 Brayan Rocchio | 2-3 | 3 | 1 | 2 | 2 | 0 | 1 | 0 | 19 | .250 | .312 | .379 |
Athletics
| Player | IP | H | R | ER | BB | K | HR | PC-ST | ERA | PC |
|---|---|---|---|---|---|---|---|---|---|---|
 Mason Barnett | 3.1 | 7 | 3 | 3 | 4 | 4 | 0 | 79-45 | 7.16 | 79 |
 Scott Blewett | 1.2 | 1 | 1 | 1 | 0 | 3 | 1 | 22-13 | 2.70 | 22 |
 Seth Johnson | 1.0 | 2 | 1 | 1 | 0 | 1 | 1 | 19-11 | 6.35 | 19 |
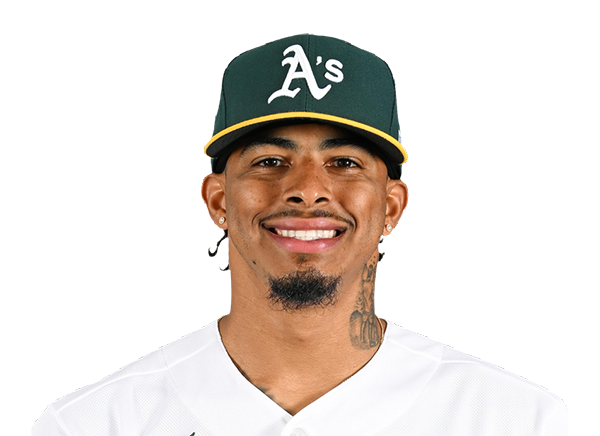 Luis Medina | 1.0 | 0 | 0 | 0 | 0 | 1 | 0 | 10-7 | 3.25 | 10 |
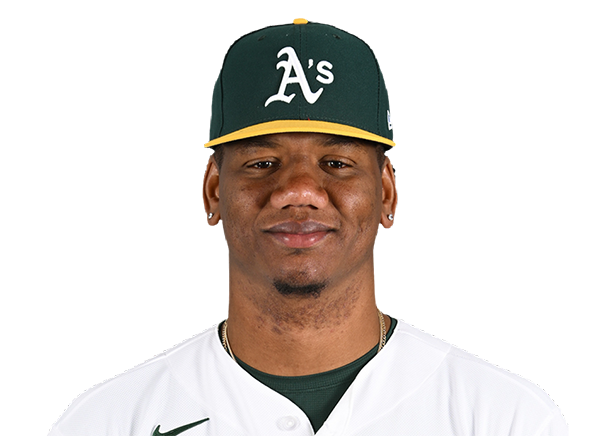 Elvis Alvarado | 1.0 | 0 | 0 | 0 | 1 | 0 | 0 | 14-5 | 4.06 | 14 |
Cleveland Guardians
| Player | IP | H | R | ER | BB | K | HR | PC-ST | ERA | PC |
|---|---|---|---|---|---|---|---|---|---|---|
 Daniel Espino | 1.0 | 1 | 3 | 3 | 3 | 1 | 1 | 27-14 | 4.73 | 27 |
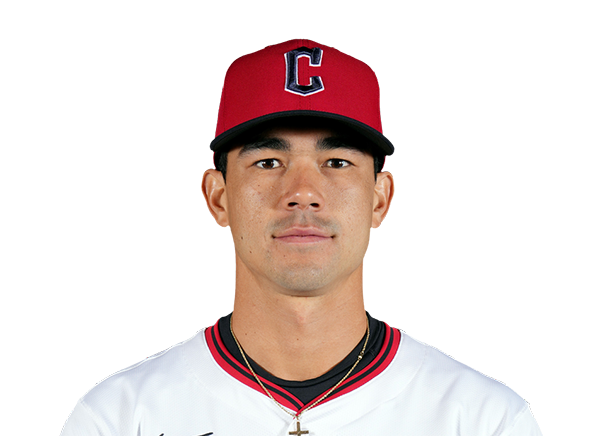 Joey Cantillo | 6.0 | 2 | 0 | 0 | 1 | 5 | 0 | 81-54 | 3.74 | 81 |
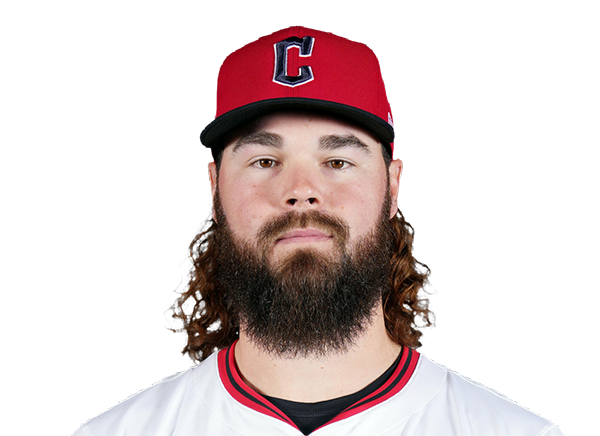 Hunter Gaddis | 1.0 | 0 | 0 | 0 | 0 | 0 | 0 | 11-6 | 2.70 | 11 |
 Cade Smith | 1.0 | 0 | 0 | 0 | 0 | 2 | 0 | 14-9 | 2.06 | 14 |
H2H / Season Series
CLE5–3
ATH
ATH7–1
CLE
ATH6–14
CLE
ATH5–8
CLE
CLE12–6
ATH
ATH0–6
CLE
Last 5 Games
| Date | Opponent | Result |
|---|---|---|
| Sep 18 | @ CLE | L3–5 |
| Sep 17 |  @ TB | L1–10 |
| Sep 16 | @ TB | L3–4 |
| Sep 15 | @ TB | L1–2 |
| Sep 13 |  vs SEA | W8–7 |
| Date | Opponent | Result |
|---|---|---|
| Sep 18 | vs ATH | W5–3 |
| Sep 16 |  vs CHW | W6–3 |
| Sep 15 | vs CHW | W7–6 |
| Sep 14 | vs CHW | L3–7 |
| Sep 13 |  @ MIN | W9–2 |
Standings
American League
| Team | W | L | PCT | GB | DIFF | STRK |
|---|---|---|---|---|---|---|
| 1Rays | 93 | 60 | .608 | - | +78 | L1 |
| 2Guardians | 79 | 75 | .513 | 14.5 | -5 | W3 |
3 Astros | 77 | 77 | .500 | 16.5 | -54 | L1 |
4 Yankees | 89 | 64 | .582 | 4 | +143 | W1 |
5 Red Sox | 84 | 70 | .545 | 9.5 | +85 | W2 |
| 6White Sox | 78 | 76 | .506 | 15.5 | +33 | L1 |
7 Rangers | 77 | 77 | .500 | 16.5 | -33 | W1 |
8 Blue Jays | 76 | 78 | .494 | 17.5 | -43 | L1 |
9 Orioles | 75 | 79 | .487 | 18.5 | -27 | L1 |
10 Tigers | 73 | 81 | .474 | 20.5 | +77 | W1 |
| 11Mariners | 72 | 82 | .468 | 21.5 | -55 | W2 |
| 12Twins | 72 | 82 | .468 | 21.5 | -71 | W1 |
13 Royals | 67 | 87 | .435 | 26.5 | -100 | L2 |
| 14Athletics | 61 | 93 | .396 | 32.5 | -216 | L4 |
15 Angels | 59 | 95 | .383 | 34.5 | -80 | L1 |
National League
| Team | W | L | PCT | GB | DIFF | STRK |
|---|---|---|---|---|---|---|
1 Brewers | 96 | 58 | .623 | - | +198 | W1 |
2 Dodgers | 94 | 60 | .610 | 2 | +185 | W2 |
3 Braves | 90 | 64 | .584 | 6 | +115 | W1 |
4 Phillies | 85 | 69 | .552 | 11 | +31 | L1 |
5 Cubs | 85 | 69 | .552 | 11 | +141 | L1 |
6 Padres | 85 | 69 | .552 | 11 | +36 | W3 |
7 Diamondbacks | 80 | 74 | .519 | 16 | -7 | L3 |
8 Pirates | 77 | 77 | .500 | 19 | +27 | W2 |
9 Marlins | 76 | 78 | .494 | 20 | +2 | L1 |
10 Cardinals | 75 | 79 | .487 | 21 | -22 | L3 |
11 Nationals | 72 | 82 | .468 | 24 | +11 | W1 |
12 Reds | 72 | 82 | .468 | 24 | -152 | W1 |
13 Mets | 70 | 84 | .455 | 26 | -43 | W1 |
14 Giants | 64 | 90 | .416 | 32 | -76 | L1 |
15 Rockies | 56 | 98 | .364 | 40 | -178 | L3 |
ATH
VS
CLE
Pitchers
Mason Barnett
Catchers
Jonah Heim
Infielders
Jeff McNeil
Tommy White
Michael Stefanic
Alika Williams
Outfielders
Henry Bolte
Lawrence Butler
Zack Gelof
Designated Hitters
Shea Langeliers
Pitchers
Daniel Espino
Catchers
Patrick Bailey
Infielders
Jose Ramirez
Travis Bazzana
Nathaniel Lowe
Brayan Rocchio
Outfielders
Steven Kwan
Chase DeLauter
Petey Halpin
Designated Hitters
Jo Adell
Athletics
VS
Guardians
Batting
154
Team Games Played
154
5214
At Bats
5132
1270
Hits
1216
635
Runs Batted In
609
187
Home Runs
149
87
Stolen Bases
141
.244
Batting Average
.237
664
Runs
636
230
Doubles
236
14
Triples
14
2089
Total Bases
1927
498
Walks
546
1312
Strikeouts
1221
.316
On Base Percentage
.315
.401
Slugging Percentage
.375
.717
OBP Pct + SLG Pct
.690
154
Games Played
154
154
Games Started
154
68
Hit By Pitch
56
0.0
Wins Above Replacement
0.0
0.0
Offensive Wins Above Replacement
0.0
30
Caught Stealing
30
1
Is Qualified
1
658.9
Runs Created
635.6
4.3
Runs Created Per 27 Outs
4.2
.085
Walks Per Plate Appearance
.094
0.38
Walk To Strikeout Ratio
0.45
.157
Isolated Power
.139
.264
Secondary Average
.267
3.81
Pitches Per Plate Appearance
3.95
431
Extra Base Hits
399
5826
Plate Appearances
5804
27.9
At Bats Per Home Run
34.4
19
Sacrifice Hit
27
25
Sacrifice Flies
41
Pitching
154
Team Games Played
154
31
Quality Starts
56
61
Wins
79
93
Losses
75
37
Saves
43
83
Holds
107
1435
Hits
1214
818
Earned runs
576
228
Home Runs
168
607
Walks
509
1288
Strikeouts
1459
8.5
Strikeouts Per 9 Innings
9.6
153.0
Pitches Per Start
148.3
1.50
Walks Plus Hits Per Inning Pitched
1.26
5.41
Earned Run Average
3.79
93
Losses
75
1360.0
Innings pitched
1367.2
.396
Win Percentage
.513
65
Save Opportunities
59
.270
Opponent Batting Average
.236
.349
Opponent's On-base pct.
.311
.461
Opponent's Slugging pct.
.386
.811
Opponent's OPB Pct + SLG Pct
.698
5311
At Bats
5144
282
Doubles
235
24
Triples
17
72
Batters Hit
73
106
Stolen Bases
98
154
Games Played
154
1
Complete Games
0
7
Shutouts
4
47
Wild Pitches
55
852
Runs Batted In
609
8
Balks
2
1360.0
Innings pitched
1367.2
8.5
Strikeouts Per 9 Innings
9.6
39
Caught Stealing
21
154
Games Started
154
0.0
Wins Above Replacement
0.0
1
Is Qualified
1
880
Runs
641
818
Earned Runs
576
2449
Total Bases
1987
Fielding
154
Team Games Played
154
1360
Full Innings
1368
5327
Total Chances
5370
4080
Putouts
4103
1173
Assists
1187
74
Errors
80
230
Double Plays
236
0.986
Fielding Percentage
0.985
34.8
Range Factor
34.8
0.0
Zone Rating
0.0
154
Games Played
154
0
Games Started
0
0.0
Defensive Wins Above Replacement
0.0
1
Qualified
1