

Athletics vs Mariners Live Score (4 Sep, 2026)
Game Information
Stage
STD
Season
2026
First Pitch
Thu, Sep 3, 9:40 pm
Venue
T-Mobile Park
Location
Seattle, Washington
Venue Type
Indoor
Broadcast
MLB.TV
Attendance
27,368
Live Situation
0Balls
3Strikes
0Outs
—Pitcher
—At Bat
Pitch Sequence
1
STRIKE LOOKING
Four-seam FB
96 MPH
2
STRIKE SWINGING
Curve
76 MPH
3
STRIKE FOUL
Four-seam FB
97 MPH
4
STRIKE SWINGING
Curve
74 MPH
Injury Report
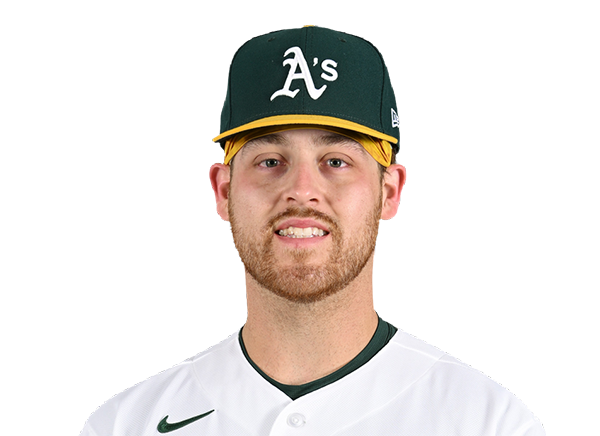
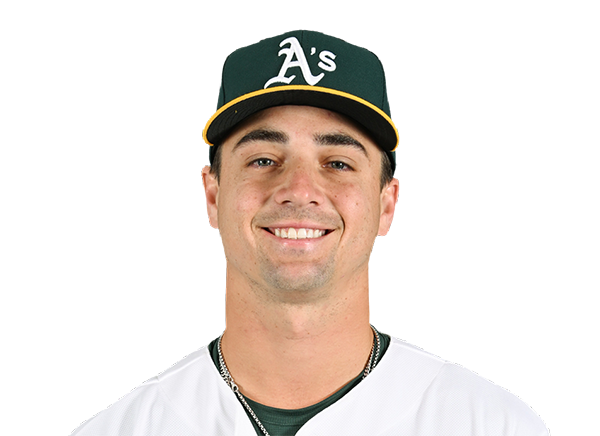
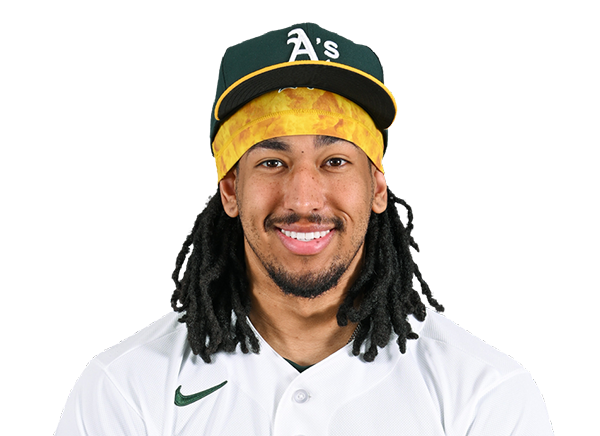

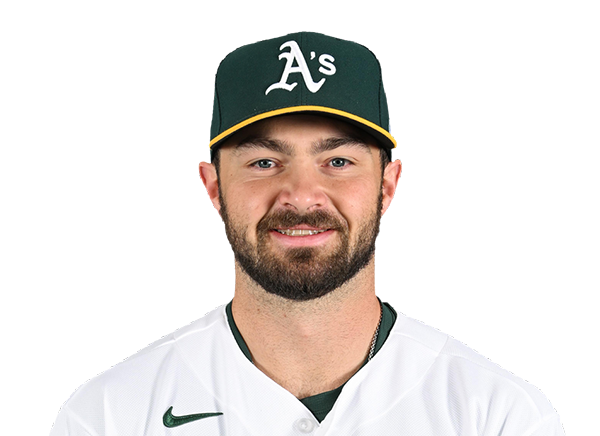

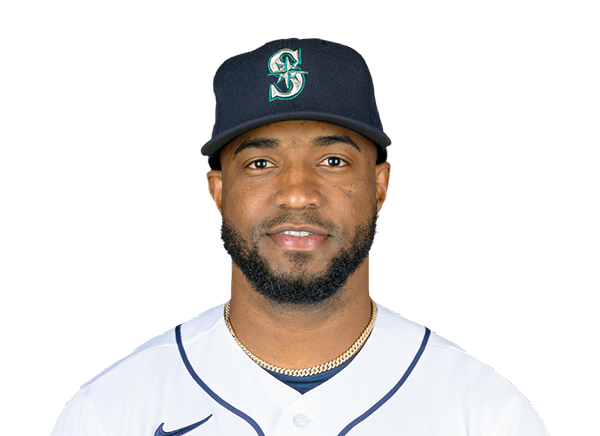


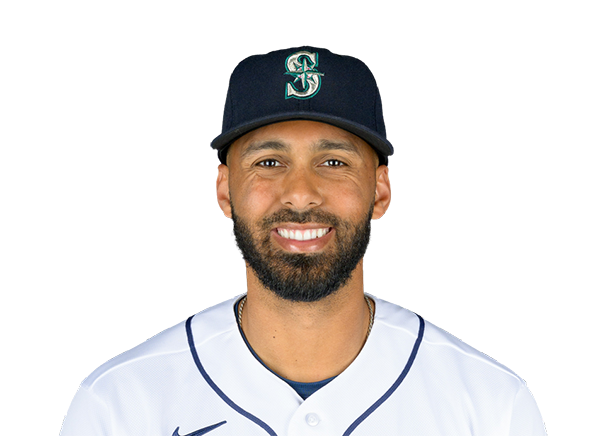
Team Stats
 ATH
SEA


7
Runs
4
14
Hits
9
0
Errors
0
2
Home Runs
0
3
Walks
8
8
Strikeouts
18
Player Box Score
Athletics
| Player | H-AB | AB | R | H | RBI | HR | BB | K | #P | AVG | OBP | SLG |
|---|---|---|---|---|---|---|---|---|---|---|---|---|
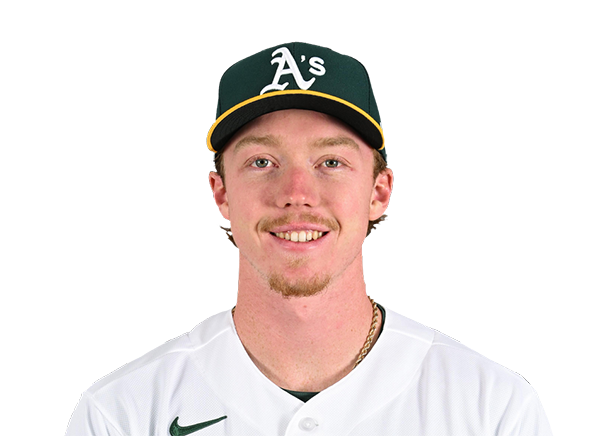 Henry Bolte | 2-4 | 4 | 1 | 2 | 0 | 0 | 1 | 0 | 16 | .277 | .354 | .390 |
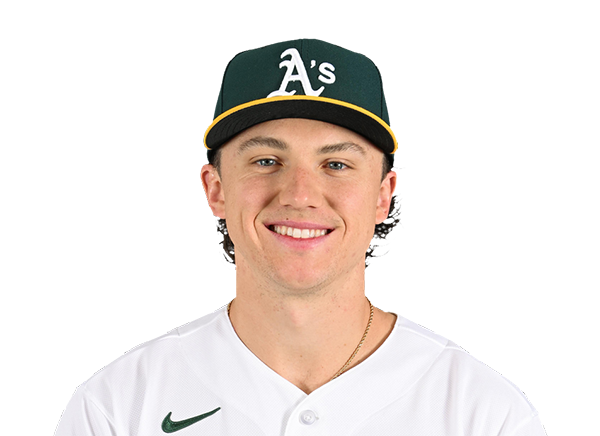 Zack Gelof | 2-5 | 5 | 2 | 2 | 1 | 1 | 0 | 1 | 22 | .258 | .325 | .462 |
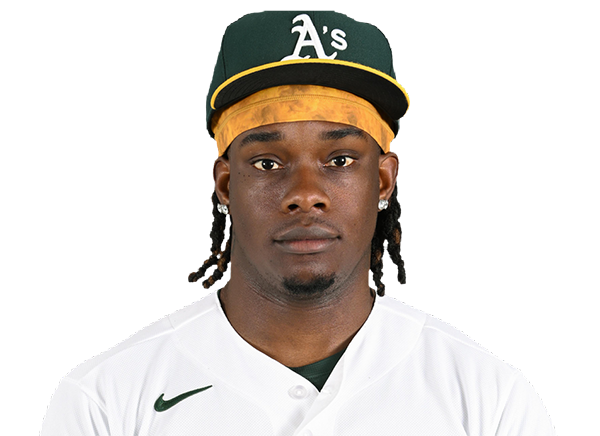 Lawrence Butler | 2-5 | 5 | 0 | 2 | 2 | 0 | 0 | 2 | 29 | .233 | .327 | .371 |
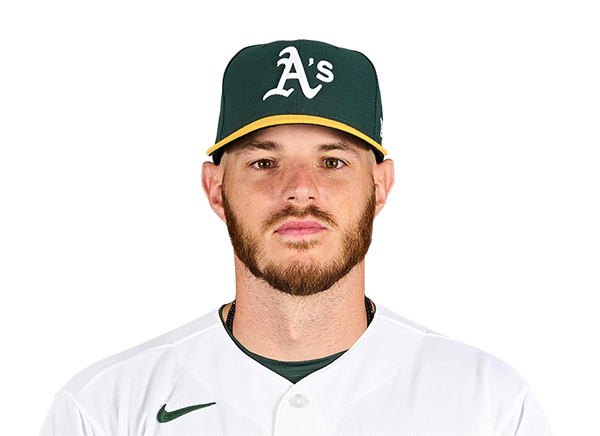 Jonah Heim | 1-5 | 5 | 1 | 1 | 0 | 0 | 0 | 0 | 18 | .214 | .273 | .396 |
 Jeff McNeil | 2-4 | 4 | 2 | 2 | 1 | 0 | 1 | 0 | 19 | .270 | .320 | .371 |
 Michael Stefanic | 1-2 | 2 | 0 | 1 | 0 | 0 | 0 | 0 | 5 | .389 | .450 | .444 |
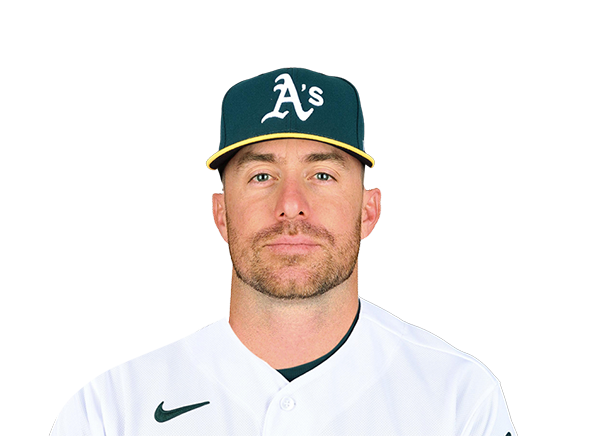 Donovan Walton | 1-1 | 1 | 1 | 1 | 1 | 1 | 1 | 0 | 12 | .278 | .384 | .450 |
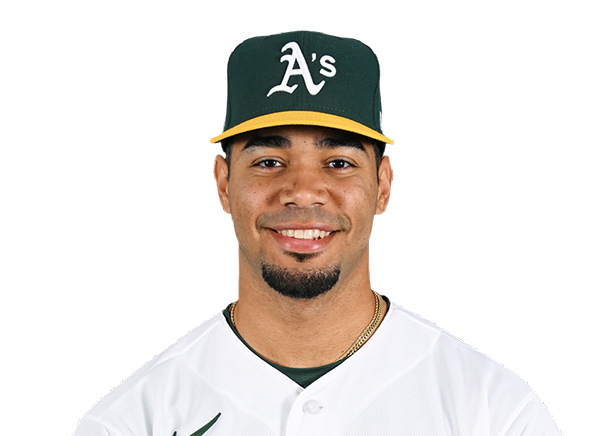 Darell Hernaiz | 0-1 | 1 | 0 | 0 | 0 | 0 | 0 | 1 | 6 | .234 | .316 | .277 |
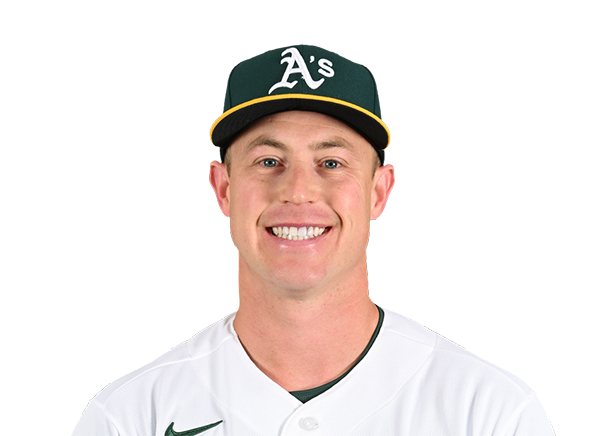 Brian Serven | 1-4 | 4 | 0 | 1 | 0 | 0 | 0 | 2 | 15 | .233 | .270 | .500 |
 Alika Williams | 1-4 | 4 | 0 | 1 | 0 | 0 | 0 | 1 | 10 | .271 | .307 | .428 |
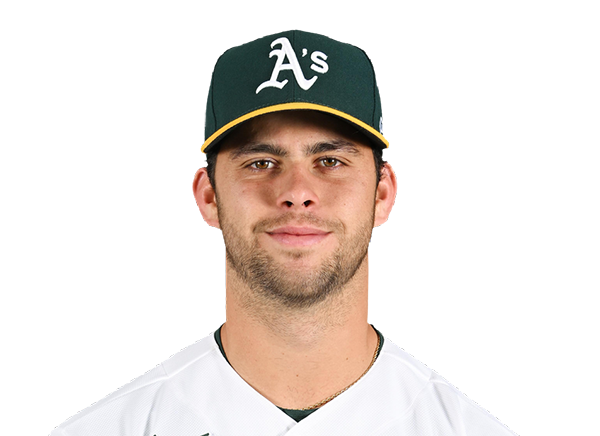 Max Muncy | 1-4 | 4 | 0 | 1 | 1 | 0 | 0 | 1 | 16 | .215 | .286 | .364 |
Seattle Mariners
| Player | H-AB | AB | R | H | RBI | HR | BB | K | #P | AVG | OBP | SLG |
|---|---|---|---|---|---|---|---|---|---|---|---|---|
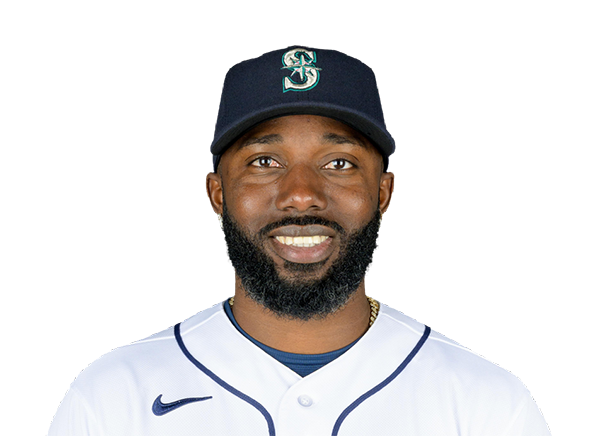 Randy Arozarena | 1-3 | 3 | 2 | 1 | 0 | 0 | 1 | 2 | 32 | .273 | .370 | .467 |
 Dominic Canzone | 1-4 | 4 | 0 | 1 | 0 | 0 | 1 | 2 | 25 | .255 | .330 | .485 |
 Julio Rodriguez | 1-4 | 4 | 1 | 1 | 2 | 0 | 1 | 1 | 17 | .245 | .306 | .402 |
 Cal Raleigh | 1-4 | 4 | 1 | 1 | 1 | 0 | 1 | 2 | 25 | .172 | .287 | .358 |
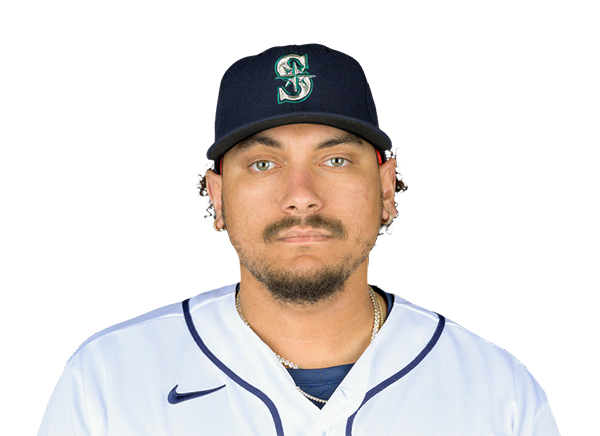 Josh Naylor | 0-5 | 5 | 0 | 0 | 0 | 0 | 0 | 2 | 17 | .265 | .324 | .361 |
 Cole Young | 2-5 | 5 | 0 | 2 | 0 | 0 | 0 | 3 | 23 | .246 | .309 | .382 |
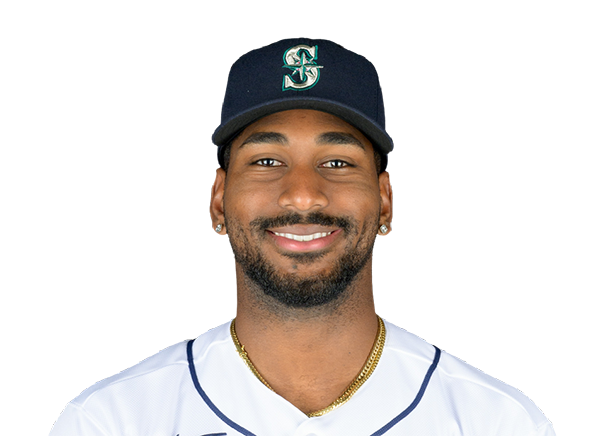 Lazaro Montes | 1-5 | 5 | 0 | 1 | 1 | 0 | 0 | 3 | 16 | .333 | .400 | .667 |
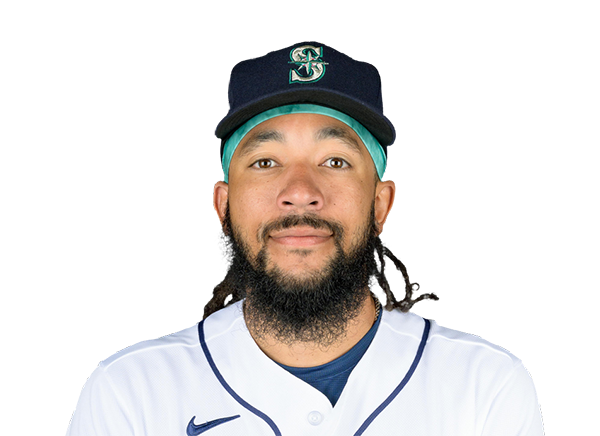 J.P. Crawford | 1-2 | 2 | 0 | 1 | 0 | 0 | 3 | 0 | 23 | .222 | .343 | .348 |
 Brock Rodden | 1-3 | 3 | 0 | 1 | 0 | 0 | 1 | 2 | 18 | .196 | .309 | .283 |
 Taylor Ward | 0-1 | 1 | 0 | 0 | 0 | 0 | 0 | 1 | 4 | .226 | .359 | .315 |
Athletics
| Player | IP | H | R | ER | BB | K | HR | PC-ST | ERA | PC |
|---|---|---|---|---|---|---|---|---|---|---|
 Jack Perkins | 3.0 | 4 | 3 | 3 | 5 | 7 | 0 | 86-49 | 6.50 | 86 |
 Scott Blewett | 2.0 | 2 | 0 | 0 | 0 | 4 | 0 | 27-19 | 2.49 | 27 |
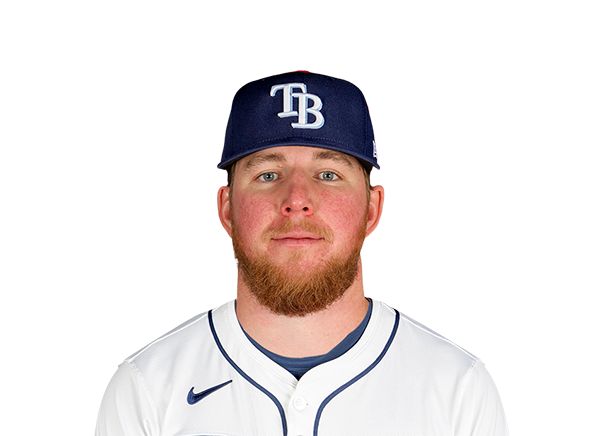 Chris Roycroft | 1.2 | 3 | 1 | 1 | 1 | 2 | 0 | 39-22 | 7.20 | 39 |
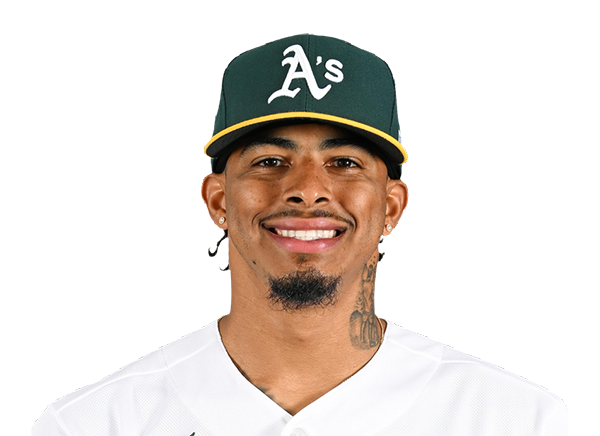 Luis Medina | 1.1 | 0 | 0 | 0 | 2 | 3 | 0 | 34-19 | 3.53 | 34 |
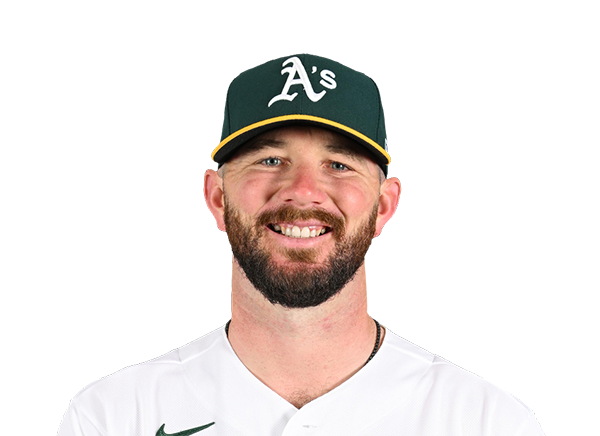 Hogan Harris | 1.0 | 0 | 0 | 0 | 0 | 2 | 0 | 14-10 | 3.43 | 14 |
Seattle Mariners
| Player | IP | H | R | ER | BB | K | HR | PC-ST | ERA | PC |
|---|---|---|---|---|---|---|---|---|---|---|
 Kade Anderson | 5.0 | 7 | 4 | 4 | 2 | 3 | 1 | 79-52 | 5.40 | 79 |
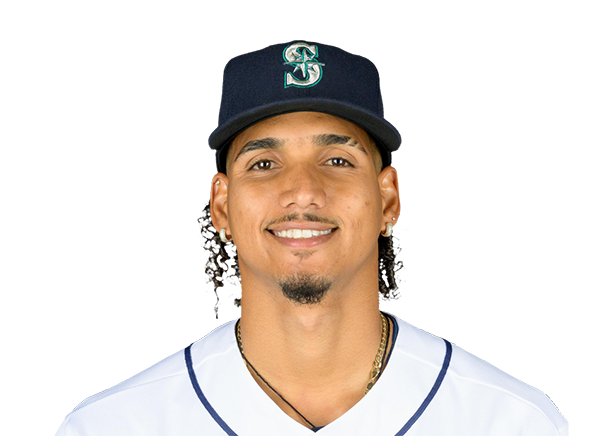 Carlos Vargas | 1.0 | 2 | 1 | 1 | 0 | 0 | 1 | 17-11 | 4.32 | 17 |
 Gabe Speier | 1.0 | 0 | 0 | 0 | 0 | 2 | 0 | 18-14 | 2.52 | 18 |
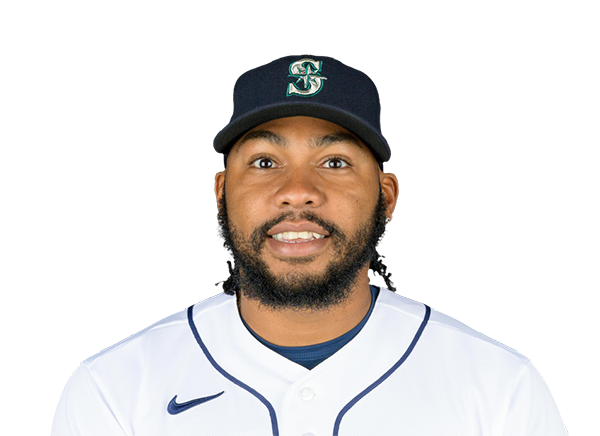 Eduard Bazardo | 1.0 | 3 | 1 | 1 | 1 | 2 | 0 | 29-18 | 3.34 | 29 |
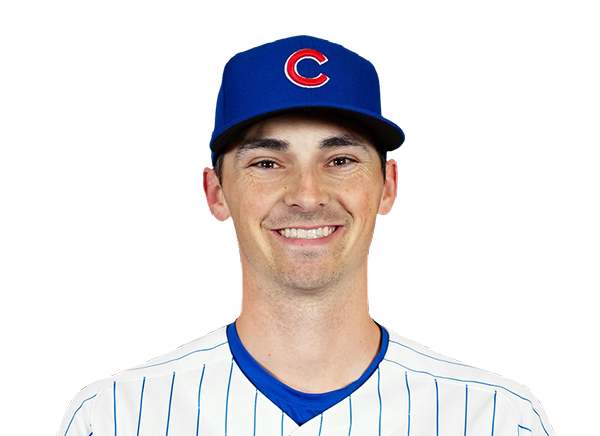 Hoby Milner | 1.0 | 2 | 1 | 1 | 0 | 1 | 0 | 25-17 | 4.14 | 25 |
H2H / Season Series
SEA4–7
ATH
ATH1–9
SEA
ATH1–4
SEA
ATH2–9
SEA
SEA5–4
ATH
SEA2–5
ATH
SEA4–6
ATH
ATH4–6
SEA
Last 5 Games
| Date | Opponent | Result |
|---|---|---|
| Sep 2 |  @ TEX | W9–2 |
| Sep 1 | @ TEX | L5–8 |
| Aug 31 | @ TEX | L1–8 |
| Aug 30 |  vs BAL | L5–8 |
| Aug 29 | vs BAL | L3–5 |
| Date | Opponent | Result |
|---|---|---|
| Sep 2 |  @ BOS | W8–3 |
| Sep 1 | @ BOS | W9–6 |
| Aug 31 | @ BOS | L8–9 |
| Aug 30 |  @ TOR | L0–7 |
| Aug 29 | @ TOR | L3–4 |
Standings
American League
| Team | W | L | PCT | GB | DIFF | STRK |
|---|---|---|---|---|---|---|
1 Rays | 83 | 57 | .593 | - | +45 | L2 |
2 White Sox | 73 | 67 | .521 | 10 | +39 | L2 |
3 Astros | 72 | 69 | .511 | 11.5 | -38 | W2 |
4 Yankees | 80 | 60 | .571 | 3 | +115 | W2 |
| 5Red Sox | 76 | 65 | .539 | 7.5 | +78 | W1 |
6 Guardians | 70 | 70 | .500 | 13 | -11 | L2 |
| 7Rangers | 70 | 71 | .496 | 13.5 | -42 | W1 |
| 8Blue Jays | 70 | 71 | .496 | 13.5 | -41 | W2 |
| 9Orioles | 69 | 72 | .489 | 14.5 | -21 | L3 |
10 Twins | 67 | 73 | .479 | 16 | -38 | L1 |
| 11Mariners | 66 | 75 | .468 | 17.5 | -68 | L1 |
12 Tigers | 64 | 75 | .460 | 18.5 | +47 | W1 |
13 Royals | 63 | 78 | .447 | 20.5 | -85 | W1 |
| 14Athletics | 55 | 86 | .390 | 28.5 | -191 | W2 |
15 Angels | 53 | 87 | .379 | 30 | -80 | L2 |
National League
| Team | W | L | PCT | GB | DIFF | STRK |
|---|---|---|---|---|---|---|
1 Brewers | 87 | 54 | .617 | - | +171 | L1 |
2 Braves | 83 | 57 | .593 | 3.5 | +118 | W1 |
3 Dodgers | 83 | 57 | .593 | 3.5 | +147 | W1 |
4 Phillies | 79 | 61 | .564 | 7.5 | +36 | L1 |
5 Cubs | 79 | 62 | .560 | 8 | +133 | W1 |
6 Diamondbacks | 74 | 67 | .525 | 13 | -1 | W1 |
7 Padres | 73 | 67 | .521 | 13.5 | +10 | L2 |
8 Marlins | 71 | 70 | .504 | 16 | +14 | L1 |
9 Cardinals | 70 | 71 | .496 | 17 | -9 | L1 |
10 Pirates | 69 | 72 | .489 | 18 | +29 | W1 |
11 Reds | 67 | 73 | .479 | 19.5 | -108 | W2 |
12 Nationals | 67 | 75 | .472 | 20.5 | +14 | L1 |
13 Mets | 63 | 77 | .450 | 23.5 | -50 | W1 |
14 Giants | 58 | 83 | .411 | 29 | -73 | L1 |
15 Rockies | 54 | 86 | .386 | 32.5 | -140 | W2 |
ATH
VS
SEA
Pitchers
Jack Perkins
Catchers
Brian Serven
Infielders
Jeff McNeil
Michael Stefanic
Alika Williams
Max Muncy
Outfielders
Henry Bolte
Zack Gelof
Lawrence Butler
Designated Hitters
Jonah Heim
Pitchers
Kade Anderson
Catchers
Cal Raleigh
Infielders
Josh Naylor
Cole Young
J.P. Crawford
Brock Rodden
Outfielders
Randy Arozarena
Julio Rodriguez
Lazaro Montes
Designated Hitters
Dominic Canzone
Athletics
VS
Mariners
Batting
141
Team Games Played
141
4792
At Bats
4671
1185
Hits
1070
592
Runs Batted In
538
168
Home Runs
162
74
Stolen Bases
98
.247
Batting Average
.229
618
Runs
559
220
Doubles
170
13
Triples
14
1935
Total Bases
1754
467
Walks
480
1206
Strikeouts
1235
.321
On Base Percentage
.310
.404
Slugging Percentage
.376
.725
OBP Pct + SLG Pct
.686
141
Games Played
141
141
Games Started
141
65
Hit By Pitch
84
0.0
Wins Above Replacement
0.0
0.0
Offensive Wins Above Replacement
0.0
27
Caught Stealing
35
1
Is Qualified
1
618.6
Runs Created
557.3
4.4
Runs Created Per 27 Outs
4.0
.087
Walks Per Plate Appearance
.091
0.39
Walk To Strikeout Ratio
0.39
.157
Isolated Power
.146
.264
Secondary Average
.263
3.81
Pitches Per Plate Appearance
3.91
401
Extra Base Hits
346
5370
Plate Appearances
5279
28.5
At Bats Per Home Run
28.8
19
Sacrifice Hit
11
25
Sacrifice Flies
32
Pitching
141
Team Games Played
141
29
Quality Starts
59
55
Wins
66
86
Losses
75
35
Saves
30
78
Holds
73
1309
Hits
1192
754
Earned runs
581
211
Home Runs
168
562
Walks
370
1196
Strikeouts
1186
8.6
Strikeouts Per 9 Innings
8.6
153.7
Pitches Per Start
142.7
1.50
Walks Plus Hits Per Inning Pitched
1.26
5.44
Earned Run Average
4.20
86
Losses
75
1247.0
Innings pitched
1244.1
.390
Win Percentage
.468
61
Save Opportunities
52
.269
Opponent Batting Average
.251
.349
Opponent's On-base pct.
.311
.462
Opponent's Slugging pct.
.412
.811
Opponent's OPB Pct + SLG Pct
.723
4864
At Bats
4745
261
Doubles
231
22
Triples
13
67
Batters Hit
61
95
Stolen Bases
101
141
Games Played
141
1
Complete Games
1
6
Shutouts
9
44
Wild Pitches
32
785
Runs Batted In
592
8
Balks
4
1247.0
Innings pitched
1244.1
8.6
Strikeouts Per 9 Innings
8.6
35
Caught Stealing
29
141
Games Started
141
0.0
Wins Above Replacement
0.0
1
Is Qualified
1
809
Runs
627
754
Earned Runs
581
2247
Total Bases
1953
Fielding
141
Team Games Played
141
1247
Full Innings
1244
4866
Total Chances
4966
3741
Putouts
3733
1057
Assists
1161
68
Errors
72
220
Double Plays
170
0.986
Fielding Percentage
0.986
34.6
Range Factor
35.4
0.0
Zone Rating
0.0
141
Games Played
141
0
Games Started
0
0.0
Defensive Wins Above Replacement
0.0
1
Qualified
1