

Athletics vs Mariners Live Score (5 Sep, 2026)
Game Information
Stage
STD
Season
2026
First Pitch
Fri, Sep 4, 10:10 pm
Venue
T-Mobile Park
Location
Seattle, Washington
Venue Type
Indoor
Broadcast
MLB.TV
Attendance
34,134
Live Situation
1Balls
0Strikes
0Outs
—Pitcher
—At Bat
Pitch Sequence
1
BALL
Four-seam FB
95 MPH
2
BALL IN PLAY
Four-seam FB
95 MPH
Injury Report
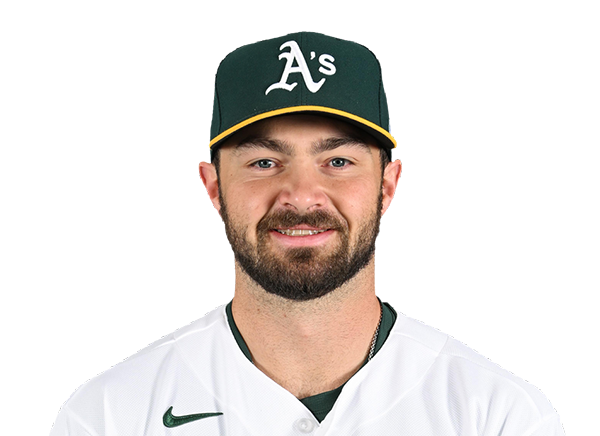
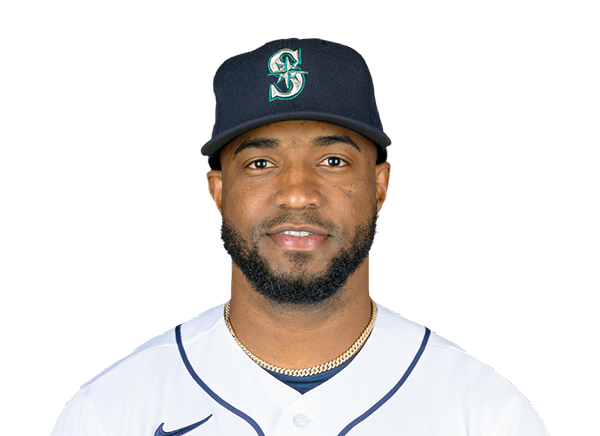


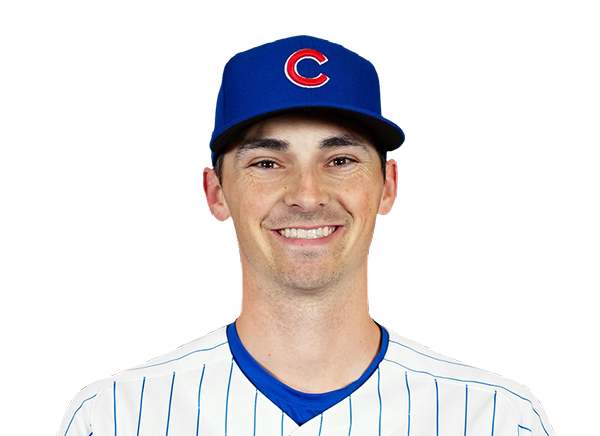
Team Stats
 ATH
SEA


7
Runs
6
11
Hits
10
1
Errors
1
4
Home Runs
1
3
Walks
4
12
Strikeouts
2
Player Box Score
Athletics
| Player | H-AB | AB | R | H | RBI | HR | BB | K | #P | AVG | OBP | SLG |
|---|---|---|---|---|---|---|---|---|---|---|---|---|
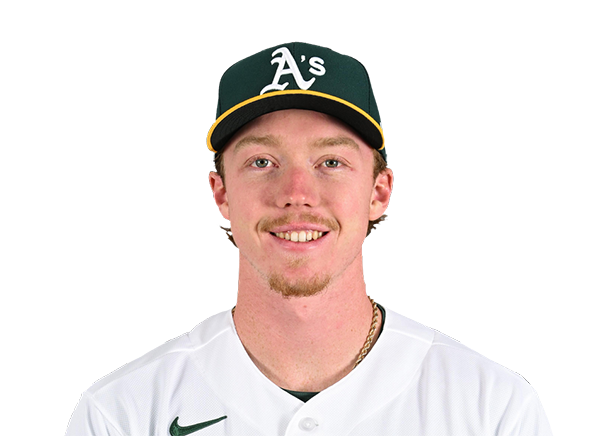 Henry Bolte | 0-3 | 3 | 1 | 0 | 0 | 0 | 2 | 2 | 27 | .274 | .354 | .386 |
 Jeff McNeil | 2-5 | 5 | 1 | 2 | 2 | 1 | 0 | 2 | 19 | .271 | .321 | .379 |
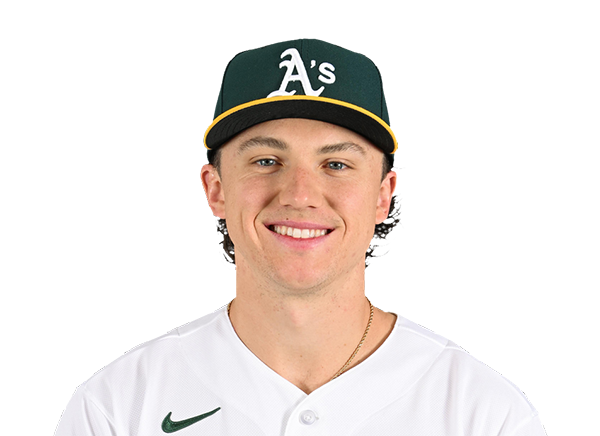 Zack Gelof | 2-5 | 5 | 2 | 2 | 2 | 1 | 0 | 1 | 19 | .260 | .326 | .476 |
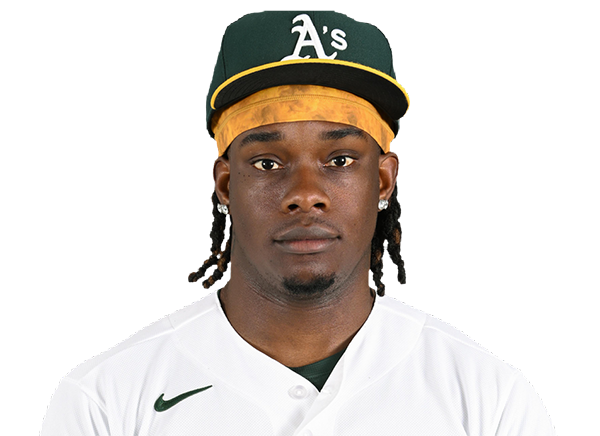 Lawrence Butler | 1-4 | 4 | 0 | 1 | 1 | 0 | 0 | 2 | 21 | .233 | .327 | .370 |
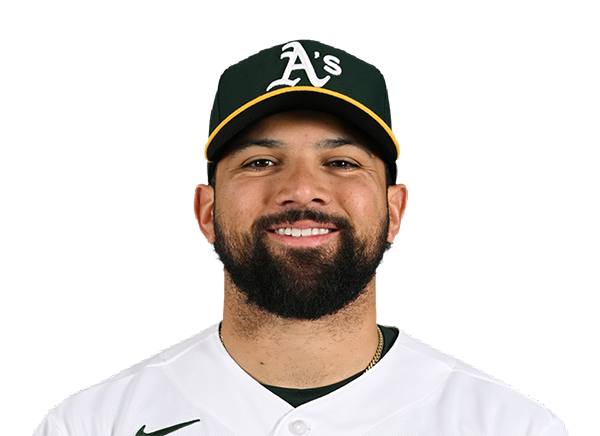 Carlos Cortes | 1-4 | 4 | 0 | 1 | 0 | 0 | 0 | 2 | 19 | .259 | .328 | .397 |
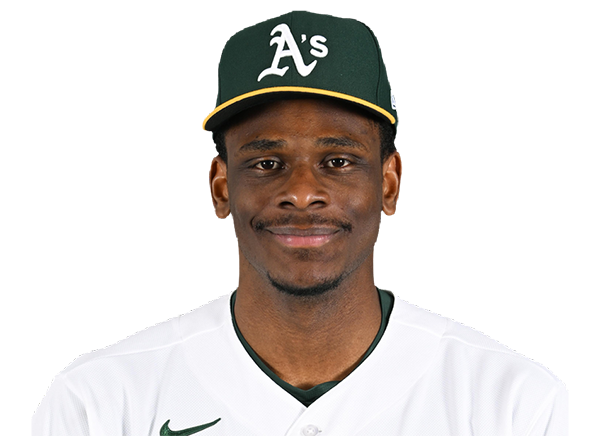 Denzel Clarke | 0-0 | 0 | 0 | 0 | 0 | 0 | 0 | 0 | 0 | .169 | .234 | .186 |
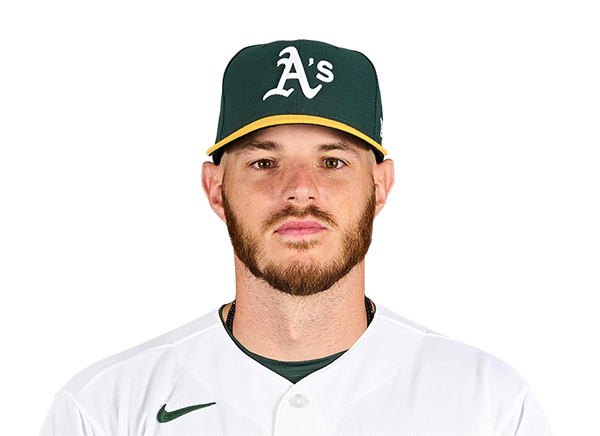 Jonah Heim | 1-4 | 4 | 0 | 1 | 0 | 0 | 0 | 1 | 15 | .215 | .273 | .394 |
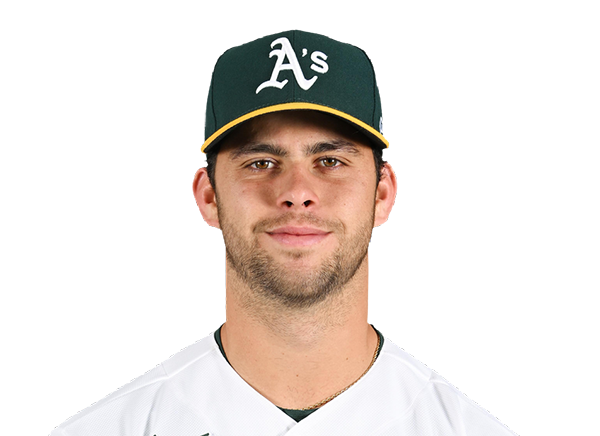 Max Muncy | 3-4 | 4 | 1 | 3 | 1 | 1 | 0 | 1 | 15 | .224 | .293 | .384 |
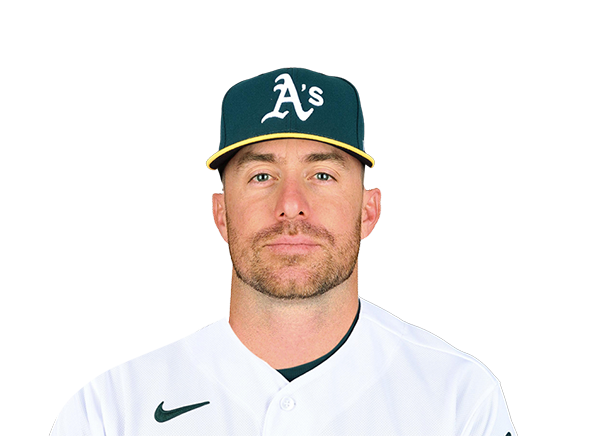 Donovan Walton | 0-4 | 4 | 0 | 0 | 0 | 0 | 0 | 1 | 14 | .272 | .376 | .439 |
 Alika Williams | 1-3 | 3 | 2 | 1 | 1 | 1 | 1 | 0 | 13 | .272 | .311 | .444 |
Seattle Mariners
| Player | H-AB | AB | R | H | RBI | HR | BB | K | #P | AVG | OBP | SLG |
|---|---|---|---|---|---|---|---|---|---|---|---|---|
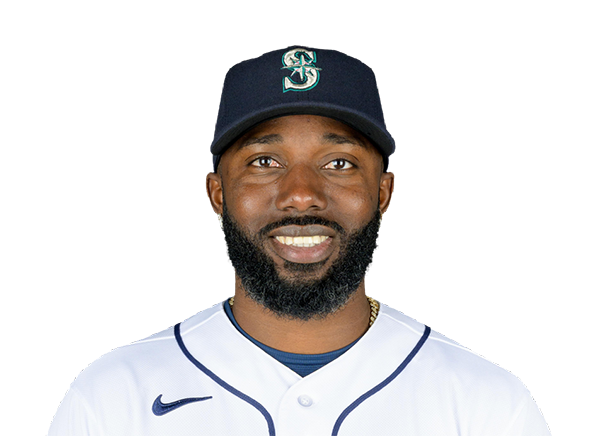 Randy Arozarena | 0-3 | 3 | 1 | 0 | 0 | 0 | 1 | 1 | 24 | .271 | .370 | .464 |
 Dominic Canzone | 1-5 | 5 | 0 | 1 | 0 | 0 | 0 | 0 | 18 | .254 | .329 | .481 |
 Julio Rodriguez | 0-5 | 5 | 0 | 0 | 1 | 0 | 0 | 0 | 13 | .242 | .303 | .398 |
 Cal Raleigh | 2-3 | 3 | 3 | 2 | 2 | 1 | 1 | 0 | 10 | .176 | .291 | .371 |
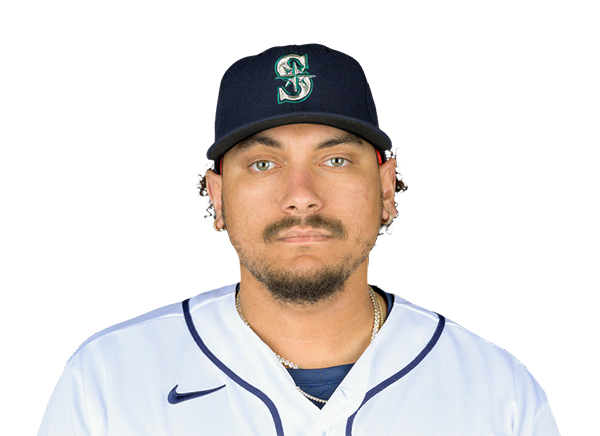 Josh Naylor | 3-4 | 4 | 0 | 3 | 1 | 0 | 0 | 0 | 14 | .269 | .327 | .366 |
 Cole Young | 1-4 | 4 | 1 | 1 | 1 | 0 | 0 | 0 | 12 | .246 | .308 | .383 |
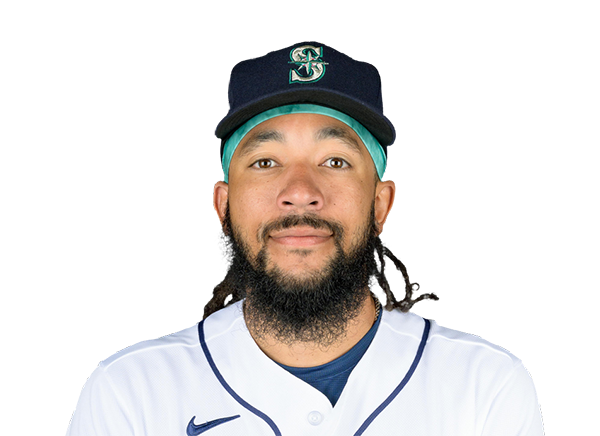 J.P. Crawford | 1-2 | 2 | 0 | 1 | 1 | 0 | 2 | 0 | 11 | .224 | .347 | .349 |
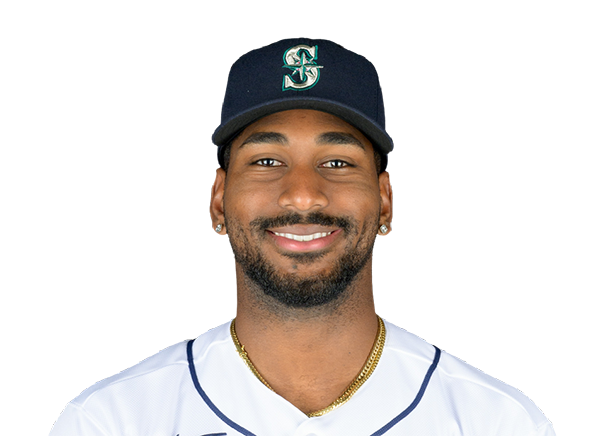 Lazaro Montes | 0-2 | 2 | 0 | 0 | 0 | 0 | 0 | 0 | 2 | .273 | .333 | .545 |
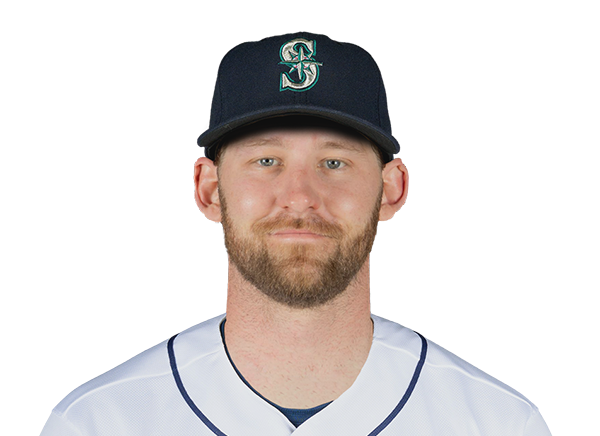 Taylor Ward | 0-2 | 2 | 0 | 0 | 0 | 0 | 0 | 0 | 9 | .225 | .358 | .314 |
 Brock Rodden | 2-3 | 3 | 1 | 2 | 0 | 0 | 0 | 0 | 10 | .224 | .328 | .306 |
 Patrick Wisdom | 0-1 | 1 | 0 | 0 | 0 | 0 | 0 | 1 | 5 | .106 | .160 | .191 |
Athletics
| Player | IP | H | R | ER | BB | K | HR | PC-ST | ERA | PC |
|---|---|---|---|---|---|---|---|---|---|---|
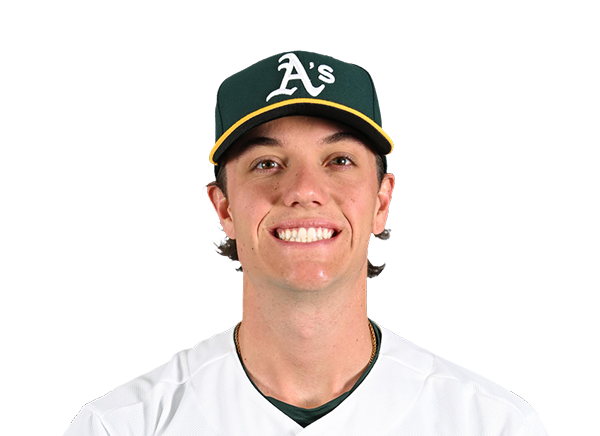 Kade Morris | 2.2 | 5 | 5 | 5 | 1 | 0 | 1 | 37-24 | 10.90 | 37 |
 Brady Basso | 3.0 | 3 | 0 | 0 | 1 | 0 | 0 | 38-25 | 4.32 | 38 |
 Geoff Hartlieb | 1.1 | 0 | 0 | 0 | 0 | 1 | 0 | 13-11 | 4.86 | 13 |
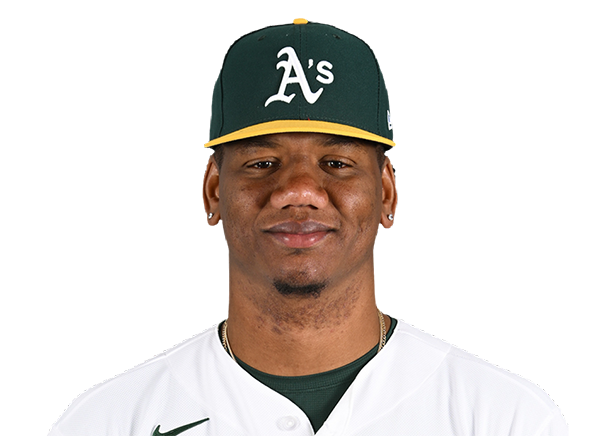 Elvis Alvarado | 1.0 | 2 | 1 | 1 | 1 | 0 | 0 | 24-16 | 4.11 | 24 |
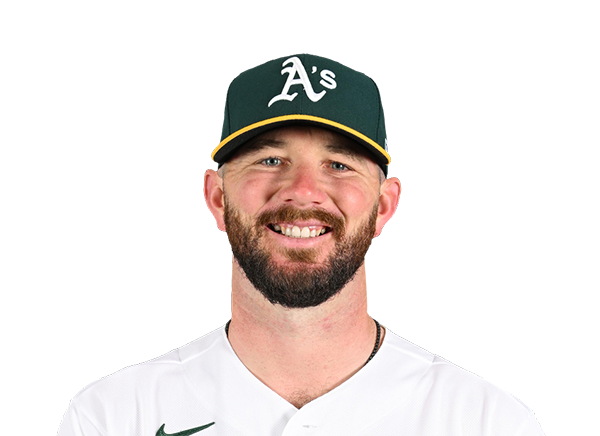 Hogan Harris | 1.0 | 0 | 0 | 0 | 1 | 1 | 0 | 16-9 | 3.38 | 16 |
Seattle Mariners
| Player | IP | H | R | ER | BB | K | HR | PC-ST | ERA | PC |
|---|---|---|---|---|---|---|---|---|---|---|
 Logan Gilbert | 4.2 | 8 | 7 | 7 | 2 | 10 | 4 | 99-59 | 3.71 | 99 |
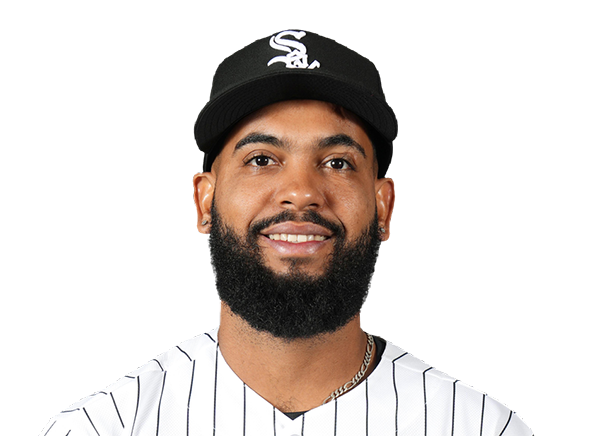 Seranthony Dominguez | 1.1 | 1 | 0 | 0 | 0 | 0 | 0 | 13-8 | 4.25 | 13 |
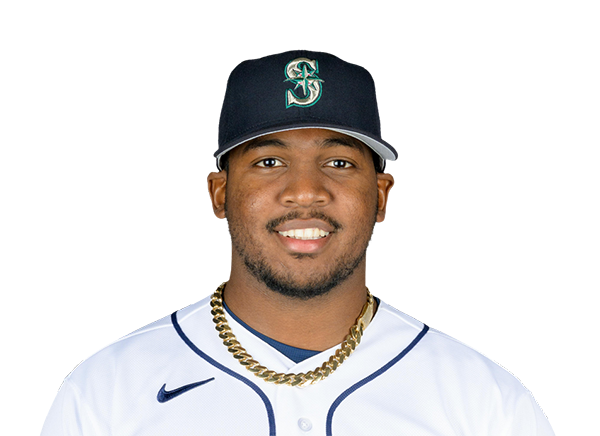 Jose Ferrer | 1.0 | 0 | 0 | 0 | 1 | 1 | 0 | 20-11 | 3.66 | 20 |
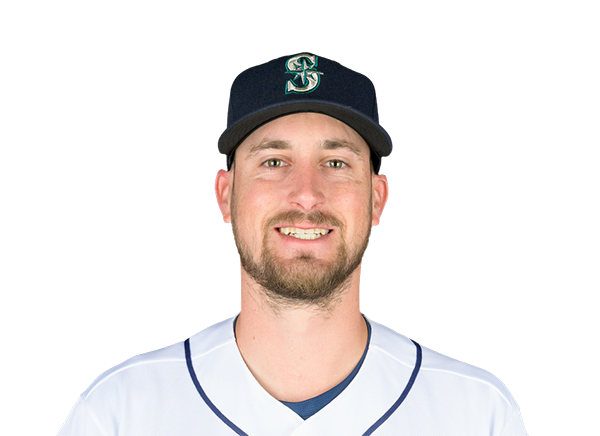 Cooper Criswell | 1.0 | 2 | 0 | 0 | 0 | 0 | 0 | 21-17 | 3.27 | 21 |
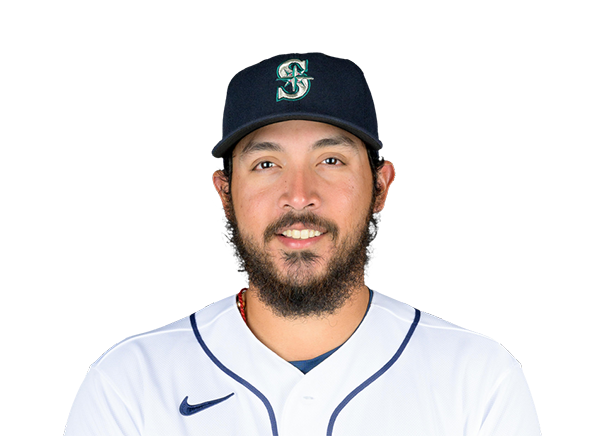 Andres Munoz | 1.0 | 0 | 0 | 0 | 0 | 1 | 0 | 9-6 | 4.21 | 9 |
H2H / Season Series
SEA6–7
ATH
SEA4–7
ATH
ATH1–9
SEA
ATH1–4
SEA
ATH2–9
SEA
SEA5–4
ATH
SEA2–5
ATH
SEA4–6
ATH
ATH4–6
SEA
Last 5 Games
| Date | Opponent | Result |
|---|---|---|
| Sep 4 | @ SEA | W7–6 |
| Sep 3 | @ SEA | W7–4 |
| Sep 2 |  @ TEX | W9–2 |
| Sep 1 | @ TEX | L5–8 |
| Aug 31 | @ TEX | L1–8 |
| Date | Opponent | Result |
|---|---|---|
| Sep 4 | vs ATH | L6–7 |
| Sep 3 | vs ATH | L4–7 |
| Sep 2 |  @ BOS | W8–3 |
| Sep 1 | @ BOS | W9–6 |
| Aug 31 | @ BOS | L8–9 |
Standings
American League
| Team | W | L | PCT | GB | DIFF | STRK |
|---|---|---|---|---|---|---|
1 Rays | 84 | 57 | .596 | - | +46 | W1 |
2 White Sox | 74 | 67 | .525 | 10 | +42 | W1 |
3 Astros | 73 | 69 | .514 | 11.5 | -36 | W3 |
4 Yankees | 80 | 61 | .567 | 4 | +114 | L1 |
| 5Red Sox | 77 | 65 | .542 | 7.5 | +79 | W2 |
6 Guardians | 72 | 70 | .507 | 12.5 | -9 | W2 |
7 Blue Jays | 71 | 71 | .500 | 13.5 | -34 | W3 |
| 8Rangers | 70 | 72 | .493 | 14.5 | -43 | L1 |
9 Orioles | 69 | 73 | .486 | 15.5 | -22 | L4 |
10 Twins | 67 | 74 | .475 | 17 | -41 | L2 |
| 11Mariners | 66 | 76 | .465 | 18.5 | -69 | L2 |
12 Tigers | 64 | 77 | .454 | 20 | +45 | L2 |
13 Royals | 63 | 79 | .444 | 21.5 | -92 | L1 |
| 14Athletics | 56 | 86 | .394 | 28.5 | -190 | W3 |
15 Angels | 53 | 88 | .376 | 31 | -81 | L3 |
National League
| Team | W | L | PCT | GB | DIFF | STRK |
|---|---|---|---|---|---|---|
1 Brewers | 88 | 54 | .620 | - | +174 | W1 |
2 Braves | 84 | 57 | .596 | 3.5 | +121 | W2 |
3 Dodgers | 84 | 57 | .596 | 3.5 | +149 | W2 |
4 Cubs | 80 | 62 | .563 | 8 | +138 | W2 |
5 Phillies | 79 | 62 | .560 | 8.5 | +33 | L2 |
6 Padres | 74 | 67 | .525 | 13.5 | +11 | W1 |
7 Diamondbacks | 74 | 68 | .521 | 14 | -3 | L1 |
8 Marlins | 71 | 71 | .500 | 17 | +9 | L2 |
9 Cardinals | 71 | 71 | .500 | 17 | -8 | W1 |
10 Pirates | 70 | 72 | .493 | 18 | +30 | W2 |
11 Reds | 67 | 74 | .475 | 20.5 | -111 | L1 |
12 Nationals | 67 | 76 | .469 | 21.5 | +12 | L2 |
13 Mets | 64 | 77 | .454 | 23.5 | -46 | W2 |
14 Giants | 58 | 84 | .408 | 30 | -77 | L2 |
15 Rockies | 54 | 87 | .383 | 33.5 | -141 | L1 |
ATH
VS
SEA
Pitchers
Kade Morris
Catchers
Jonah Heim
Infielders
Jeff McNeil
Zack Gelof
Donovan Walton
Alika Williams
Outfielders
Henry Bolte
Lawrence Butler
Carlos Cortes
Designated Hitters
Max Muncy
Pitchers
Logan Gilbert
Catchers
Cal Raleigh
Infielders
Josh Naylor
Cole Young
J.P. Crawford
Brock Rodden
Outfielders
Randy Arozarena
Julio Rodriguez
Lazaro Montes
Designated Hitters
Dominic Canzone
Athletics
VS
Mariners
Batting
142
Team Games Played
142
4828
At Bats
4705
1196
Hits
1080
599
Runs Batted In
544
172
Home Runs
163
75
Stolen Bases
98
.248
Batting Average
.230
625
Runs
565
220
Doubles
173
14
Triples
14
1960
Total Bases
1770
470
Walks
484
1218
Strikeouts
1237
.321
On Base Percentage
.311
.406
Slugging Percentage
.376
.727
OBP Pct + SLG Pct
.687
142
Games Played
142
142
Games Started
142
65
Hit By Pitch
85
0.0
Wins Above Replacement
0.0
0.0
Offensive Wins Above Replacement
0.0
27
Caught Stealing
36
1
Is Qualified
1
626.9
Runs Created
562.5
4.4
Runs Created Per 27 Outs
4.0
.087
Walks Per Plate Appearance
.091
0.39
Walk To Strikeout Ratio
0.39
.158
Isolated Power
.147
.266
Secondary Average
.263
3.81
Pitches Per Plate Appearance
3.91
406
Extra Base Hits
350
5409
Plate Appearances
5318
28.1
At Bats Per Home Run
28.9
19
Sacrifice Hit
11
25
Sacrifice Flies
32
Pitching
142
Team Games Played
142
29
Quality Starts
59
56
Wins
66
86
Losses
76
36
Saves
30
80
Holds
73
1319
Hits
1203
760
Earned runs
588
212
Home Runs
172
566
Walks
373
1198
Strikeouts
1198
8.6
Strikeouts Per 9 Innings
8.6
153.5
Pitches Per Start
142.8
1.50
Walks Plus Hits Per Inning Pitched
1.26
5.45
Earned Run Average
4.22
86
Losses
76
1256.0
Innings pitched
1253.1
.394
Win Percentage
.465
62
Save Opportunities
52
.269
Opponent Batting Average
.252
.349
Opponent's On-base pct.
.312
.462
Opponent's Slugging pct.
.414
.812
Opponent's OPB Pct + SLG Pct
.725
4898
At Bats
4781
264
Doubles
231
22
Triples
14
68
Batters Hit
61
95
Stolen Bases
102
142
Games Played
142
1
Complete Games
1
6
Shutouts
9
44
Wild Pitches
34
791
Runs Batted In
599
8
Balks
4
1256.0
Innings pitched
1253.1
8.6
Strikeouts Per 9 Innings
8.6
36
Caught Stealing
29
142
Games Started
142
0.0
Wins Above Replacement
0.0
1
Is Qualified
1
815
Runs
634
760
Earned Runs
588
2263
Total Bases
1978
Fielding
142
Team Games Played
142
1256
Full Innings
1253
4908
Total Chances
5003
3768
Putouts
3760
1071
Assists
1170
69
Errors
73
220
Double Plays
173
0.986
Fielding Percentage
0.985
34.7
Range Factor
35.4
0.0
Zone Rating
0.0
142
Games Played
142
0
Games Started
0
0.0
Defensive Wins Above Replacement
0.0
1
Qualified
1