

Athletics vs Mariners Live Score (6 Sep, 2026)
Game Information
Stage
STD
Season
2026
First Pitch
Sat, Sep 5, 9:40 pm
Venue
T-Mobile Park
Location
Seattle, Washington
Venue Type
Indoor
Broadcast
MLB.TV
Attendance
40,950
Live Situation
0Balls
0Strikes
0Outs
—Pitcher
—At Bat
Pitch Sequence
1
BALL IN PLAY
Four-seam FB
96 MPH
Injury Report
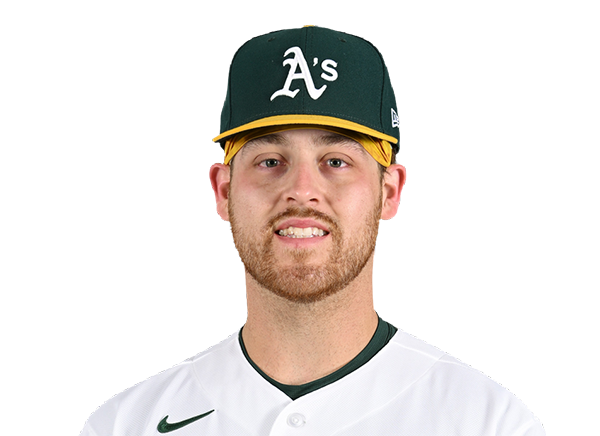
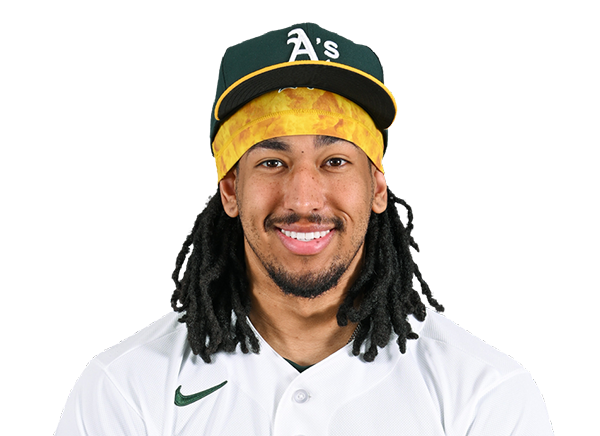
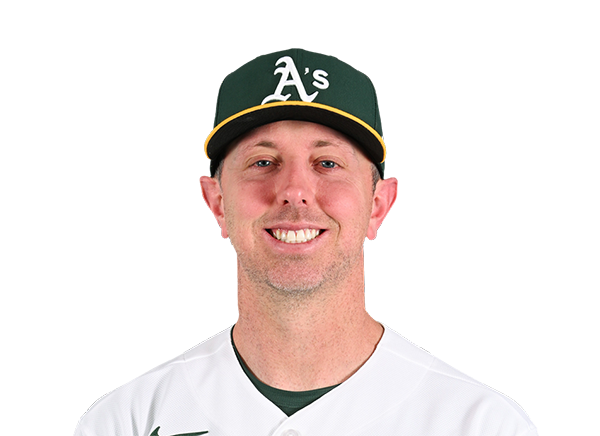
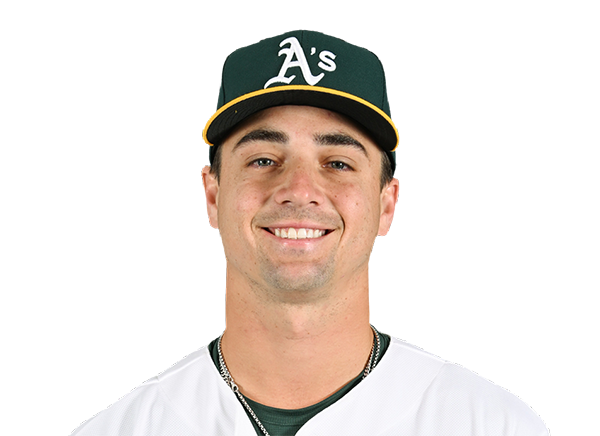
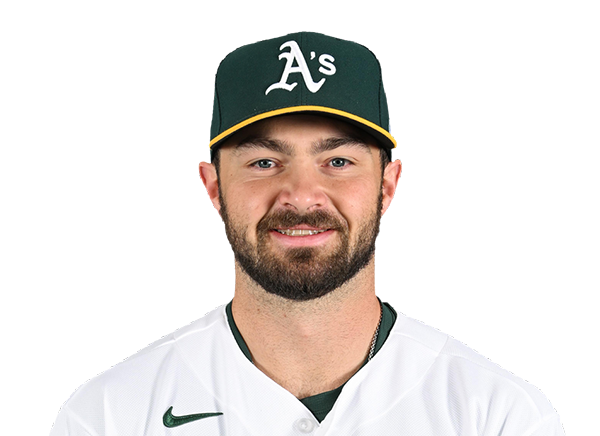
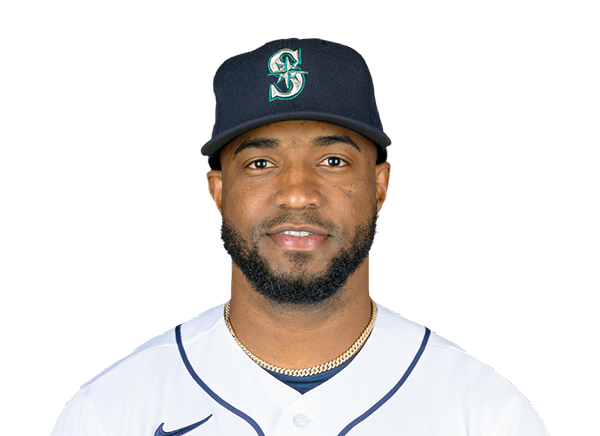

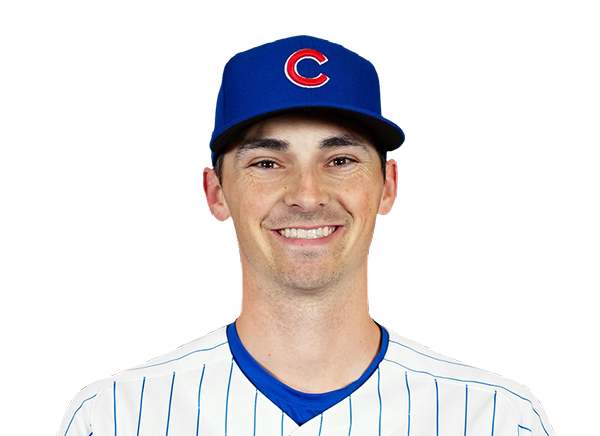

Team Stats
 ATH
SEA


6
Runs
2
9
Hits
6
0
Errors
0
2
Home Runs
0
1
Walks
3
7
Strikeouts
9
Player Box Score
Athletics
| Player | H-AB | AB | R | H | RBI | HR | BB | K | #P | AVG | OBP | SLG |
|---|---|---|---|---|---|---|---|---|---|---|---|---|
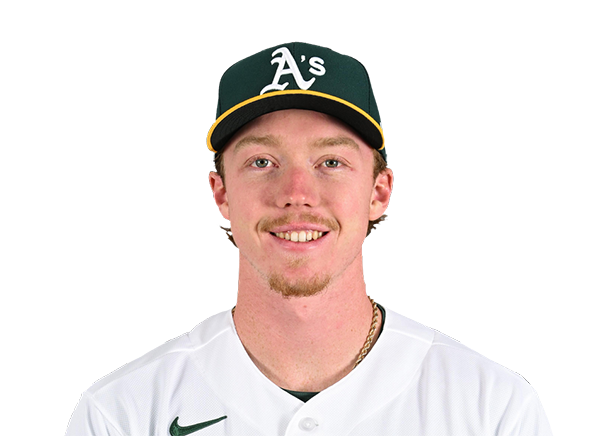 Henry Bolte | 1-4 | 4 | 0 | 1 | 1 | 0 | 0 | 2 | 19 | .274 | .353 | .388 |
 Jeff McNeil | 1-4 | 4 | 0 | 1 | 0 | 0 | 0 | 1 | 17 | .271 | .321 | .378 |
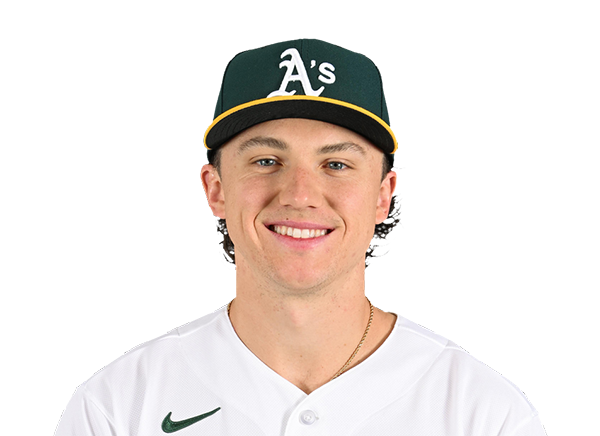 Zack Gelof | 1-4 | 4 | 2 | 1 | 0 | 0 | 0 | 0 | 11 | .260 | .325 | .474 |
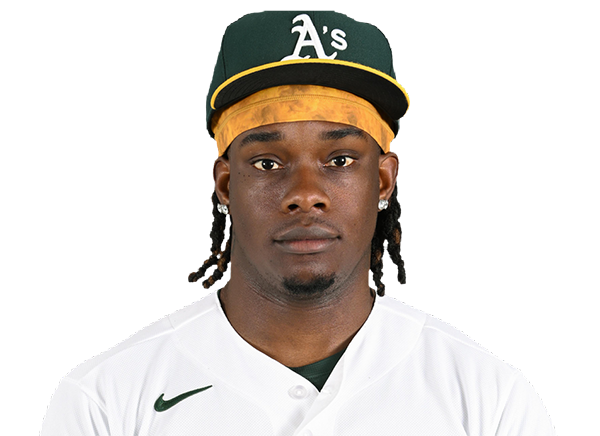 Lawrence Butler | 1-4 | 4 | 1 | 1 | 2 | 1 | 0 | 1 | 16 | .233 | .326 | .376 |
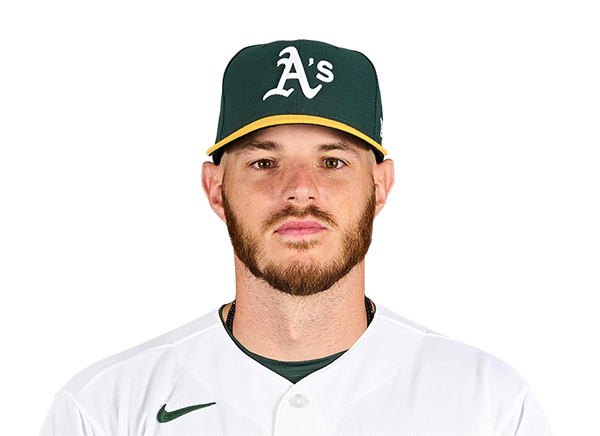 Jonah Heim | 0-3 | 3 | 0 | 0 | 0 | 0 | 1 | 1 | 20 | .213 | .272 | .390 |
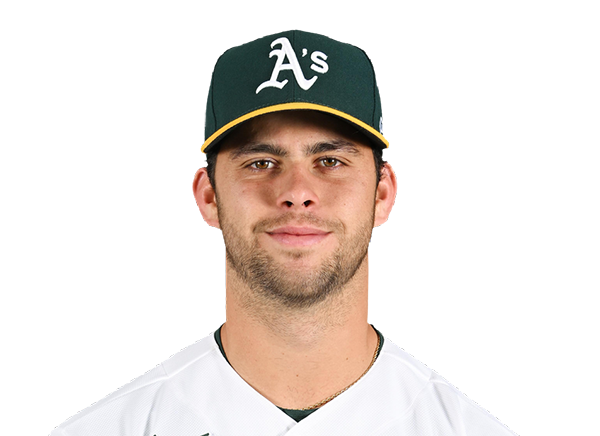 Max Muncy | 2-4 | 4 | 2 | 2 | 2 | 1 | 0 | 1 | 13 | .229 | .297 | .398 |
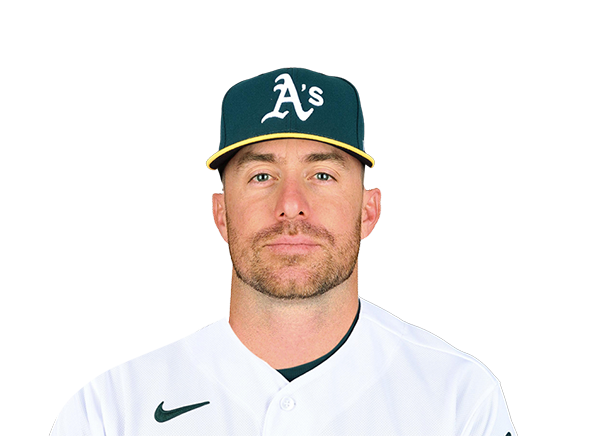 Donovan Walton | 1-4 | 4 | 0 | 1 | 1 | 0 | 0 | 1 | 12 | .271 | .374 | .441 |
 Alika Williams | 2-4 | 4 | 1 | 2 | 0 | 0 | 0 | 0 | 13 | .277 | .315 | .445 |
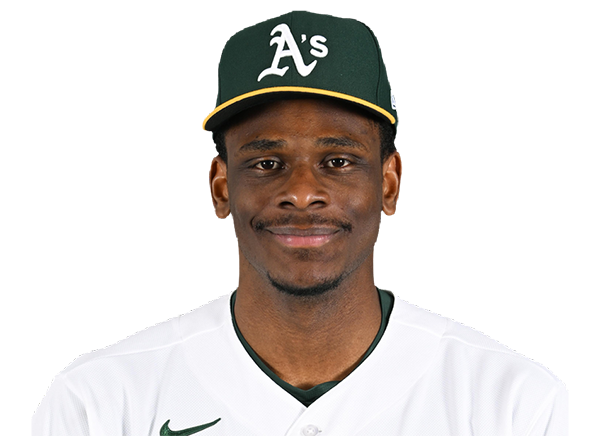 Denzel Clarke | 0-4 | 4 | 0 | 0 | 0 | 0 | 0 | 0 | 6 | .159 | .221 | .175 |
Seattle Mariners
| Player | H-AB | AB | R | H | RBI | HR | BB | K | #P | AVG | OBP | SLG |
|---|---|---|---|---|---|---|---|---|---|---|---|---|
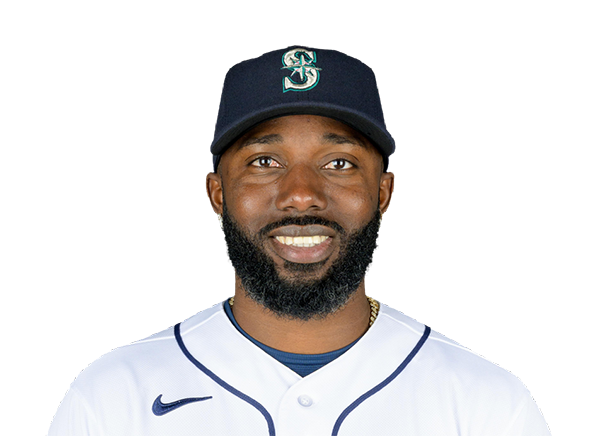 Randy Arozarena | 1-3 | 3 | 0 | 1 | 0 | 0 | 1 | 1 | 20 | .271 | .371 | .463 |
 Dominic Canzone | 1-4 | 4 | 0 | 1 | 1 | 0 | 0 | 0 | 16 | .254 | .328 | .479 |
 Julio Rodriguez | 0-4 | 4 | 0 | 0 | 0 | 0 | 0 | 1 | 10 | .240 | .301 | .395 |
 Cal Raleigh | 3-4 | 4 | 1 | 3 | 0 | 0 | 0 | 1 | 15 | .182 | .296 | .378 |
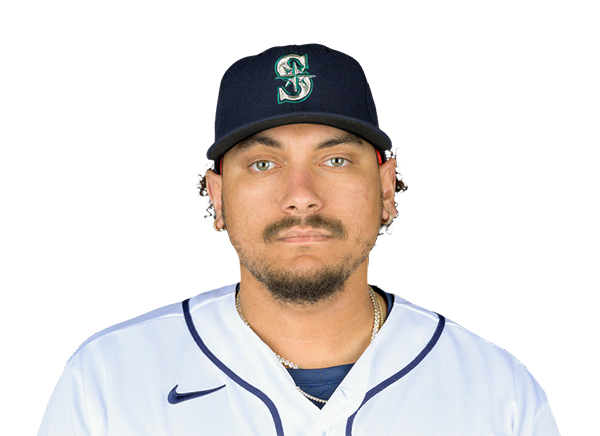 Josh Naylor | 0-4 | 4 | 0 | 0 | 0 | 0 | 0 | 0 | 8 | .267 | .325 | .363 |
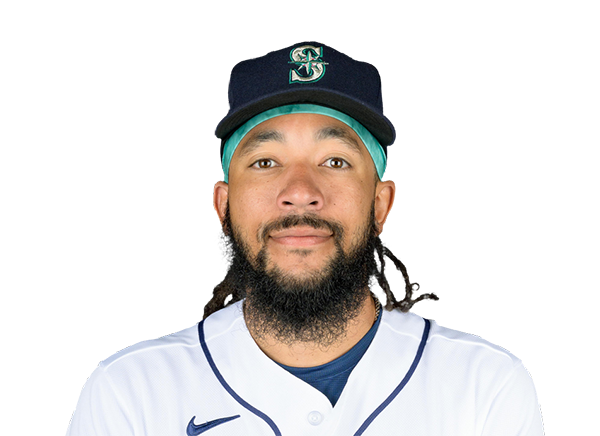 J.P. Crawford | 1-3 | 3 | 0 | 1 | 0 | 0 | 1 | 1 | 16 | .225 | .349 | .349 |
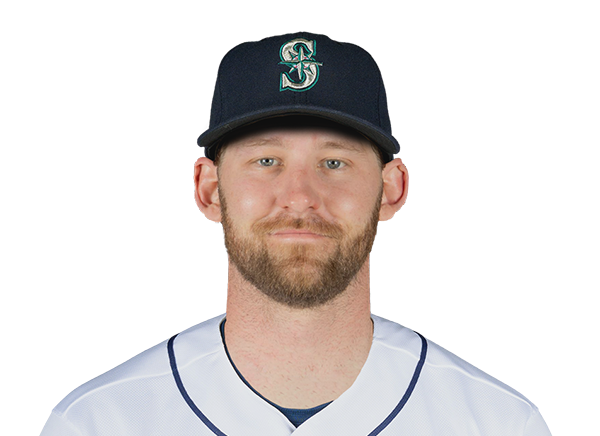 Taylor Ward | 0-2 | 2 | 0 | 0 | 0 | 0 | 0 | 1 | 9 | .224 | .357 | .313 |
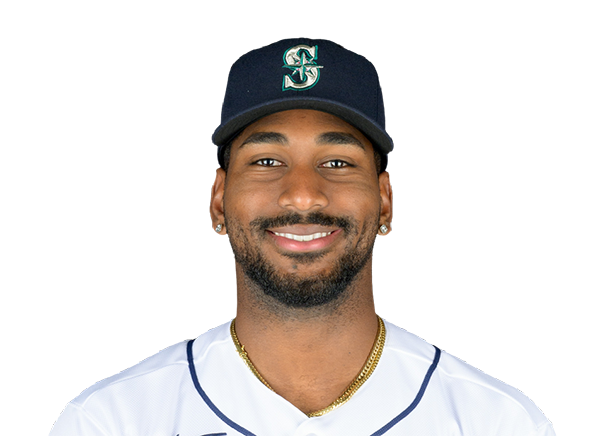 Lazaro Montes | 0-2 | 2 | 0 | 0 | 0 | 0 | 0 | 2 | 8 | .231 | .286 | .462 |
 Cole Young | 0-2 | 2 | 1 | 0 | 0 | 0 | 1 | 1 | 15 | .245 | .309 | .382 |
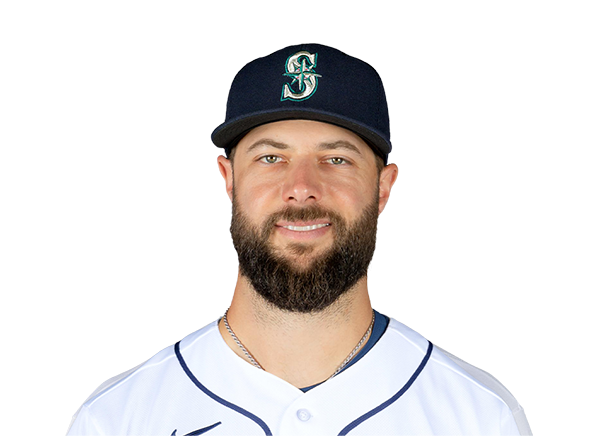 Weston Wilson | 0-4 | 4 | 0 | 0 | 0 | 0 | 0 | 1 | 10 | .202 | .295 | .326 |
Athletics
| Player | IP | H | R | ER | BB | K | HR | PC-ST | ERA | PC |
|---|---|---|---|---|---|---|---|---|---|---|
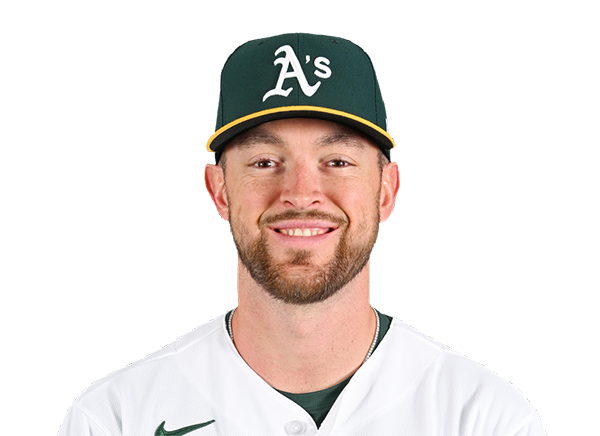 Jeffrey Springs | 7.0 | 2 | 0 | 0 | 2 | 6 | 0 | 81-50 | 6.02 | 81 |
 Geoff Hartlieb | 1.0 | 2 | 1 | 1 | 0 | 2 | 0 | 22-15 | 5.09 | 22 |
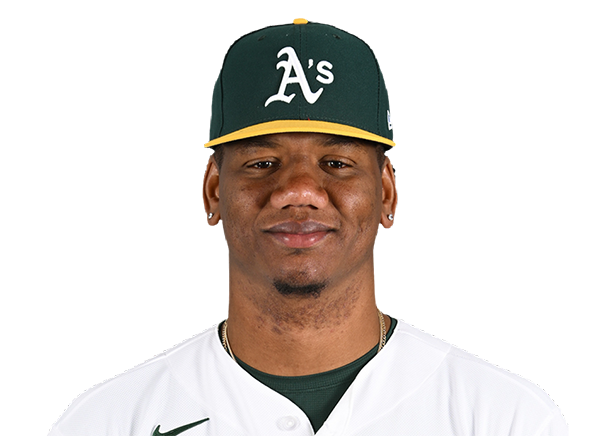 Elvis Alvarado | 1.0 | 2 | 1 | 1 | 1 | 1 | 0 | 24-14 | 4.21 | 24 |
Seattle Mariners
| Player | IP | H | R | ER | BB | K | HR | PC-ST | ERA | PC |
|---|---|---|---|---|---|---|---|---|---|---|
 George Kirby | 6.2 | 7 | 4 | 3 | 1 | 5 | 1 | 100-67 | 4.18 | 100 |
 Michael Rucker | 1.1 | 2 | 2 | 2 | 0 | 2 | 1 | 20-14 | 6.88 | 20 |
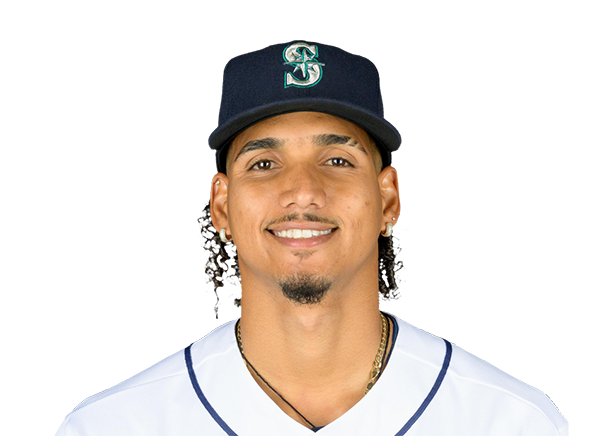 Carlos Vargas | 1.0 | 0 | 0 | 0 | 0 | 0 | 0 | 7-6 | 3.86 | 7 |
H2H / Season Series
SEA2–6
ATH
SEA6–7
ATH
SEA4–7
ATH
ATH1–9
SEA
ATH1–4
SEA
ATH2–9
SEA
SEA5–4
ATH
SEA2–5
ATH
SEA4–6
ATH
ATH4–6
SEA
Last 5 Games
| Date | Opponent | Result |
|---|---|---|
| Sep 5 | @ SEA | W6–2 |
| Sep 4 | @ SEA | W7–6 |
| Sep 3 | @ SEA | W7–4 |
| Sep 2 |  @ TEX | W9–2 |
| Sep 1 | @ TEX | L5–8 |
| Date | Opponent | Result |
|---|---|---|
| Sep 5 | vs ATH | L2–6 |
| Sep 4 | vs ATH | L6–7 |
| Sep 3 | vs ATH | L4–7 |
| Sep 2 |  @ BOS | W8–3 |
| Sep 1 | @ BOS | W9–6 |
Standings
American League
| Team | W | L | PCT | GB | DIFF | STRK |
|---|---|---|---|---|---|---|
1 Rays | 84 | 57 | .596 | - | +46 | W1 |
2 White Sox | 74 | 67 | .525 | 10 | +42 | W1 |
3 Astros | 73 | 69 | .514 | 11.5 | -36 | W3 |
4 Yankees | 80 | 61 | .567 | 4 | +114 | L1 |
| 5Red Sox | 77 | 65 | .542 | 7.5 | +79 | W2 |
6 Guardians | 72 | 70 | .507 | 12.5 | -9 | W2 |
7 Blue Jays | 71 | 71 | .500 | 13.5 | -34 | W3 |
| 8Rangers | 70 | 72 | .493 | 14.5 | -43 | L1 |
9 Orioles | 69 | 73 | .486 | 15.5 | -22 | L4 |
10 Twins | 67 | 74 | .475 | 17 | -41 | L2 |
| 11Mariners | 66 | 76 | .465 | 18.5 | -69 | L2 |
12 Tigers | 64 | 77 | .454 | 20 | +45 | L2 |
13 Royals | 63 | 79 | .444 | 21.5 | -92 | L1 |
| 14Athletics | 56 | 86 | .394 | 28.5 | -190 | W3 |
15 Angels | 53 | 88 | .376 | 31 | -81 | L3 |
National League
| Team | W | L | PCT | GB | DIFF | STRK |
|---|---|---|---|---|---|---|
1 Brewers | 88 | 54 | .620 | - | +174 | W1 |
2 Braves | 84 | 57 | .596 | 3.5 | +121 | W2 |
3 Dodgers | 84 | 57 | .596 | 3.5 | +149 | W2 |
4 Cubs | 80 | 62 | .563 | 8 | +138 | W2 |
5 Phillies | 79 | 62 | .560 | 8.5 | +33 | L2 |
6 Padres | 74 | 67 | .525 | 13.5 | +11 | W1 |
7 Diamondbacks | 74 | 68 | .521 | 14 | -3 | L1 |
8 Marlins | 71 | 71 | .500 | 17 | +9 | L2 |
9 Cardinals | 71 | 71 | .500 | 17 | -8 | W1 |
10 Pirates | 70 | 72 | .493 | 18 | +30 | W2 |
11 Reds | 67 | 74 | .475 | 20.5 | -111 | L1 |
12 Nationals | 67 | 76 | .469 | 21.5 | +12 | L2 |
13 Mets | 64 | 77 | .454 | 23.5 | -46 | W2 |
14 Giants | 58 | 84 | .408 | 30 | -77 | L2 |
15 Rockies | 54 | 87 | .383 | 33.5 | -141 | L1 |
ATH
VS
SEA
Pitchers
Jeffrey Springs
Catchers
Jonah Heim
Infielders
Jeff McNeil
Zack Gelof
Donovan Walton
Alika Williams
Outfielders
Henry Bolte
Lawrence Butler
Denzel Clarke
Designated Hitters
Max Muncy
Pitchers
George Kirby
Catchers
Cal Raleigh
Infielders
Josh Naylor
J.P. Crawford
Cole Young
Weston Wilson
Outfielders
Randy Arozarena
Dominic Canzone
Julio Rodriguez
Designated Hitters
Taylor Ward
Athletics
VS
Mariners
Batting
143
Team Games Played
143
4863
At Bats
4737
1205
Hits
1086
605
Runs Batted In
545
174
Home Runs
163
76
Stolen Bases
98
.248
Batting Average
.229
631
Runs
567
222
Doubles
174
14
Triples
14
1977
Total Bases
1777
471
Walks
487
1225
Strikeouts
1246
.321
On Base Percentage
.311
.407
Slugging Percentage
.375
.728
OBP Pct + SLG Pct
.686
143
Games Played
143
143
Games Started
143
65
Hit By Pitch
86
0.0
Wins Above Replacement
0.0
0.0
Offensive Wins Above Replacement
0.0
27
Caught Stealing
36
1
Is Qualified
1
631.9
Runs Created
564.2
4.4
Runs Created Per 27 Outs
4.0
.087
Walks Per Plate Appearance
.091
0.38
Walk To Strikeout Ratio
0.39
.159
Isolated Power
.146
.266
Secondary Average
.262
3.81
Pitches Per Plate Appearance
3.91
410
Extra Base Hits
351
5445
Plate Appearances
5354
27.9
At Bats Per Home Run
29.1
19
Sacrifice Hit
11
25
Sacrifice Flies
32
Pitching
143
Team Games Played
143
30
Quality Starts
60
57
Wins
66
86
Losses
77
36
Saves
30
80
Holds
73
1325
Hits
1212
762
Earned runs
593
212
Home Runs
174
569
Walks
374
1207
Strikeouts
1205
8.6
Strikeouts Per 9 Innings
8.6
153.4
Pitches Per Start
142.7
1.50
Walks Plus Hits Per Inning Pitched
1.26
5.42
Earned Run Average
4.23
86
Losses
77
1265.0
Innings pitched
1262.1
.399
Win Percentage
.462
62
Save Opportunities
52
.269
Opponent Batting Average
.252
.349
Opponent's On-base pct.
.311
.460
Opponent's Slugging pct.
.414
.809
Opponent's OPB Pct + SLG Pct
.726
4930
At Bats
4816
265
Doubles
233
22
Triples
14
69
Batters Hit
61
95
Stolen Bases
103
143
Games Played
143
1
Complete Games
1
6
Shutouts
9
45
Wild Pitches
34
792
Runs Batted In
605
8
Balks
4
1265.0
Innings pitched
1262.1
8.6
Strikeouts Per 9 Innings
8.6
36
Caught Stealing
29
143
Games Started
143
0.0
Wins Above Replacement
0.0
1
Is Qualified
1
817
Runs
640
762
Earned Runs
593
2270
Total Bases
1995
Fielding
143
Team Games Played
143
1265
Full Innings
1262
4944
Total Chances
5040
3795
Putouts
3787
1080
Assists
1180
69
Errors
73
222
Double Plays
174
0.986
Fielding Percentage
0.986
34.7
Range Factor
35.4
0.0
Zone Rating
0.0
143
Games Played
143
0
Games Started
0
0.0
Defensive Wins Above Replacement
0.0
1
Qualified
1