

Athletics vs Rays Live Score (15 Sep, 2026)
Game Information
Stage
STD
Season
2026
First Pitch
Tue, Sep 15, 6:40 pm
Venue
Tropicana Field
Location
St. Petersburg, Florida
Venue Type
Indoor
Broadcast
MLB.TV
Attendance
16,102
Live Situation
0Balls
2Strikes
0Outs
—Pitcher
—At Bat
Pitch Sequence
1
STRIKE LOOKING
Four-seam FB
100 MPH
2
STRIKE FOUL
Slider
88 MPH
3
BALL IN PLAY
Four-seam FB
100 MPH
Injury Report

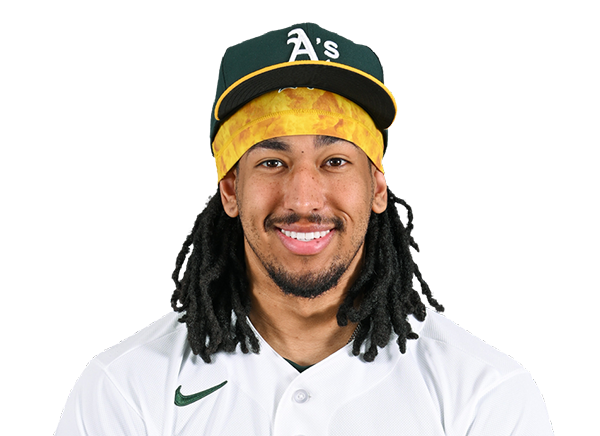
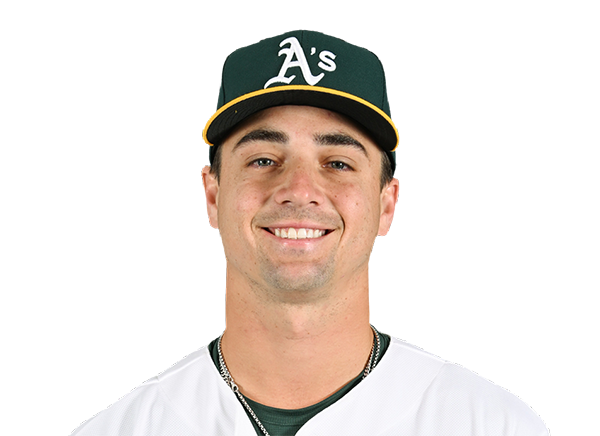
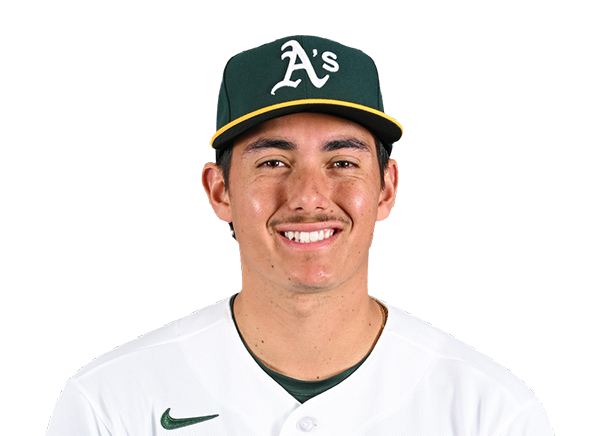




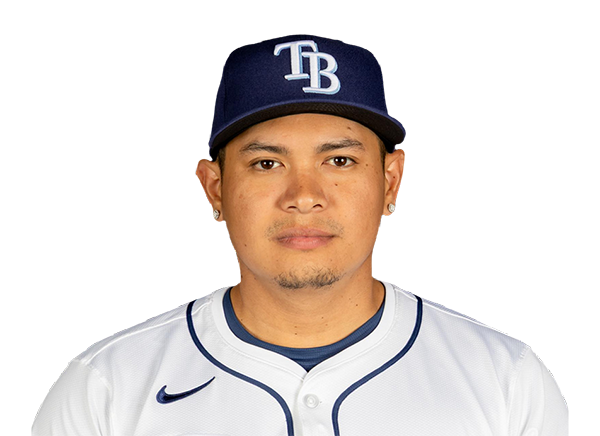
Team Stats
 ATH
TB


1
Runs
2
4
Hits
6
0
Errors
0
0
Home Runs
1
0
Walks
1
12
Strikeouts
10
Player Box Score
Athletics
| Player | H-AB | AB | R | H | RBI | HR | BB | K | #P | AVG | OBP | SLG |
|---|---|---|---|---|---|---|---|---|---|---|---|---|
 Henry Bolte | 1-4 | 4 | 1 | 1 | 0 | 0 | 0 | 3 | 17 | .275 | .358 | .396 |
 Jeff McNeil | 1-4 | 4 | 0 | 1 | 0 | 0 | 0 | 1 | 13 | .267 | .315 | .369 |
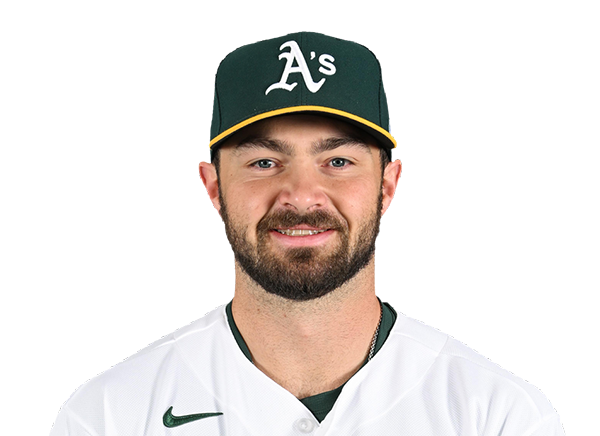 Shea Langeliers | 1-4 | 4 | 0 | 1 | 0 | 0 | 0 | 1 | 18 | .266 | .333 | .495 |
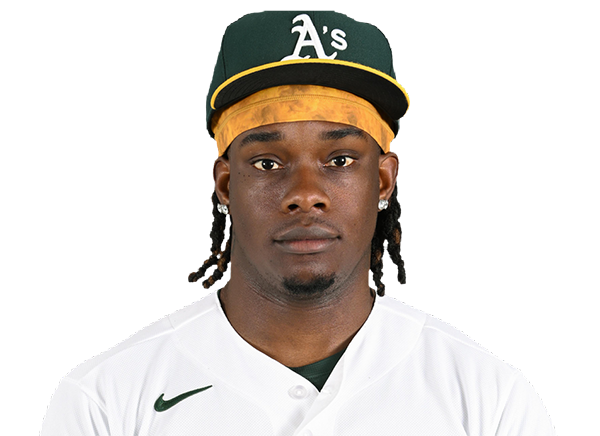 Lawrence Butler | 0-4 | 4 | 0 | 0 | 0 | 0 | 0 | 2 | 18 | .228 | .318 | .384 |
 Zack Gelof | 0-3 | 3 | 0 | 0 | 0 | 0 | 0 | 1 | 12 | .250 | .316 | .457 |
 Donovan Walton | 0-2 | 2 | 0 | 0 | 0 | 0 | 0 | 1 | 7 | .269 | .372 | .453 |
 Tommy White | 0-1 | 1 | 0 | 0 | 0 | 0 | 0 | 0 | 2 | .247 | .263 | .315 |
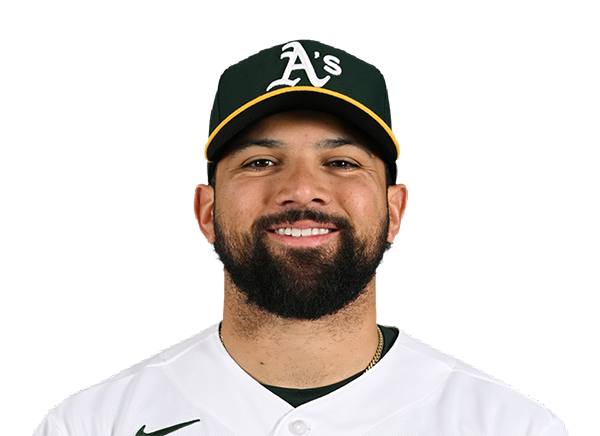 Carlos Cortes | 0-3 | 3 | 0 | 0 | 0 | 0 | 0 | 1 | 12 | .255 | .323 | .391 |
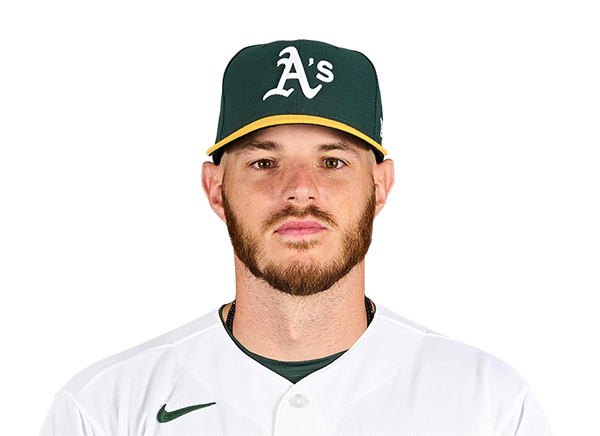 Jonah Heim | 0-3 | 3 | 0 | 0 | 0 | 0 | 0 | 1 | 9 | .207 | .264 | .375 |
 Alika Williams | 1-3 | 3 | 0 | 1 | 0 | 0 | 0 | 1 | 9 | .260 | .298 | .423 |
Tampa Bay Rays
| Player | H-AB | AB | R | H | RBI | HR | BB | K | #P | AVG | OBP | SLG |
|---|---|---|---|---|---|---|---|---|---|---|---|---|
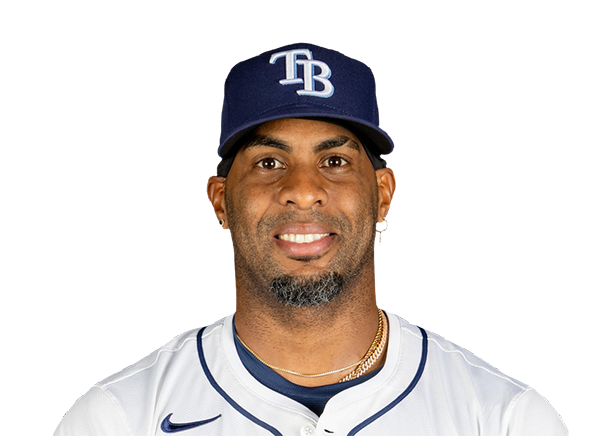 Yandy Diaz | 0-4 | 4 | 0 | 0 | 0 | 0 | 0 | 1 | 18 | .299 | .364 | .460 |
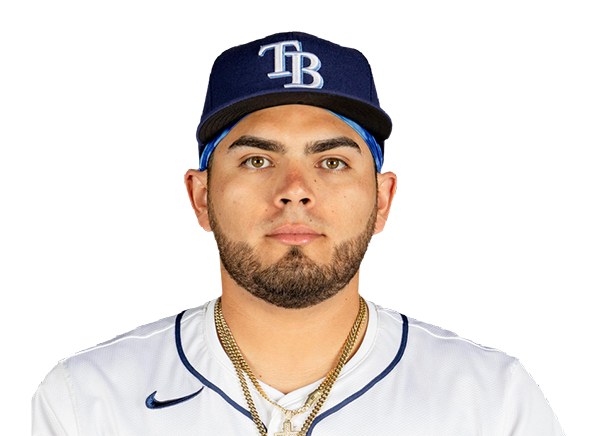 Jonathan Aranda | 1-4 | 4 | 0 | 1 | 0 | 0 | 0 | 2 | 18 | .278 | .361 | .436 |
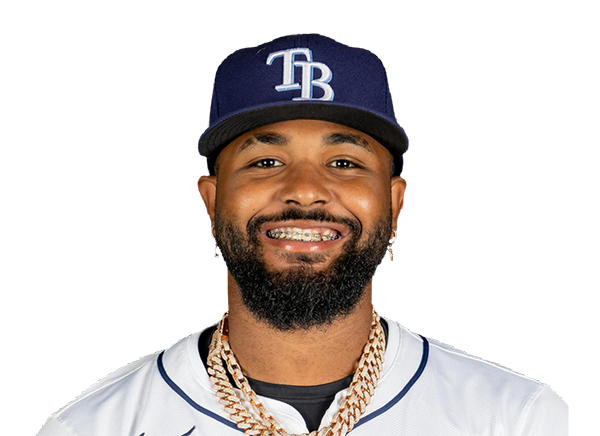 Junior Caminero | 1-4 | 4 | 1 | 1 | 1 | 1 | 0 | 2 | 16 | .279 | .363 | .535 |
 Liam Hicks | 0-2 | 2 | 0 | 0 | 0 | 0 | 1 | 1 | 12 | .284 | .367 | .440 |
 Jonny DeLuca | 0-0 | 0 | 0 | 0 | 0 | 0 | 0 | 0 | 0 | .263 | .295 | .416 |
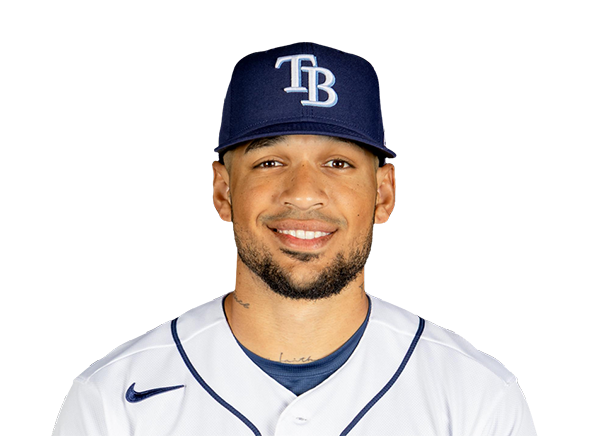 Victor Mesa Jr. | 0-3 | 3 | 0 | 0 | 0 | 0 | 0 | 0 | 4 | .257 | .326 | .510 |
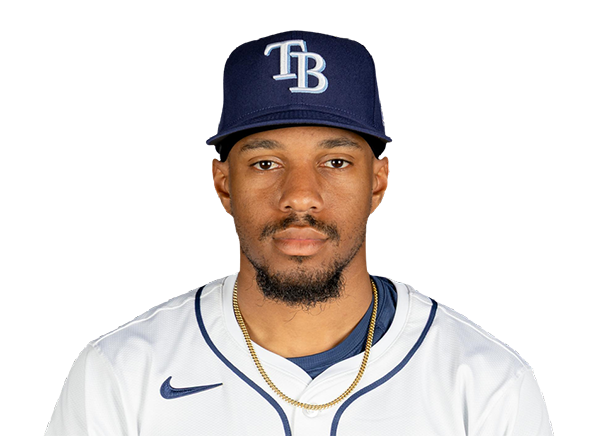 Chandler Simpson | 3-3 | 3 | 1 | 3 | 0 | 0 | 0 | 0 | 7 | .308 | .337 | .359 |
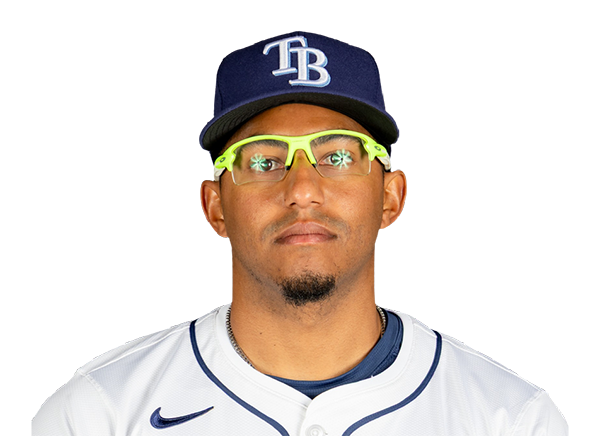 Richie Palacios | 0-3 | 3 | 0 | 0 | 0 | 0 | 0 | 1 | 6 | .233 | .327 | .376 |
 Jorge Mateo | 1-3 | 3 | 0 | 1 | 0 | 0 | 0 | 2 | 12 | .209 | .255 | .326 |
 Cedric Mullins | 0-2 | 2 | 0 | 0 | 0 | 0 | 0 | 1 | 11 | .201 | .283 | .341 |
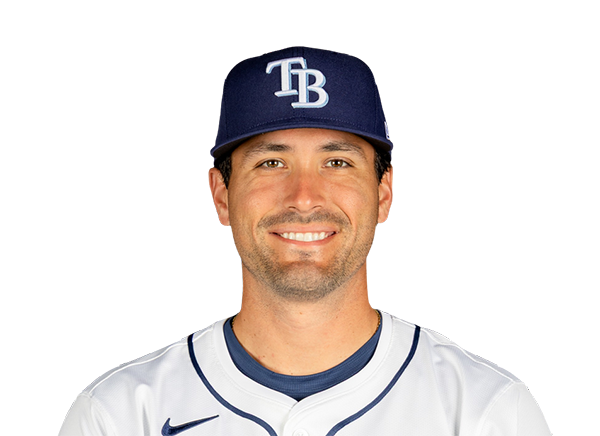 Nick Fortes | 0-1 | 1 | 0 | 0 | 0 | 0 | 0 | 0 | 4 | .263 | .309 | .371 |
Athletics
| Player | IP | H | R | ER | BB | K | HR | PC-ST | ERA | PC |
|---|---|---|---|---|---|---|---|---|---|---|
 Jack Perkins | 6.2 | 4 | 1 | 0 | 1 | 8 | 0 | 83-53 | 6.14 | 83 |
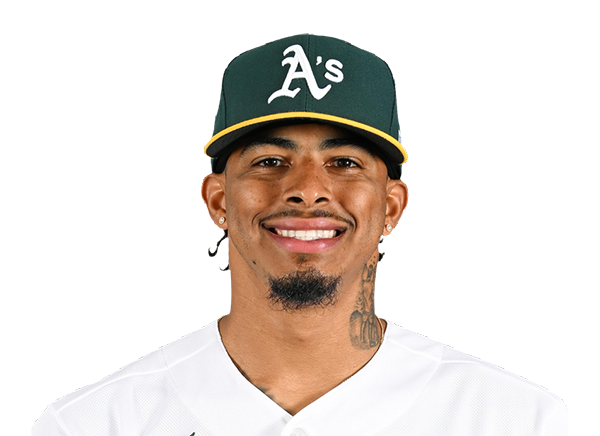 Luis Medina | 0.1 | 0 | 0 | 0 | 0 | 1 | 0 | 3-3 | 3.29 | 3 |
 Hogan Harris | 1.0 | 1 | 0 | 0 | 0 | 1 | 0 | 19-12 | 3.38 | 19 |
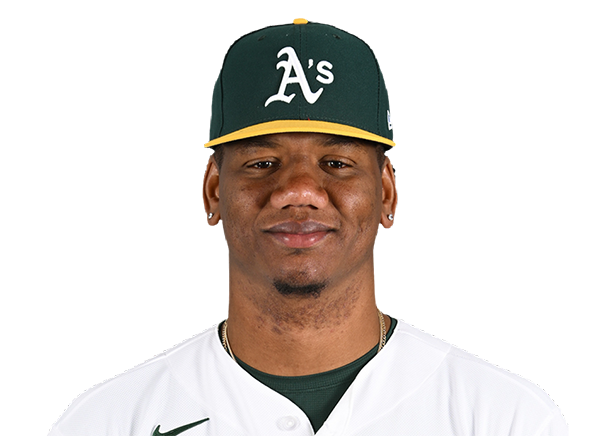 Elvis Alvarado | 0.0 | 1 | 1 | 1 | 0 | 0 | 1 | 3-3 | 4.14 | 3 |
Tampa Bay Rays
| Player | IP | H | R | ER | BB | K | HR | PC-ST | ERA | PC |
|---|---|---|---|---|---|---|---|---|---|---|
 Griffin Jax | 5.0 | 2 | 0 | 0 | 0 | 7 | 0 | 67-46 | 3.80 | 67 |
 Ty Johnson | 0.2 | 2 | 1 | 1 | 0 | 1 | 0 | 16-12 | 6.00 | 16 |
 Cam Booser | 1.1 | 0 | 0 | 0 | 0 | 1 | 0 | 15-10 | 2.19 | 15 |
 Kevin Kelly | 1.0 | 0 | 0 | 0 | 0 | 3 | 0 | 12-9 | 2.48 | 12 |
 Bryan Baker | 1.0 | 0 | 0 | 0 | 0 | 0 | 0 | 7-3 | 1.52 | 7 |
H2H / Season Series
TB2–1
ATH
ATH4–8
TB
ATH4–12
TB
ATH6–10
TB
Last 5 Games
| Date | Opponent | Result |
|---|---|---|
| Sep 15 | @ TB | L1–2 |
| Sep 13 |  vs SEA | W8–7 |
| Sep 12 | vs SEA | L1–19 |
| Sep 11 | vs SEA | W6–5 |
| Sep 9 |  vs TOR | W2–0 |
| Date | Opponent | Result |
|---|---|---|
| Sep 15 | vs ATH | W2–1 |
| Sep 13 |  vs HOU | W14–4 |
| Sep 12 | vs HOU | W3–2 |
| Sep 11 | vs HOU | W3–1 |
| Sep 10 |  @ ATL | L1–3 |
Standings
American League
| Team | W | L | PCT | GB | DIFF | STRK |
|---|---|---|---|---|---|---|
| 1Rays | 91 | 59 | .607 | - | +70 | W4 |
2 White Sox | 77 | 74 | .510 | 14.5 | +37 | L1 |
| 3Astros | 76 | 75 | .503 | 15.5 | -51 | W1 |
4 Yankees | 88 | 63 | .583 | 3.5 | +137 | W3 |
5 Red Sox | 82 | 69 | .543 | 9.5 | +86 | L1 |
6 Guardians | 77 | 75 | .507 | 15 | -10 | W1 |
7 Rangers | 75 | 76 | .497 | 16.5 | -42 | W3 |
| 8Blue Jays | 75 | 77 | .493 | 17 | -41 | L2 |
9 Orioles | 74 | 78 | .487 | 18 | -32 | W2 |
10 Tigers | 72 | 79 | .477 | 19.5 | +80 | W6 |
11 Twins | 70 | 81 | .464 | 21.5 | -74 | L3 |
| 12Mariners | 70 | 82 | .461 | 22 | -61 | L3 |
13 Royals | 66 | 85 | .437 | 25.5 | -96 | L3 |
| 14Athletics | 61 | 90 | .404 | 30.5 | -204 | L1 |
15 Angels | 58 | 93 | .384 | 33.5 | -73 | W2 |
National League
| Team | W | L | PCT | GB | DIFF | STRK |
|---|---|---|---|---|---|---|
1 Brewers | 94 | 57 | .623 | - | +199 | W1 |
2 Dodgers | 92 | 59 | .609 | 2 | +177 | W2 |
| 3Braves | 89 | 63 | .586 | 5.5 | +115 | W1 |
4 Cubs | 84 | 68 | .553 | 10.5 | +139 | L1 |
5 Phillies | 83 | 68 | .550 | 11 | +28 | L1 |
6 Padres | 82 | 69 | .543 | 12 | +17 | L1 |
7 Diamondbacks | 80 | 72 | .526 | 14.5 | +1 | L1 |
8 Pirates | 75 | 76 | .497 | 19 | +22 | L1 |
9 Marlins | 75 | 77 | .493 | 19.5 | +7 | W1 |
10 Cardinals | 75 | 77 | .493 | 19.5 | -13 | L1 |
11 Nationals | 71 | 81 | .467 | 23.5 | +6 | W4 |
12 Reds | 70 | 81 | .464 | 24 | -152 | L2 |
13 Mets | 69 | 82 | .457 | 25 | -37 | L3 |
14 Giants | 63 | 89 | .414 | 31.5 | -71 | W1 |
15 Rockies | 56 | 95 | .371 | 38 | -164 | W1 |
ATH
VS
TB
Pitchers
Jack Perkins
Catchers
Jonah Heim
Infielders
Jeff McNeil
Zack Gelof
Donovan Walton
Alika Williams
Outfielders
Henry Bolte
Lawrence Butler
Carlos Cortes
Designated Hitters
Shea Langeliers
Pitchers
Griffin Jax
Catchers
Liam Hicks
Infielders
Jonathan Aranda
Junior Caminero
Richie Palacios
Jorge Mateo
Outfielders
Victor Mesa Jr.
Chandler Simpson
Cedric Mullins
Designated Hitters
Yandy Diaz
Athletics
VS
Rays
Batting
151
Team Games Played
150
5121
At Bats
5038
1254
Hits
1312
628
Runs Batted In
650
183
Home Runs
162
83
Stolen Bases
151
.245
Batting Average
.260
657
Runs
684
229
Doubles
206
14
Triples
22
2060
Total Bases
2048
491
Walks
475
1288
Strikeouts
1041
.318
On Base Percentage
.328
.402
Slugging Percentage
.407
.720
OBP Pct + SLG Pct
.735
151
Games Played
150
151
Games Started
150
67
Hit By Pitch
56
0.0
Wins Above Replacement
0.0
0.0
Offensive Wins Above Replacement
0.0
29
Caught Stealing
52
1
Is Qualified
1
653.3
Runs Created
684.1
4.3
Runs Created Per 27 Outs
4.6
.086
Walks Per Plate Appearance
.084
0.38
Walk To Strikeout Ratio
0.46
.157
Isolated Power
.146
.264
Secondary Average
.260
3.81
Pitches Per Plate Appearance
3.76
426
Extra Base Hits
390
5725
Plate Appearances
5659
28.0
At Bats Per Home Run
31.1
19
Sacrifice Hit
45
25
Sacrifice Flies
42
Pitching
151
Team Games Played
150
31
Quality Starts
52
61
Wins
91
90
Losses
59
37
Saves
56
83
Holds
109
1409
Hits
1149
801
Earned runs
559
226
Home Runs
186
593
Walks
376
1263
Strikeouts
1216
8.5
Strikeouts Per 9 Innings
8.2
153.2
Pitches Per Start
139.1
1.50
Walks Plus Hits Per Inning Pitched
1.14
5.40
Earned Run Average
3.76
90
Losses
59
1336.0
Innings pitched
1339.0
.404
Win Percentage
.607
65
Save Opportunities
74
.270
Opponent Batting Average
.229
.349
Opponent's On-base pct.
.287
.462
Opponent's Slugging pct.
.391
.811
Opponent's OPB Pct + SLG Pct
.678
5213
At Bats
5015
274
Doubles
220
24
Triples
16
70
Batters Hit
51
99
Stolen Bases
118
151
Games Played
150
1
Complete Games
1
7
Shutouts
12
47
Wild Pitches
37
834
Runs Batted In
585
8
Balks
3
1336.0
Innings pitched
1339.0
8.5
Strikeouts Per 9 Innings
8.2
38
Caught Stealing
33
151
Games Started
150
0.0
Wins Above Replacement
0.0
1
Is Qualified
1
861
Runs
614
801
Earned Runs
559
2409
Total Bases
1959
Fielding
151
Team Games Played
150
1336
Full Innings
1339
5233
Total Chances
5285
4008
Putouts
4017
1154
Assists
1181
71
Errors
87
229
Double Plays
206
0.986
Fielding Percentage
0.984
34.8
Range Factor
34.9
0.0
Zone Rating
0.0
151
Games Played
150
0
Games Started
0
0.0
Defensive Wins Above Replacement
0.0
1
Qualified
1