

Athletics vs Rays Live Score (17 Sep, 2026)
Game Information
Stage
STD
Season
2026
First Pitch
Thu, Sep 17, 1:10 pm
Venue
Tropicana Field
Location
St. Petersburg, Florida
Venue Type
Indoor
Broadcast
MLB.TV
Attendance
12,305
Live Situation
1Balls
2Strikes
0Outs
—Pitcher
—At Bat
Pitch Sequence
1
BALL
Slider
89 MPH
2
STRIKE LOOKING
Four-seam FB
96 MPH
3
STRIKE SWINGING
Four-seam FB
96 MPH
4
BALL IN PLAY
Slider
90 MPH
Injury Report



Team Stats
 ATH
TB


1
Runs
10
5
Hits
7
2
Errors
1
1
Home Runs
0
3
Walks
9
8
Strikeouts
10
Player Box Score
Athletics
| Player | H-AB | AB | R | H | RBI | HR | BB | K | #P | AVG | OBP | SLG |
|---|---|---|---|---|---|---|---|---|---|---|---|---|
 Henry Bolte | 1-3 | 3 | 0 | 1 | 0 | 0 | 1 | 1 | 16 | .275 | .358 | .402 |
 Jeff McNeil | 0-3 | 3 | 0 | 0 | 0 | 0 | 0 | 1 | 15 | .268 | .315 | .371 |
 Max Muncy | 0-1 | 1 | 0 | 0 | 0 | 0 | 0 | 1 | 4 | .230 | .296 | .387 |
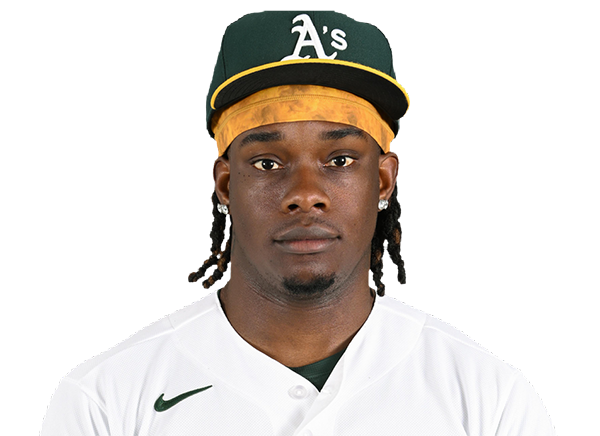 Lawrence Butler | 2-4 | 4 | 1 | 2 | 1 | 1 | 0 | 1 | 13 | .231 | .319 | .390 |
 Zack Gelof | 1-4 | 4 | 0 | 1 | 0 | 0 | 0 | 0 | 11 | .247 | .312 | .450 |
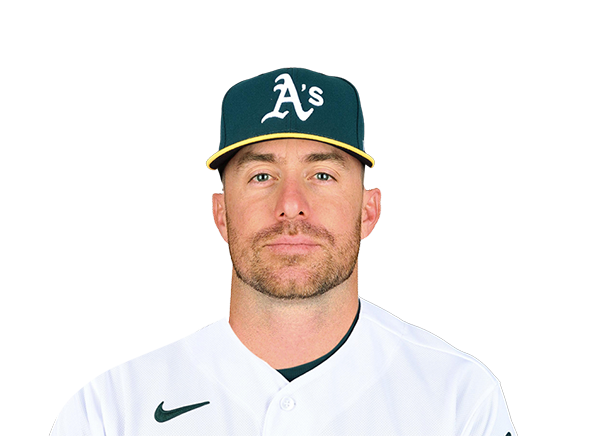 Donovan Walton | 0-3 | 3 | 0 | 0 | 0 | 0 | 0 | 0 | 6 | .260 | .361 | .438 |
 Michael Stefanic | 0-1 | 1 | 0 | 0 | 0 | 0 | 0 | 1 | 7 | .350 | .409 | .400 |
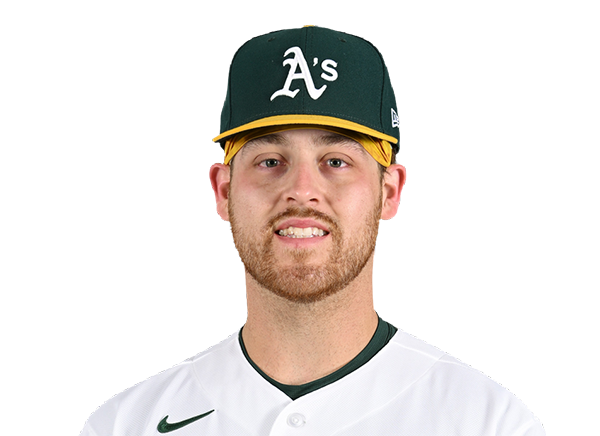 Tommy White | 0-4 | 4 | 0 | 0 | 0 | 0 | 0 | 1 | 13 | .253 | .269 | .335 |
 Alika Williams | 0-3 | 3 | 0 | 0 | 0 | 0 | 1 | 1 | 14 | .256 | .297 | .417 |
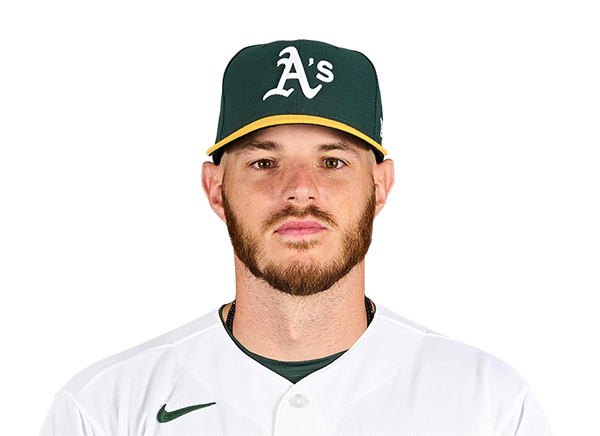 Jonah Heim | 0-4 | 4 | 0 | 0 | 0 | 0 | 0 | 0 | 18 | .205 | .262 | .371 |
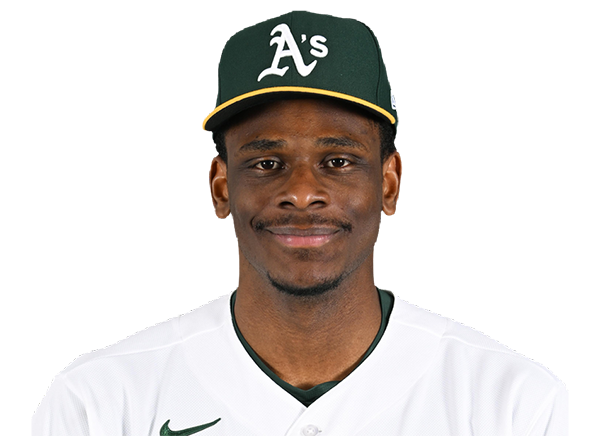 Denzel Clarke | 1-2 | 2 | 0 | 1 | 0 | 0 | 1 | 1 | 14 | .164 | .243 | .179 |
Tampa Bay Rays
| Player | H-AB | AB | R | H | RBI | HR | BB | K | #P | AVG | OBP | SLG |
|---|---|---|---|---|---|---|---|---|---|---|---|---|
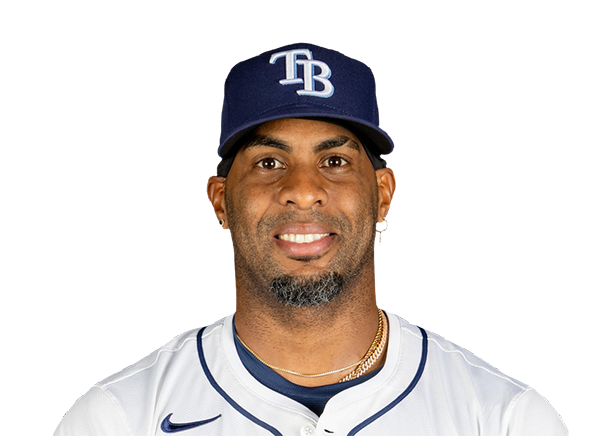 Yandy Diaz | 0-5 | 5 | 0 | 0 | 0 | 0 | 0 | 2 | 17 | .295 | .359 | .453 |
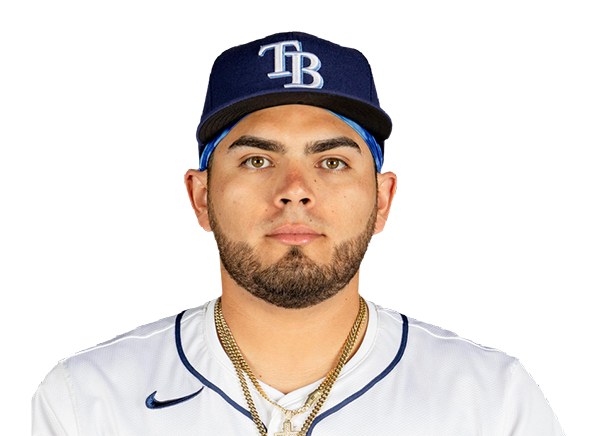 Jonathan Aranda | 1-4 | 4 | 1 | 1 | 1 | 0 | 1 | 2 | 25 | .278 | .362 | .437 |
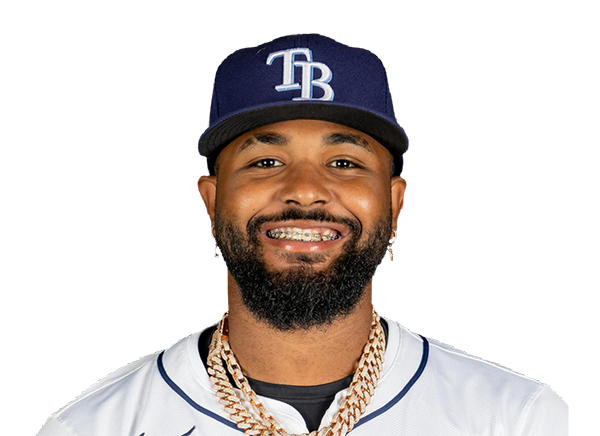 Junior Caminero | 0-3 | 3 | 1 | 0 | 0 | 0 | 2 | 1 | 23 | .277 | .363 | .532 |
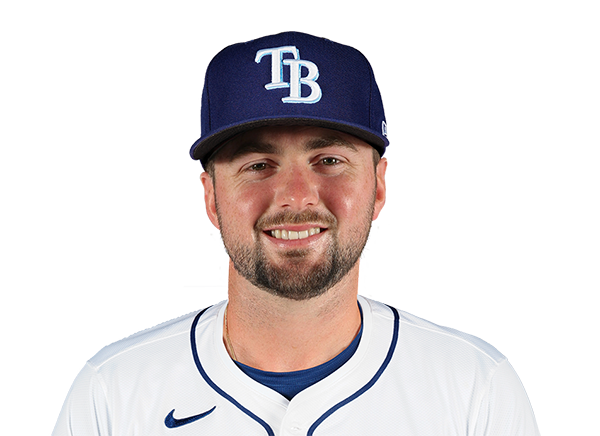 Liam Hicks | 2-4 | 4 | 1 | 2 | 2 | 0 | 1 | 1 | 16 | .286 | .369 | .440 |
 Jonny DeLuca | 0-3 | 3 | 1 | 0 | 0 | 0 | 0 | 1 | 12 | .263 | .295 | .416 |
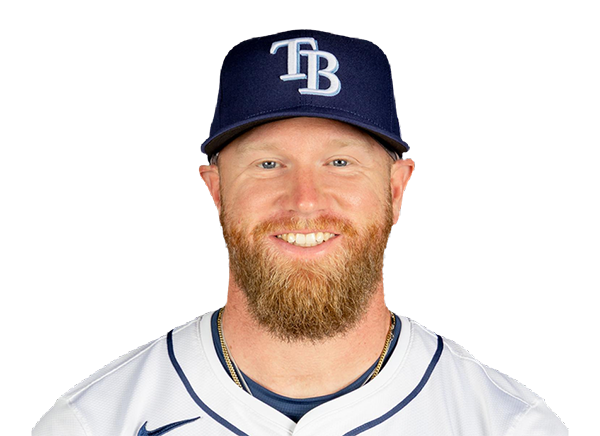 Jake Fraley | 0-1 | 1 | 0 | 0 | 0 | 0 | 1 | 1 | 8 | .229 | .304 | .386 |
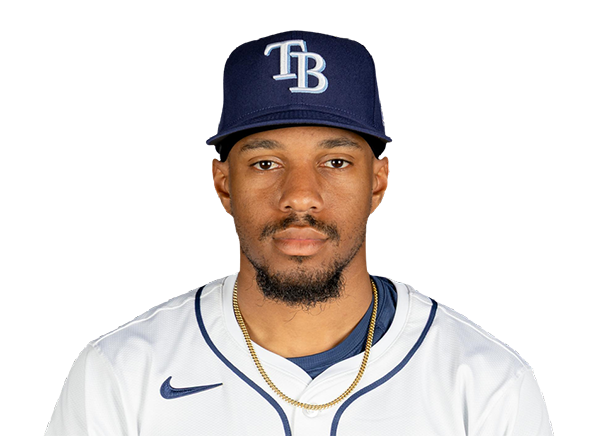 Chandler Simpson | 2-5 | 5 | 2 | 2 | 2 | 0 | 0 | 0 | 13 | .311 | .339 | .362 |
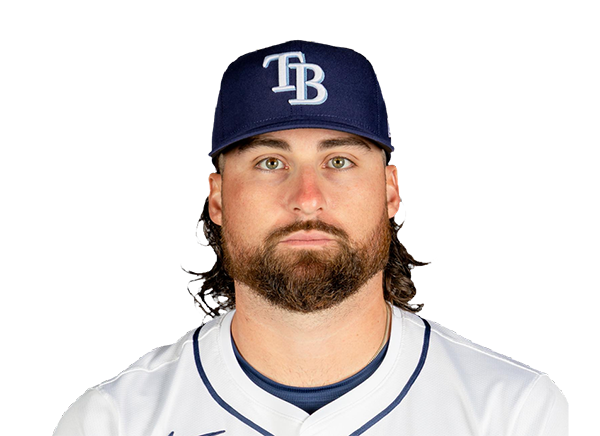 Ryan Vilade | 0-1 | 1 | 1 | 0 | 0 | 0 | 1 | 1 | 15 | .259 | .331 | .464 |
 Cedric Mullins | 0-1 | 1 | 1 | 0 | 0 | 0 | 0 | 0 | 3 | .201 | .282 | .340 |
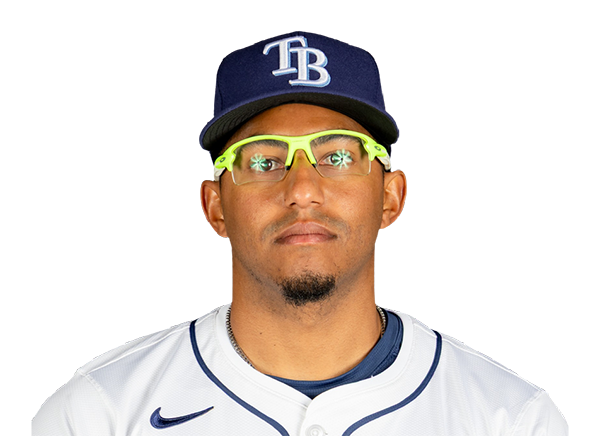 Richie Palacios | 1-2 | 2 | 1 | 1 | 2 | 0 | 2 | 0 | 19 | .234 | .331 | .378 |
 Taylor Walls | 1-3 | 3 | 1 | 1 | 2 | 0 | 1 | 1 | 21 | .219 | .306 | .293 |
Athletics
| Player | IP | H | R | ER | BB | K | HR | PC-ST | ERA | PC |
|---|---|---|---|---|---|---|---|---|---|---|
 Jeffrey Springs | 3.1 | 5 | 6 | 6 | 2 | 4 | 0 | 66-39 | 6.18 | 66 |
 Geoff Hartlieb | 1.2 | 0 | 0 | 0 | 0 | 2 | 0 | 18-12 | 3.86 | 18 |
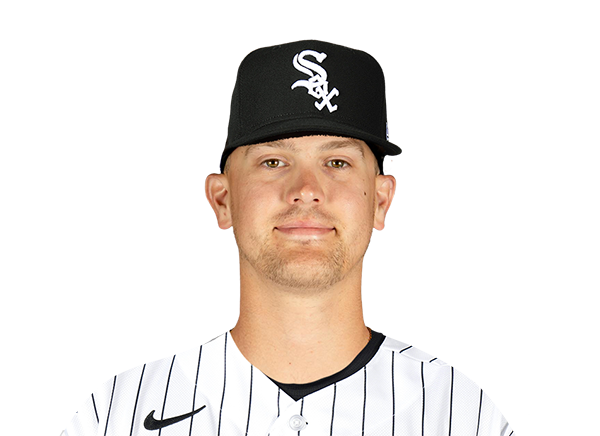 Joe Rock | 0.0 | 1 | 2 | 2 | 2 | 0 | 0 | 16-8 | 5.23 | 16 |
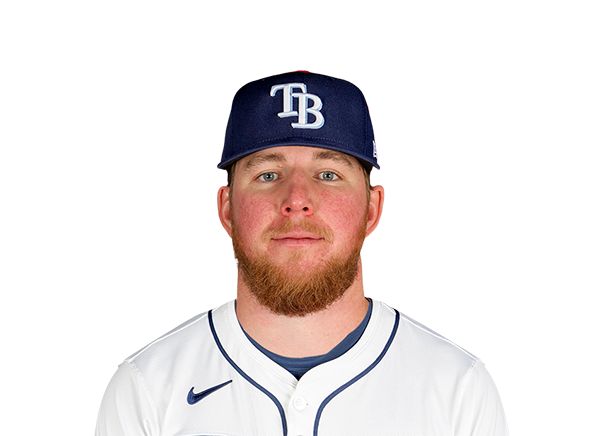 Chris Roycroft | 1.0 | 0 | 0 | 0 | 2 | 2 | 0 | 27-15 | 6.35 | 27 |
 Yunior Tur | 1.2 | 1 | 2 | 0 | 3 | 2 | 0 | 41-20 | 16.55 | 41 |
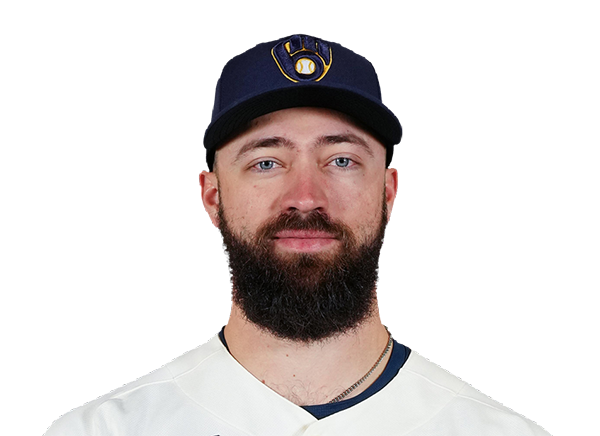 Drew Rom | 0.1 | 0 | 0 | 0 | 0 | 0 | 0 | 4-2 | 5.84 | 4 |
Tampa Bay Rays
| Player | IP | H | R | ER | BB | K | HR | PC-ST | ERA | PC |
|---|---|---|---|---|---|---|---|---|---|---|
 Drew Rasmussen | 5.0 | 4 | 0 | 0 | 2 | 3 | 0 | 76-51 | 2.72 | 76 |
 Casey Legumina | 1.0 | 1 | 1 | 1 | 0 | 0 | 1 | 11-8 | 4.01 | 11 |
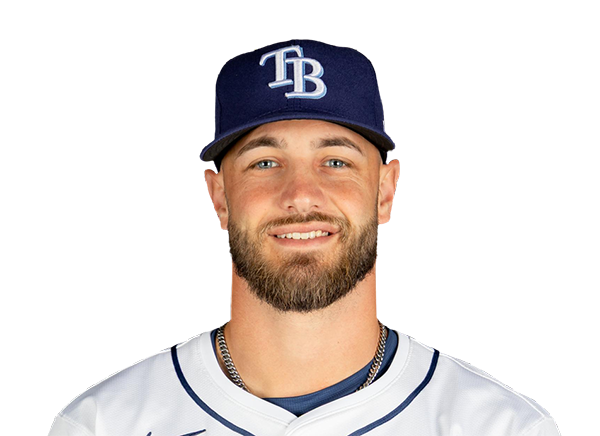 Brody Hopkins | 1.0 | 0 | 0 | 0 | 1 | 1 | 0 | 17-10 | 9.00 | 17 |
 Steven Matz | 1.0 | 0 | 0 | 0 | 0 | 2 | 0 | 14-10 | 5.57 | 14 |
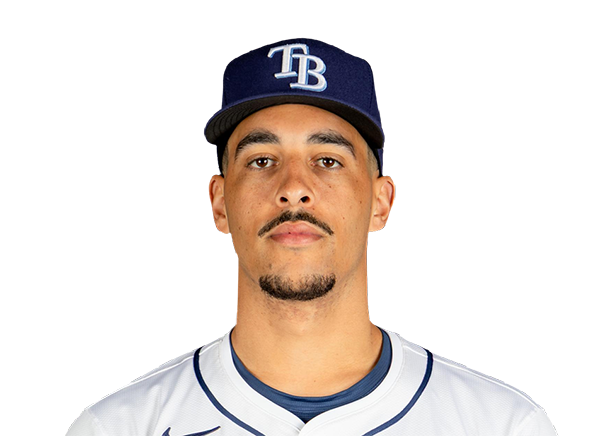 Alexander Cook | 1.0 | 0 | 0 | 0 | 0 | 2 | 0 | 13-9 | 5.79 | 13 |
H2H / Season Series
TB10–1
ATH
TB4–3
ATH
TB2–1
ATH
ATH4–8
TB
ATH4–12
TB
ATH6–10
TB
Last 5 Games
| Date | Opponent | Result |
|---|---|---|
| Sep 17 | @ TB | L1–10 |
| Sep 16 | @ TB | L3–4 |
| Sep 15 | @ TB | L1–2 |
| Sep 13 |  vs SEA | W8–7 |
| Sep 12 | vs SEA | L1–19 |
| Date | Opponent | Result |
|---|---|---|
| Sep 17 | vs ATH | W10–1 |
| Sep 16 | vs ATH | W4–3 |
| Sep 15 | vs ATH | W2–1 |
| Sep 13 |  vs HOU | W14–4 |
| Sep 12 | vs HOU | W3–2 |
Standings
American League
| Team | W | L | PCT | GB | DIFF | STRK |
|---|---|---|---|---|---|---|
| 1Rays | 93 | 59 | .612 | - | +80 | W6 |
2 White Sox | 78 | 75 | .510 | 15.5 | +36 | W1 |
| 3Astros | 77 | 76 | .503 | 16.5 | -50 | W1 |
4 Yankees | 88 | 64 | .579 | 5 | +136 | L1 |
5 Red Sox | 83 | 70 | .542 | 10.5 | +83 | W1 |
6 Guardians | 78 | 75 | .510 | 15.5 | -7 | W2 |
7 Rangers | 76 | 77 | .497 | 17.5 | -39 | L1 |
8 Blue Jays | 76 | 77 | .497 | 17.5 | -37 | W1 |
9 Orioles | 75 | 78 | .490 | 18.5 | -26 | W3 |
10 Tigers | 72 | 81 | .471 | 21.5 | +74 | L2 |
| 11Mariners | 71 | 82 | .464 | 22.5 | -56 | W1 |
12 Twins | 71 | 82 | .464 | 22.5 | -74 | L1 |
13 Royals | 67 | 86 | .438 | 26.5 | -97 | L1 |
| 14Athletics | 61 | 92 | .399 | 32.5 | -214 | L3 |
15 Angels | 59 | 94 | .386 | 34.5 | -77 | W1 |
National League
| Team | W | L | PCT | GB | DIFF | STRK |
|---|---|---|---|---|---|---|
1 Brewers | 95 | 58 | .621 | - | +197 | L1 |
2 Dodgers | 93 | 60 | .608 | 2 | +179 | W1 |
3 Braves | 89 | 64 | .582 | 6 | +111 | L1 |
4 Cubs | 85 | 68 | .556 | 10 | +143 | W1 |
5 Phillies | 85 | 68 | .556 | 10 | +34 | W2 |
6 Padres | 84 | 69 | .549 | 11 | +30 | W2 |
7 Diamondbacks | 80 | 73 | .523 | 15 | 0 | L2 |
8 Marlins | 76 | 77 | .497 | 19 | +8 | W2 |
9 Pirates | 76 | 77 | .497 | 19 | +24 | W1 |
10 Cardinals | 75 | 78 | .490 | 20 | -14 | L2 |
11 Nationals | 71 | 82 | .464 | 24 | +3 | L1 |
12 Reds | 71 | 82 | .464 | 24 | -154 | L1 |
13 Mets | 69 | 84 | .451 | 26 | -46 | L5 |
14 Giants | 64 | 89 | .418 | 31 | -70 | W2 |
15 Rockies | 56 | 97 | .366 | 39 | -177 | L2 |
ATH
VS
TB
Pitchers
Jeffrey Springs
Catchers
Jonah Heim
Infielders
Zack Gelof
Donovan Walton
Tommy White
Alika Williams
Outfielders
Henry Bolte
Lawrence Butler
Denzel Clarke
Designated Hitters
Jeff McNeil
Pitchers
Drew Rasmussen
Catchers
Liam Hicks
Infielders
Jonathan Aranda
Junior Caminero
Richie Palacios
Taylor Walls
Outfielders
Jonny DeLuca
Chandler Simpson
Ryan Vilade
Designated Hitters
Yandy Diaz
Athletics
VS
Rays
Batting
153
Team Games Played
152
5187
At Bats
5104
1267
Hits
1328
632
Runs Batted In
663
186
Home Runs
162
87
Stolen Bases
156
.244
Batting Average
.260
661
Runs
698
230
Doubles
213
14
Triples
22
2083
Total Bases
2071
494
Walks
484
1304
Strikeouts
1057
.317
On Base Percentage
.329
.402
Slugging Percentage
.406
.718
OBP Pct + SLG Pct
.734
153
Games Played
152
153
Games Started
152
67
Hit By Pitch
57
0.0
Wins Above Replacement
0.0
0.0
Offensive Wins Above Replacement
0.0
29
Caught Stealing
52
1
Is Qualified
1
658.5
Runs Created
693.8
4.3
Runs Created Per 27 Outs
4.7
.085
Walks Per Plate Appearance
.084
0.38
Walk To Strikeout Ratio
0.46
.157
Isolated Power
.146
.264
Secondary Average
.261
3.81
Pitches Per Plate Appearance
3.76
430
Extra Base Hits
397
5794
Plate Appearances
5735
27.9
At Bats Per Home Run
31.5
19
Sacrifice Hit
45
25
Sacrifice Flies
42
Pitching
153
Team Games Played
152
31
Quality Starts
52
61
Wins
93
92
Losses
59
37
Saves
57
83
Holds
111
1425
Hits
1162
813
Earned runs
563
226
Home Runs
189
602
Walks
379
1279
Strikeouts
1232
8.5
Strikeouts Per 9 Innings
8.2
153.1
Pitches Per Start
139.0
1.50
Walks Plus Hits Per Inning Pitched
1.14
5.41
Earned Run Average
3.73
92
Losses
59
1352.0
Innings pitched
1357.0
.399
Win Percentage
.612
65
Save Opportunities
75
.270
Opponent Batting Average
.229
.349
Opponent's On-base pct.
.286
.461
Opponent's Slugging pct.
.390
.810
Opponent's OPB Pct + SLG Pct
.677
5279
At Bats
5081
281
Doubles
221
24
Triples
16
71
Batters Hit
51
104
Stolen Bases
122
153
Games Played
152
1
Complete Games
1
7
Shutouts
12
47
Wild Pitches
38
847
Runs Batted In
589
8
Balks
3
1352.0
Innings pitched
1357.0
8.5
Strikeouts Per 9 Innings
8.2
38
Caught Stealing
33
153
Games Started
152
0.0
Wins Above Replacement
0.0
1
Is Qualified
1
875
Runs
618
813
Earned Runs
563
2432
Total Bases
1982
Fielding
153
Team Games Played
152
1352
Full Innings
1357
5298
Total Chances
5362
4056
Putouts
4071
1168
Assists
1203
74
Errors
88
230
Double Plays
213
0.986
Fielding Percentage
0.984
34.8
Range Factor
35.0
0.0
Zone Rating
0.0
153
Games Played
152
0
Games Started
0
0.0
Defensive Wins Above Replacement
0.0
1
Qualified
1