

Athletics vs Reds Live Score (4 Aug, 2026)
Game Information
Stage
Standard
Season
2026
First Pitch
Tue, Aug 4, 6:40 pm
Venue
Great American Ball Park
Location
Cincinnati, Ohio
Attendance
21,714
Live Situation
1Balls
3Strikes
0Outs
—Pitcher
—At Bat
Pitch Sequence
1
STRIKE SWINGING
Splitter
82 MPH
2
STRIKE LOOKING
Four-seam FB
94 MPH
3
BALL
Splitter
82 MPH
4
STRIKE FOUL
Four-seam FB
96 MPH
5
STRIKE SWINGING
Cutter
85 MPH
Injury Report
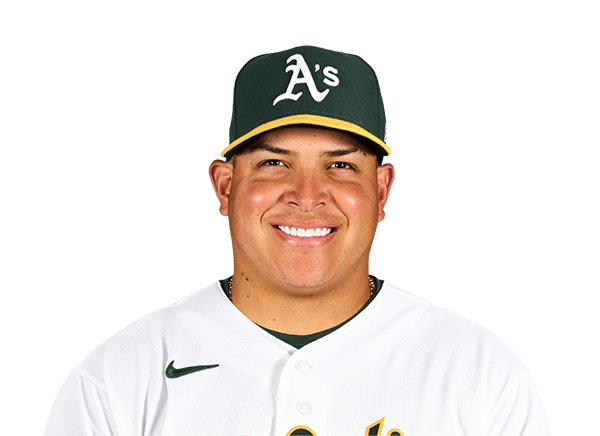
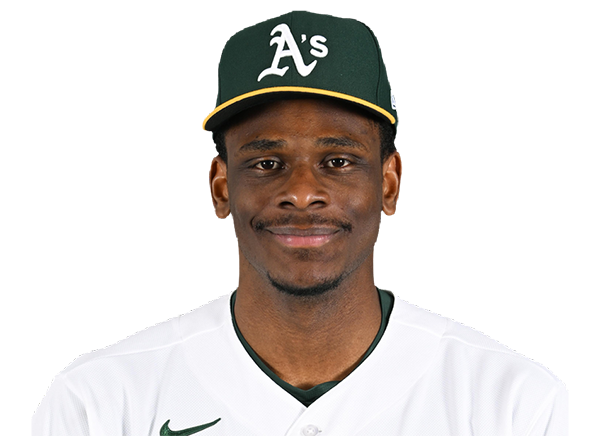
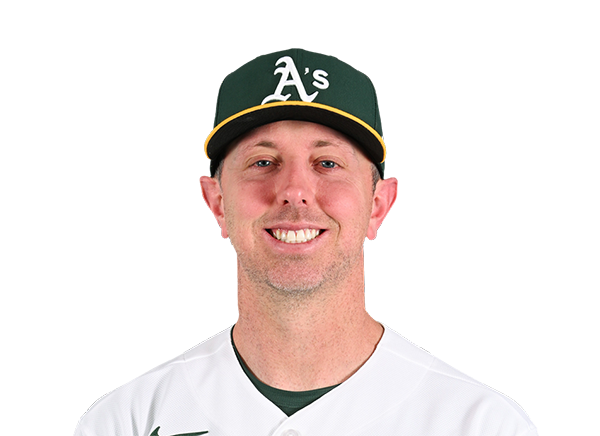
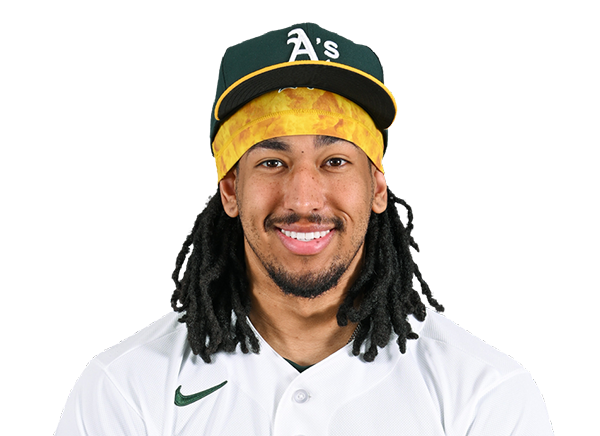


Team Stats
 ATH
CIN


4
Runs
5
8
Hits
5
0
Errors
1
0
Home Runs
0
3
Walks
5
9
Strikeouts
7
Player Box Score
Athletics
| Player | H-AB | AB | R | H | RBI | HR | BB | K | #P | AVG | OBP | SLG |
|---|---|---|---|---|---|---|---|---|---|---|---|---|
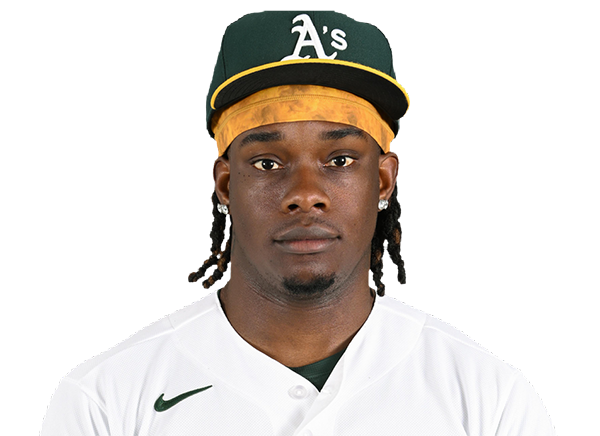 Lawrence Butler | 0-4 | 4 | 1 | 0 | 0 | 0 | 1 | 2 | 24 | .208 | .305 | .322 |
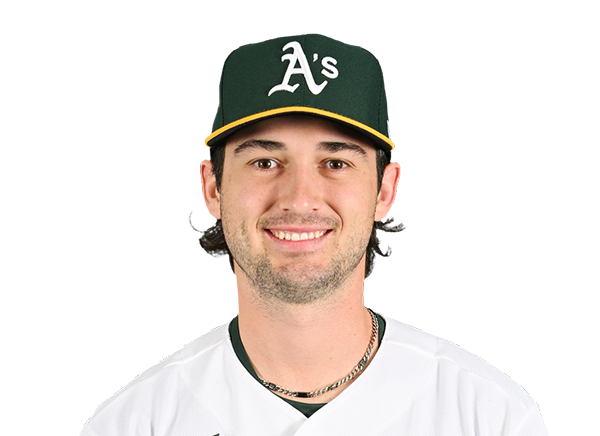 Jacob Wilson | 1-4 | 4 | 0 | 1 | 2 | 0 | 0 | 1 | 15 | .274 | .306 | .397 |
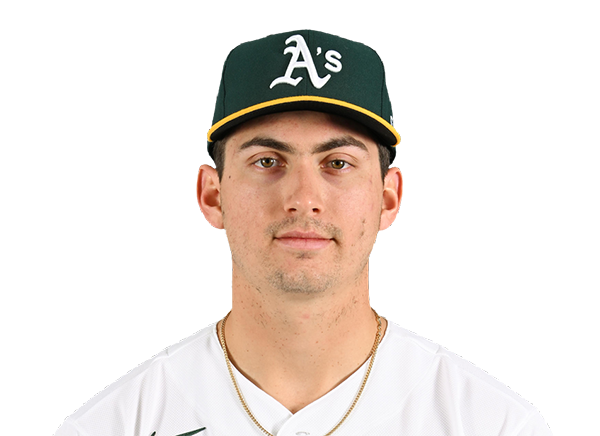 Tyler Soderstrom | 1-3 | 3 | 1 | 1 | 0 | 0 | 1 | 1 | 23 | .243 | .337 | .462 |
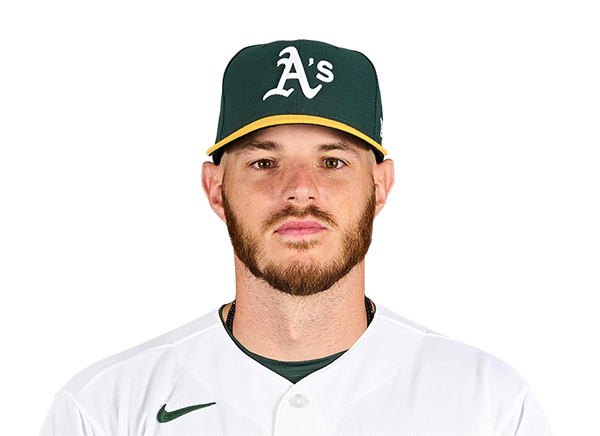 Jonah Heim | 0-4 | 4 | 0 | 0 | 0 | 0 | 0 | 1 | 18 | .227 | .275 | .432 |
 Jeff McNeil | 2-4 | 4 | 0 | 2 | 1 | 0 | 0 | 2 | 13 | .254 | .311 | .334 |
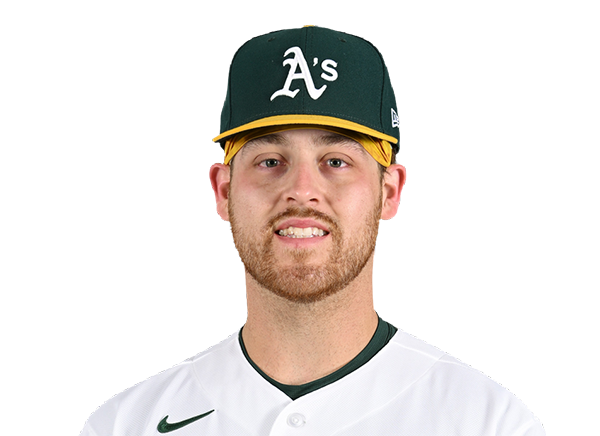 Tommy White | 0-4 | 4 | 0 | 0 | 0 | 0 | 0 | 1 | 14 | .266 | .288 | .297 |
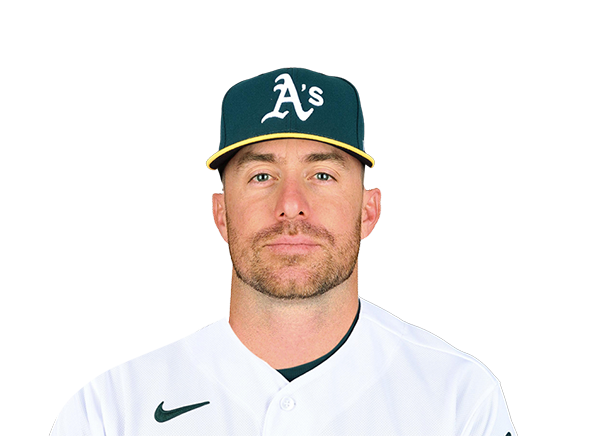 Donovan Walton | 0-1 | 1 | 1 | 0 | 0 | 0 | 1 | 0 | 14 | .179 | .395 | .286 |
 Alika Williams | 1-2 | 2 | 0 | 1 | 0 | 0 | 0 | 0 | 9 | .270 | .298 | .409 |
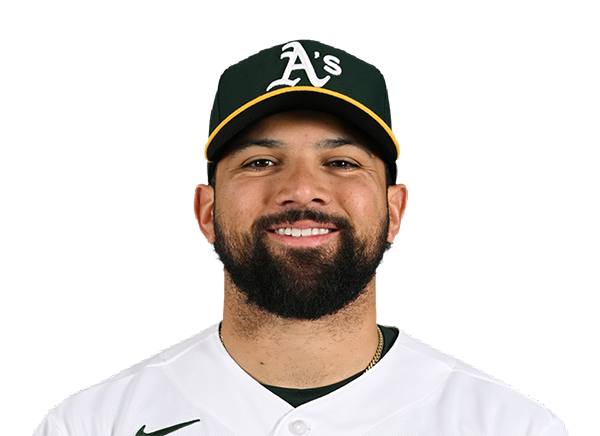 Carlos Cortes | 0-2 | 2 | 0 | 0 | 0 | 0 | 0 | 1 | 5 | .260 | .336 | .411 |
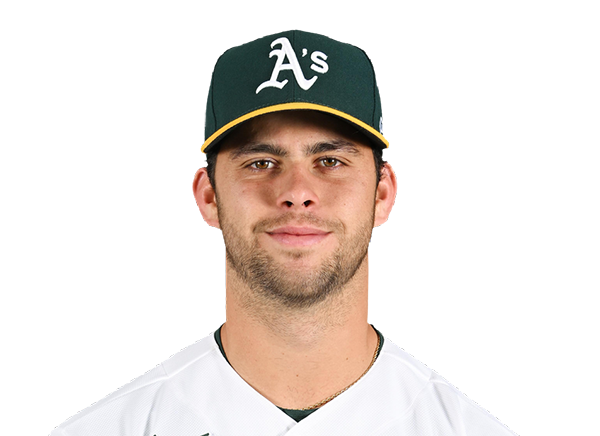 Max Muncy | 0-2 | 2 | 0 | 0 | 0 | 0 | 0 | 0 | 5 | .220 | .294 | .384 |
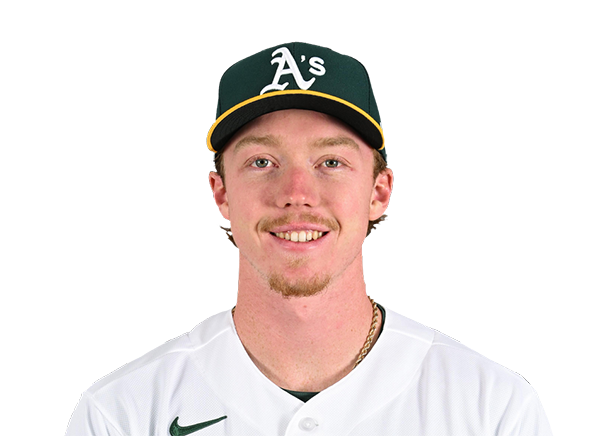 Henry Bolte | 3-4 | 4 | 1 | 3 | 0 | 0 | 0 | 0 | 9 | .262 | .345 | .353 |
Cincinnati Reds
| Player | H-AB | AB | R | H | RBI | HR | BB | K | #P | AVG | OBP | SLG |
|---|---|---|---|---|---|---|---|---|---|---|---|---|
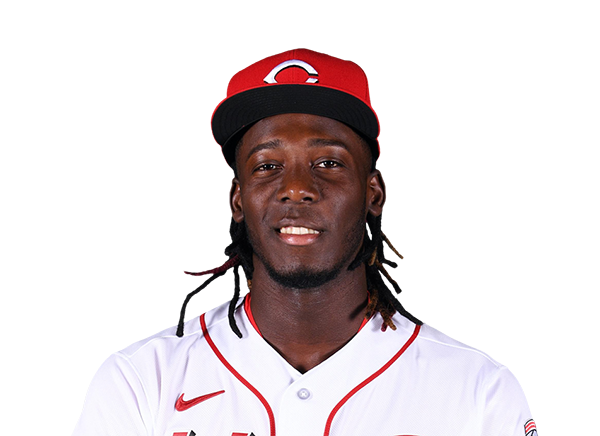 Elly De La Cruz | 1-3 | 3 | 2 | 1 | 2 | 0 | 1 | 1 | 13 | .276 | .356 | .499 |
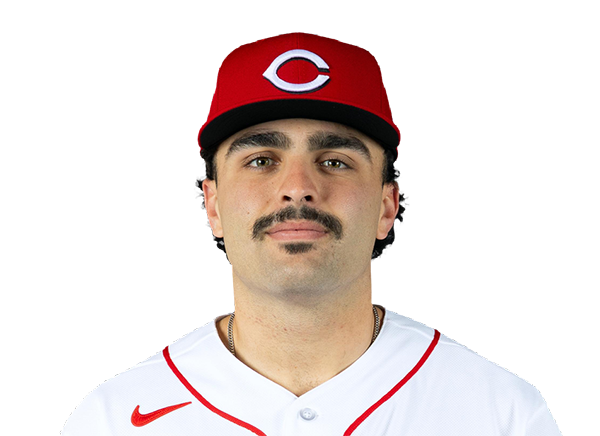 Sal Stewart | 1-2 | 2 | 1 | 1 | 1 | 0 | 1 | 0 | 21 | .255 | .335 | .479 |
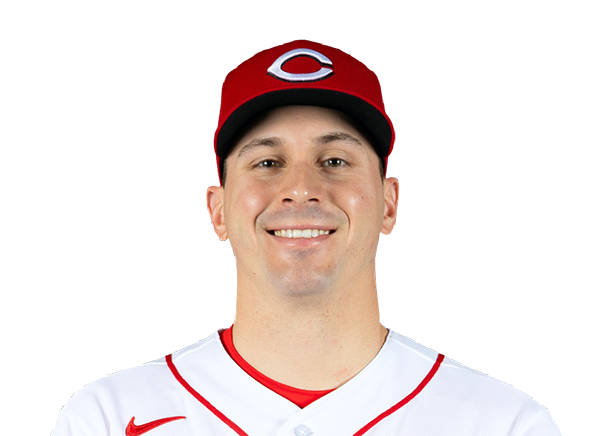 JJ Bleday | 1-3 | 3 | 0 | 1 | 0 | 0 | 1 | 2 | 16 | .228 | .343 | .463 |
 Tyler Stephenson | 0-4 | 4 | 0 | 0 | 0 | 0 | 0 | 0 | 12 | .252 | .338 | .411 |
 Eugenio Suarez | 1-3 | 3 | 0 | 1 | 0 | 0 | 1 | 1 | 16 | .202 | .278 | .387 |
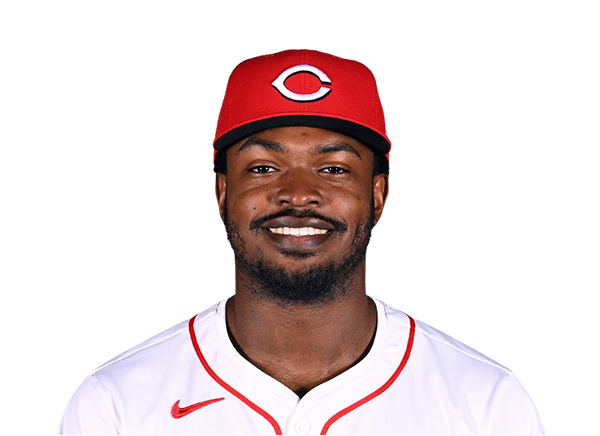 Ivan Johnson | 0-0 | 0 | 0 | 0 | 0 | 0 | 0 | 0 | 0 | .100 | .250 | .100 |
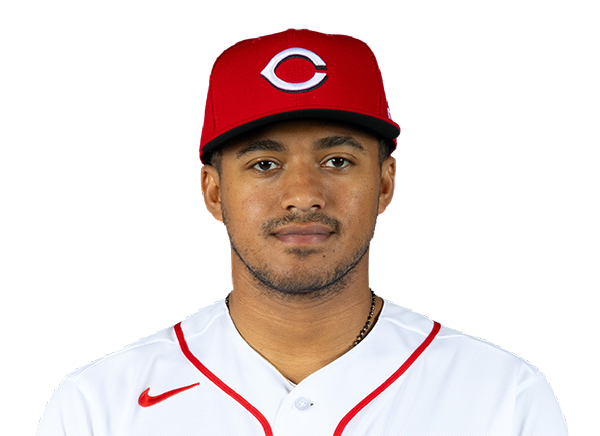 Dane Myers | 0-4 | 4 | 0 | 0 | 0 | 0 | 0 | 2 | 19 | .268 | .366 | .372 |
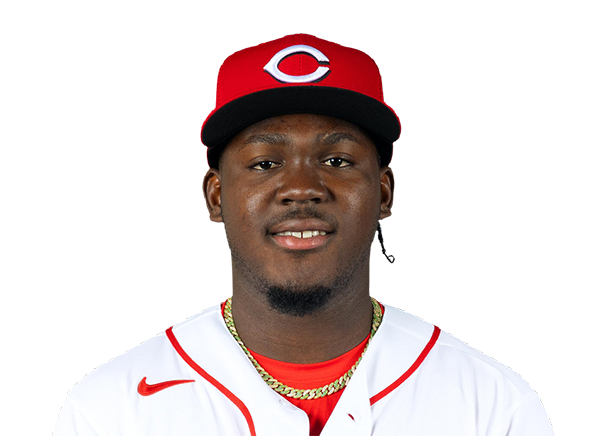 Hector Rodriguez | 0-2 | 2 | 1 | 0 | 0 | 0 | 1 | 0 | 10 | .000 | .333 | .000 |
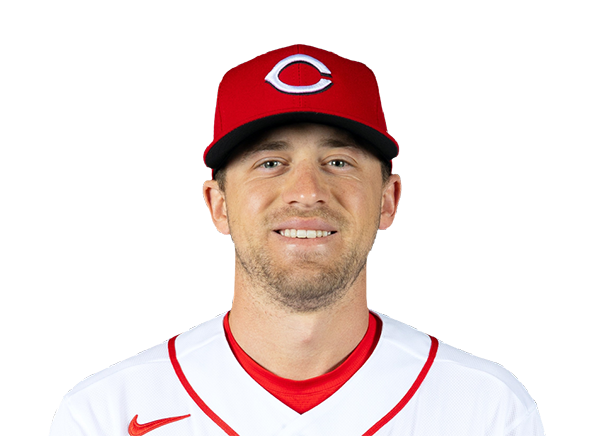 TJ Friedl | 0-0 | 0 | 0 | 0 | 0 | 0 | 0 | 0 | 0 | .165 | .251 | .248 |
 Ke'Bryan Hayes | 0-3 | 3 | 0 | 0 | 0 | 0 | 0 | 1 | 12 | .142 | .199 | .245 |
 Matt McLain | 1-3 | 3 | 1 | 1 | 0 | 0 | 0 | 0 | 13 | .190 | .289 | .324 |
Athletics
| Player | IP | H | R | ER | BB | K | HR | PC-ST | ERA | PC |
|---|---|---|---|---|---|---|---|---|---|---|
 J.T. Ginn | 6.0 | 5 | 3 | 3 | 2 | 5 | 0 | 91-54 | 3.51 | 91 |
 Brady Basso | 1.0 | 0 | 0 | 0 | 0 | 0 | 0 | 11-8 | 5.40 | 11 |
 Hogan Harris | 0.2 | 0 | 2 | 2 | 3 | 1 | 0 | 24-11 | 3.62 | 24 |
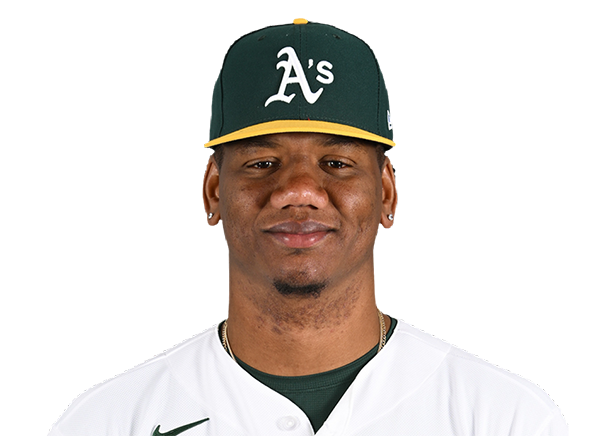 Elvis Alvarado | 0.1 | 0 | 0 | 0 | 0 | 1 | 0 | 6-4 | 4.67 | 6 |
Cincinnati Reds
| Player | IP | H | R | ER | BB | K | HR | PC-ST | ERA | PC |
|---|---|---|---|---|---|---|---|---|---|---|
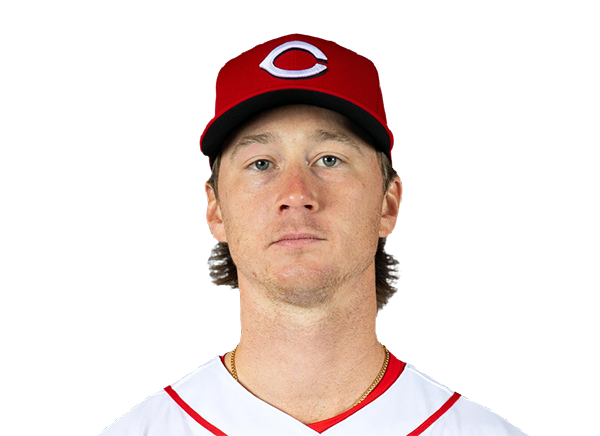 Brady Singer | 6.0 | 5 | 3 | 3 | 3 | 6 | 0 | 101-59 | 4.67 | 101 |
 Sam Moll | 1.0 | 1 | 1 | 0 | 0 | 0 | 0 | 20-14 | 4.17 | 20 |
|
Julian Garcia | 1.0 | 0 | 0 | 0 | 0 | 2 | 0 | 14-12 | 2.18 | 14 |
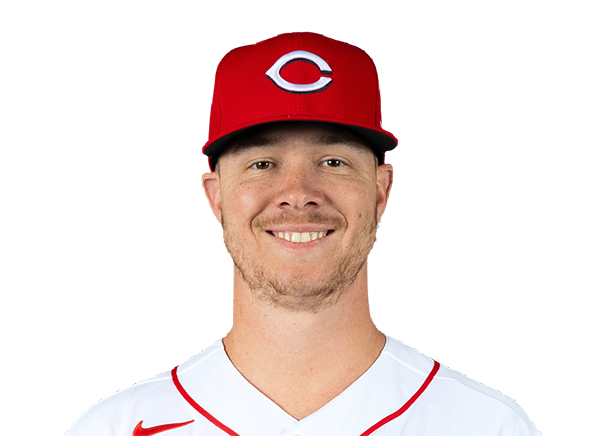 Emilio Pagan | 1.0 | 2 | 0 | 0 | 0 | 1 | 0 | 14-11 | 4.44 | 14 |
H2H / Season Series
CIN6–5
ATH
CIN3–2
ATH
CIN5–4
ATH
CIN7–9
ATH
ATH12–4
CIN
Last 5 Games
| Date | Opponent | Result |
|---|---|---|
| Aug 24 |  vs MIN | L6–9 |
| Aug 23 |  @ HOU | W7–6 |
| Aug 22 | @ HOU | W4–3 |
| Aug 21 | @ HOU | L0–4 |
| Aug 20 |  @ KC | L2–6 |
| Date | Opponent | Result |
|---|---|---|
| Aug 24 |  @ SF | L0–5 |
| Aug 23 |  @ ARI | L3–5 |
| Aug 22 | @ ARI | W11–5 |
| Aug 21 | @ ARI | L0–9 |
| Aug 20 |  vs STL | L9–10 |
Standings
American League
| Team | W | L | PCT | GB | DIFF | STRK |
|---|---|---|---|---|---|---|
1 Rays | 78 | 53 | .595 | - | +47 | W2 |
2 White Sox | 68 | 63 | .519 | 10 | +34 | L1 |
3 Rangers | 66 | 66 | .500 | 12.5 | -37 | W2 |
4 Yankees | 74 | 56 | .569 | 3.5 | +100 | W1 |
5 Red Sox | 72 | 59 | .550 | 6 | +101 | W4 |
6 Guardians | 66 | 66 | .500 | 12.5 | -7 | W5 |
| 7Astros | 65 | 66 | .496 | 13 | -44 | L2 |
| 8Twins | 64 | 68 | .485 | 14.5 | -51 | W1 |
9 Blue Jays | 64 | 68 | .485 | 14.5 | -55 | L1 |
10 Orioles | 63 | 68 | .481 | 15 | -35 | L1 |
11 Mariners | 63 | 69 | .477 | 15.5 | -54 | W1 |
12 Tigers | 61 | 70 | .466 | 17 | +70 | L6 |
| 13Royals | 58 | 74 | .439 | 20.5 | -91 | W8 |
14 Angels | 52 | 80 | .394 | 26.5 | -72 | L2 |
| 15Athletics | 51 | 81 | .386 | 27.5 | -190 | L1 |
National League
| Team | W | L | PCT | GB | DIFF | STRK |
|---|---|---|---|---|---|---|
1 Brewers | 81 | 50 | .618 | - | +161 | L1 |
2 Dodgers | 80 | 51 | .611 | 1 | +151 | W6 |
3 Braves | 76 | 55 | .580 | 5 | +110 | W1 |
4 Cubs | 76 | 56 | .576 | 5.5 | +122 | W2 |
5 Phillies | 73 | 59 | .553 | 8.5 | +20 | L1 |
6 Padres | 71 | 61 | .538 | 10.5 | +15 | L1 |
| 7Diamondbacks | 69 | 63 | .523 | 12.5 | +2 | L1 |
8 Marlins | 67 | 65 | .508 | 14.5 | +19 | L1 |
| 9Cardinals | 66 | 66 | .500 | 15.5 | -2 | L3 |
10 Pirates | 64 | 69 | .481 | 18 | +26 | W1 |
| 11Reds | 62 | 70 | .470 | 19.5 | -99 | L2 |
12 Nationals | 62 | 71 | .466 | 20 | +20 | W1 |
13 Mets | 59 | 72 | .450 | 22 | -40 | L1 |
| 14Giants | 53 | 78 | .405 | 28 | -75 | W1 |
15 Rockies | 50 | 81 | .382 | 31 | -146 | L7 |
ATH
VS
CIN
Pitchers
J.T. Ginn
Catchers
Jonah Heim
Infielders
Jacob Wilson
Jeff McNeil
Tommy White
Donovan Walton
Outfielders
Lawrence Butler
Tyler Soderstrom
Henry Bolte
Designated Hitters
Carlos Cortes
Pitchers
Brady Singer
Catchers
Tyler Stephenson
Infielders
Elly De La Cruz
Sal Stewart
Ke'Bryan Hayes
Matt McLain
Outfielders
JJ Bleday
Dane Myers
Hector Rodriguez
Designated Hitters
Eugenio Suarez
Athletics
VS
Reds
Batting
113
Team Games Played
112
3843
At Bats
3741
942
Hits
860
471
Runs Batted In
444
134
Home Runs
145
57
Stolen Bases
81
.245
Batting Average
.230
491
Runs
467
175
Doubles
168
10
Triples
11
1539
Total Bases
1485
384
Walks
412
981
Strikeouts
1064
.320
On Base Percentage
.310
.400
Slugging Percentage
.397
.721
OBP Pct + SLG Pct
.707
113
Games Played
112
113
Games Started
112
51
Hit By Pitch
35
0.0
Wins Above Replacement
0.0
0.0
Offensive Wins Above Replacement
0.0
23
Caught Stealing
25
1
Is Qualified
1
492.9
Runs Created
473.6
4.4
Runs Created Per 27 Outs
4.3
.089
Walks Per Plate Appearance
.097
0.39
Walk To Strikeout Ratio
0.39
.155
Isolated Power
.167
.264
Secondary Average
.292
3.81
Pitches Per Plate Appearance
3.92
319
Extra Base Hits
324
4317
Plate Appearances
4228
28.7
At Bats Per Home Run
25.8
17
Sacrifice Hit
14
21
Sacrifice Flies
23
Pitching
113
Team Games Played
112
22
Quality Starts
37
45
Wins
54
68
Losses
58
27
Saves
27
62
Holds
62
1049
Hits
927
604
Earned runs
487
176
Home Runs
141
454
Walks
478
960
Strikeouts
899
8.6
Strikeouts Per 9 Innings
8.1
154.3
Pitches Per Start
153.3
1.50
Walks Plus Hits Per Inning Pitched
1.41
5.42
Earned Run Average
4.40
68
Losses
58
1003.1
Innings pitched
997.0
.398
Win Percentage
.482
50
Save Opportunities
45
.268
Opponent Batting Average
.245
.349
Opponent's On-base pct.
.335
.466
Opponent's Slugging pct.
.409
.815
Opponent's OPB Pct + SLG Pct
.744
3910
At Bats
3787
206
Doubles
159
19
Triples
20
56
Batters Hit
54
72
Stolen Bases
108
113
Games Played
112
1
Complete Games
0
6
Shutouts
7
32
Wild Pitches
29
627
Runs Batted In
512
6
Balks
2
1003.1
Innings pitched
997.0
8.6
Strikeouts Per 9 Innings
8.1
27
Caught Stealing
23
113
Games Started
112
0.0
Wins Above Replacement
0.0
1
Is Qualified
1
646
Runs
529
604
Earned Runs
487
1821
Total Bases
1549
Fielding
113
Team Games Played
112
1003
Full Innings
997
3907
Total Chances
3960
3010
Putouts
2991
848
Assists
909
49
Errors
60
175
Double Plays
168
0.987
Fielding Percentage
0.985
34.6
Range Factor
35.2
0.0
Zone Rating
0.0
113
Games Played
112
0
Games Started
0
0.0
Defensive Wins Above Replacement
0.0
1
Qualified
1